My indicators derived from the stochastic were in exactly the same pattern as they are now twice in 2005. Once in mid to late February and once in early November.
In the first case there was an upturn in the stochs from a high level and a small spike in the stochastics and a small but essentially failed rally. That is what I am betting on here. But in early November the upturn turned into a massive overbought rally.
So distinguishing between the two situations is of utmost importance :)
I'm still short but the market has been rising. In reaction I have dug up a tool I developed to help forecast the most bullish of my indicators. I had been skeptical that this tool was useful. But maybe it is useful in just such a situation. It says to be long at the moment. An alternative is if, for example, your standard position is 3000 shares, to allocate 1000 shares to each of the three indicators. So on a day like today where two indicators are short and one is long you would be theoretically short 2000 shares and long 1000 shares and, therefore, in practice short 1000 shares. I have read people discussing allocating their trading capital across multiple models and indicators. It could make sense. It is an agnostic approach to market direction.
I also found a distinction between February and November 2005. In November the fast %K stochastic was very strong - over 90 on the day that is the best analog for today. In February it was declining and around 80. If today ends up not too much it is going to look more like February and the case for the failed rally hypothesis will be strengthened.
Thursday, August 31, 2006
Tuesday, August 29, 2006
Confusing Market Action
Bulls and bears both seem confused at this point. One bear calls for a week of sideways action. This morning the Federal Reserve did a massive permanent open market operation - i.e. buying bonds and putting new money into the money supply. Someone on Silicon Investor who follows the Fed closely said it was the biggest he's seen. Changes in money supply in both Japan and the US often have a strong relation with stock market action. So in retrospect it wasn't surprising then that the market went up. I'm still puzzled about what is the causal driver in these money supply changes - is it market players or the monetary authority? Most commentators seem to assume that it is the Central Bank that drive these actions. However, standard macro theory says it would be investors and traders driving the Central Bank to respond.
In other news my "other model" - what I call the "autoregressive model" (as opposed to the "stochastic model" - both nicely obscure names :)) - the best I had before the latest one - has given a sell signal on the S&P 500 on the weekly chart. The previous signal was a buy for the week of 19 June. Previous to that was a sell in the week of 1 May. So the model is behaving pretty nicely in recent months and I wouldn't ignore it. Previous to that there was a sell for the week of 20 March... but before that a buy for three weeks in April 2005. On the other hand one of the indicators from the "stochastic model" is indicating a buy, but others aren't. So maybe we do just keep going sideways all week.
In other news my "other model" - what I call the "autoregressive model" (as opposed to the "stochastic model" - both nicely obscure names :)) - the best I had before the latest one - has given a sell signal on the S&P 500 on the weekly chart. The previous signal was a buy for the week of 19 June. Previous to that was a sell in the week of 1 May. So the model is behaving pretty nicely in recent months and I wouldn't ignore it. Previous to that there was a sell for the week of 20 March... but before that a buy for three weeks in April 2005. On the other hand one of the indicators from the "stochastic model" is indicating a buy, but others aren't. So maybe we do just keep going sideways all week.
Sunday, August 27, 2006
Bursting Real Estate Bubble and Coming Recession
Seems this weekend there is stuff everywhere on the bursting housing bubble. Too much to post! One of the best is this powerpoint slide show from the National Association of Realtors chief economist. They are still trying to put a bullish spin on things of course. But it is hard to do that anymore. Also more evidence of coming recession. This week the yield curve inverted more. And apart from the state of the housing market there is evidence such as this chart of retail employment.
Saturday, August 26, 2006
Adjusting Investments
It might seem like all I've been doing lately is trading. But I also have been adjusting my long-term investment positions. I am cutting back on a couple and increasing some others in an attempt to make the sizes of the different positions more consistent with the goal of having about 1.5% of net worth in each individual stock, not counting closed end funds which have shown their ability to withstand market corrections. I sold entirely out of IYS. This was originally a "corporate event arbitrage" trade -the fund was going to be wound up and was trading much below the final payout level. But recently we got a letter from Deutsche Bank saying that in order for the bank to pay us we had to agree to a settlement with the Australian Taxation Office. This introduced a risk of complications for foreign investors like me - I am an Australian Citizen but I am resident in the US. So I decided to get out now with a decent profit. I am planning in the coming week to reduce my positions in Telecom NZ and Challenger Infrastructure Fund. I've been waiting for Telecom's dividend book closing which happened on Friday. I just have too much of that stock. The latter looks like it is performing well but reading the annual report, there is a lot I don't understand about its accounting. So following Warren Buffett's maxim I am reducing my position. I have also put a bid in to buy more of Everest Capital after the destapling of this hedge fund management firm from its fund of funds which I am also invested in. Oh, and I also reduced my position in Ansell. There is probably something else I have left out. So actually I have been pretty busy.
PS: Wikipedia has a nice graphic of real UK house prices. The growth rate over the period is 2.4%. I suspect that rate will be lower when a few more years of data accumulate. And leverage doesn't make this look much better if you are paying 1-2% real interest on your loan.
PS: Wikipedia has a nice graphic of real UK house prices. The growth rate over the period is 2.4%. I suspect that rate will be lower when a few more years of data accumulate. And leverage doesn't make this look much better if you are paying 1-2% real interest on your loan.
Thursday, August 24, 2006
Model Update - Progress Towards Goals
At this point it is looking like there will be a buy to cover signal generated at next Tuesday's close. This is about as accurate as weather forecasting so as that date approaches the forecast might be brought forward or pushed out further in time. I continue to be shocked and stunned by the performance of the model and the ease of trading with it. I am getting used to trading the model. In July I got about 1.5 times the model return on my main trading account using roughly 3 times leverage. So far this month I am getting more than 3 times the model return. And, therefore, that performance goal has been realized. The model is on track to match last month's results. It is now up about 18% since 29 June. My taxable trading account is up 40%... The Roth IRA account is up 70% since I opened it earlier this year. I am now more than half way towards my initial goal of making $10,000 in profits in the Roth IRA. I thought that goal might take a few years to achieve. At this rate it could be achieved by the end of this year. I am pretty much also back on track towards this year's goal of increasing total net worth by $100,000. I think multiple near term goals are good - performance targets, profit targets, net worth targets etc. You can always be approaching some goal. Better than a single goal of some huge number you have to reach by "retirement".
P.S. Maybe I should just have bought real estate instead as common wisdom suggests :P The data in the article suggest that the real rate of capital gain on the typical house is 1% per annum. This article assumes 2% and still thinks housing is an inferior investment strategy.
P.S. Maybe I should just have bought real estate instead as common wisdom suggests :P The data in the article suggest that the real rate of capital gain on the typical house is 1% per annum. This article assumes 2% and still thinks housing is an inferior investment strategy.
Wednesday, August 23, 2006
Traits that Lead to Success
How many of these traits and habits do you have? I think I have several, though I'm not a very good networker. That's my weakest point.
DIY Recession Probability Calculator
Cool tool for estimating the probability of a recession. The tool is based on an academic paper by a Federal Reserve economist.
Tuesday, August 22, 2006
Expert Systems vs. Expert Opinion
John Mauldin's latest mid-week newsletter is an interesting exploration of the performance of formal quantitative systems that systematize expert knowledge vs. informal expert judgement. Generally, the formal systems perform better. People also tend to be overconfident of their abilities to make better decisions than the formal systems do. Of course this will depend on how good the quantitative model is. Anyone can make a bad model.
Friday, August 18, 2006
Freestyle Management and Black Box Trading
There are actively managed mutual funds and then there are "freestyle managers". A subclass of hedge funds use systematic trading of futures with decisions being generated by "black box systems". One of the biggest is Man Financial. I have been interested in the past in investing with them, but either I didn't have the minimum amount at the time or more recently couldn't apply to their Australian offering as I am not resident in Australia and the US sales representive never responded to my contact... My investment strategy is now a combination of a black box trading system for short-term trades and very freestyle management of longer term investments largely "outsourced" to other investment managers.
Sell Signal
I got another short term sell signal at the close today. It is possible that this is the beginning of the big decline into Fall that I have labeled C. This rally increased the NDX more than 5%.
At the end of the rally I am at a new maximum level of short-term capital gains for the year. The Roth IRA account has made almost $5000 in profits so far since I opened it in February. My general US trading account still has an all time deficit of around $11000 since I started trading in 1998. But now there is only $6000 to go to achieve my first short term goal of breakeven on my two Ameritrade accounts. The next goal is break even on the taxable account. After that I will look at gradually building up trading with the model to the full scale and opening an account to let me trade futures. The latter are more tax effective than short-term stock trading.
At the end of the rally I am at a new maximum level of short-term capital gains for the year. The Roth IRA account has made almost $5000 in profits so far since I opened it in February. My general US trading account still has an all time deficit of around $11000 since I started trading in 1998. But now there is only $6000 to go to achieve my first short term goal of breakeven on my two Ameritrade accounts. The next goal is break even on the taxable account. After that I will look at gradually building up trading with the model to the full scale and opening an account to let me trade futures. The latter are more tax effective than short-term stock trading.
Wednesday, August 16, 2006
Are We Still in the 2000- Bear Market?
I just came across Ian Gordon's website, which has some interesting charts of the Kondratief cycle. He plots the actual stock index (rather than growth rates) alongside the Kondratief cycle and other variables such as interest rates. From looking at his charts it seems to me that there could be two types of "secular bear markets". One is short and sharp like 1929-1932. The other is sideways and protracted like the late 1960s and 1970s etc. The short bears happen at the beginning of the Kondratief Winter - the final stage in the descending wave of the Kondratief cycle. 2000-2002 would then be another of these short bears. People looking for future stockmarket lows below those of 2002 and a protracted sideways bear market would be wrong if this conjecture is correct. Instead a bull market with corrections would be underway for the next 15 years or so. Of course there only appears to be a bear market still underway that started in 2000 if you look at large cap US stock indices and some European indices. Look at small cap US indices or Australian stocks for example and we appear to be in a bull market.
Monday, August 14, 2006
One More Rally?
I am looking for a rally starting either intraday or at the close on Monday on US and most world stock indices. The rally should last a bit longer than a week. I speculate that this will be the final rally before a renewed decline into the Autumn. This is the simplest and most likely scenario for the S&P500:
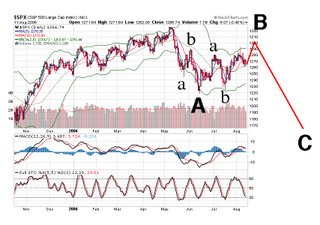
The levels of these moves are very imprecise - I think the upcoming rally should exceed the recent high at 1293. How far it will go beyond that though is guesswork. Volkmar Hable's latest newsletter concurs with this scenario more or less. He is more vague about what might happen.
PS 4:33pm 14 August
It seems now that the rally got started late on Friday just about where I closed my short position. I went long late this afternoon using call options (September $34) in both my Ameritrade accounts. Kind of dispiriting to see oneself immediately down $400 due to the option spread. Maybe not such a great idea. I did an intraday short trade using 3800 shares at the end but only made $50. That was probably my biggest single financial transaction to date. You can buy a decent house in my town for the value of the closing buy to cover trade, executed at the click of a mouse.
Saturday, August 12, 2006
The Paradox of Indexed Investing
Recently I have been reading a lot on the theory of trading and hedge funds and musing about what trends in investment strategies mean for the future of returns on different forms of investment and trading. The following thoughts are hypotheses rather than any worked out kind of theory.
In a world where everyone is an active investor (and investing on the long side only) trying to exploit valuation anomalies perhaps the market index reflects the average of their returns. Therefore, if you hire a manager, the average manager will return to you less than the index return once you pay their fees. The best managers will also migrate to the hedge fund world where they can charge larger fees leaving the average mutual fund manager making less than the index even before fees.
Hedge fund managers can also exploit opportunities on the short side and therefore even after their fees do better than long-only mutual fund managers - at least the better hedge fund managers do.
In comes passive indexed investment. What is the point of paying for an active manager if they earn less than the index say investors? So they put their money in index funds, ETFs, futures etc.
That is about where the investing world was at a few years ago.
The potential paradox is this - all the investors who are putting their money into indexed products are no longer pursuing valuation anomalies except to the extent to which they do this is when losing stocks are dropped from the index and winning stocks added. These market participants are no longer contributing to making the market efficient. This means that the remaining active investors have more opportunities to exploit as some of their competition is removed! The bigger indexing gets the more it will again underperform active management.
In recent years actively managed funds have outperformed the index in the US markets. I blogged before that this was likely because we were no longer in the strongly trending markets of the 1980s and 1990s. This is probably true but could indexation also be a factor?
We could even envisage long term cycles of active and passive management being more and less popular. Any thoughts?
Thursday, August 10, 2006
It's Nice When Losers Become Winners
Today's star is Challenger Infrastructure Fund. I bought into this fund which invests in infrastructure primarily in Britain soon after the IPO. One thing I liked about it was that the Challenger Investment Group and managers had put their own money into the fund. But it didn't do well and at one point I was down $A2000. Maybe it was because of the complicated structure that involved two payments for the shares - one at the IPO and one a year later. But today my investment finally came back into the black. The price is still below the IPO price but I bought more shares at a lower price. Funny thing is that the shares just started trading at a price that reflects the second payment and up it goes...
Trading with Stops
This morning's rally hit my model's stop loss which is set 1.25% from the previous close. I ignored it, which turned out to not be a good move. Most writers on trading state that risk control including use of stops is more important to trading success than finding good trades. For example, notorious hedge fund LTCM had no problem finding good trades, but their risk control was way out. Same with Victor Niederhoffer's fund that blew up a little before then. Less spectacularly you can make profits and then give them away again. Which is what I was doing till recently.
But setting stops is very tricky. If they are too close to the current price they will get hit all the time unnecessarily. Too far away and you lose too much money before the stop is triggered. For the moment I am sticking with 1.25% but adding two rules:
1. If the price comes back to the stop I should re-enter the trade. The 1.25% stop means that only powerful moves will trigger the stop. If those reverse sufficiently to return to the stop then the reversal is probably serious. This rule would have added a little less than 4% to returns in 2003 the one year I have tested fully.
2. If the next day's forecast suggests a trade in the opposite direction to the current trade then you should reverse to the opposite position at the stop. This adds more than 30% of compounded returns in 2003. I know it is hard to believe that - but it is true - it lets you get in on the beginnings of powerful new moves.
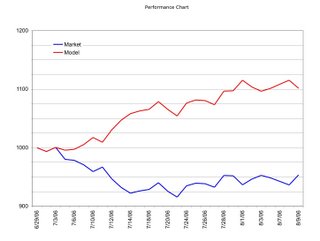
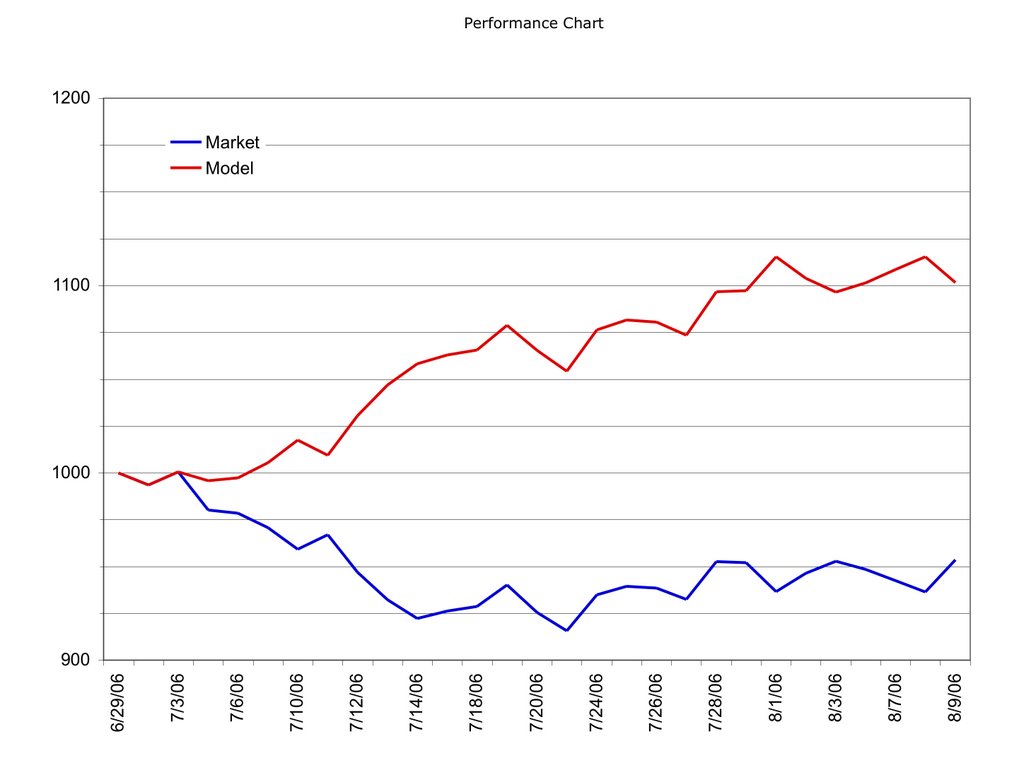
This chart shows the model's performance to date relative to the NASDAQ 100 index, assuming $1000 was invested in both at the close of trade on 29 June, and assuming no commissions, no spreads, and no leverage. Given the high rate of return a little leverage could offset the trading costs anyway:
But setting stops is very tricky. If they are too close to the current price they will get hit all the time unnecessarily. Too far away and you lose too much money before the stop is triggered. For the moment I am sticking with 1.25% but adding two rules:
1. If the price comes back to the stop I should re-enter the trade. The 1.25% stop means that only powerful moves will trigger the stop. If those reverse sufficiently to return to the stop then the reversal is probably serious. This rule would have added a little less than 4% to returns in 2003 the one year I have tested fully.
2. If the next day's forecast suggests a trade in the opposite direction to the current trade then you should reverse to the opposite position at the stop. This adds more than 30% of compounded returns in 2003. I know it is hard to believe that - but it is true - it lets you get in on the beginnings of powerful new moves.
This chart shows the model's performance to date relative to the NASDAQ 100 index, assuming $1000 was invested in both at the close of trade on 29 June, and assuming no commissions, no spreads, and no leverage. Given the high rate of return a little leverage could offset the trading costs anyway:
Wednesday, August 09, 2006
Another Fed Day...
This one a lot better than the last for me.... The day after the last one is when I started running "the model". I am currently short and added a little bit to the short after the direction of the market got clearer after the FOMC announcement. It was pretty much exactly as expected. The probability of a rate hike was less than 20% and we had one Fed member dissenting and voting for a hike. The others voted to keep rates on hold. And the statement says that future rate hikes will be data driven. Goldman Sachs had been looking for a rise in rates. Given I was short I wasn't worried about that.... So why is the market down - well the technicals are pointing down, which is why I am short. The only other thing might be that dissenting voice. It is hard to think major market participants would be naive enough to think the Fed would confirm that that was the last rate hike.
I am still short and currently expect to be so at least through Friday unless the stochastic goes below 20 in which case the short would continue into next week. Cisco announces after the close today. It is a major NDX stock so could have some effect on the NDX going forward from here.
I am still short and currently expect to be so at least through Friday unless the stochastic goes below 20 in which case the short would continue into next week. Cisco announces after the close today. It is a major NDX stock so could have some effect on the NDX going forward from here.
Sunday, August 06, 2006
Secret to Planning a Successful "Retirement"
Well I don't believe in retirement as usually construed, but thought this was a good article as he seems to be saying the same thing. Of course there isn't a point in pursuing something as a career that you like but you aren't really talented at. That better stay as a hobby or sideline. And maybe you need to do some job to make money while you develop your alternative career. But the ideal is to do what you like and are good at and look for ways to make money from it.
This has been my path up till now and will continue to be so. Successful academics get into it either because they love teaching or research (latter in my case), or both. The path to a tenured professorship in today's world is one of high risk and uncertainty particularly in the United States and particularly on the research track (and the latter particularly in fields that don't have high research funding). Getting to be a tenured professor shouldn't stop one from switching career and doing something else if one wants to and has the opportunity. Quite a lot of academics in fields that are more prone to application find money making ideas which they then develop in a second career. In economics for example there are also opportunities to move into government etc. Often I read about successful figures in various fields that they started their career getting a PhD or being a professor. But a lot of my fellow academics seem to lose their appetite for risk and in fact become very risk averse (a lot I think are actually risk averse and are traumatised by the path needed to get to tenure). But if you are not going to be a world class star in your field and have a good idea of something else to do, why not do it?
This is the "industry" I am in but similar things will apply in other professions too.
Saturday, August 05, 2006
End of Week Report
Today the market rallied initially on an unemployment report and then ended the day lower. The model got stopped out because the NDX rose more than 1.25% intraday. However, I ignored the model as other indicators suggested that was the right course. So far this month my account is up 1.13% though the model is down 1.54% and the market down 0.37%.
Though everyone thinks the Fed will not raise interest rates on Tuesday, I have a suspicion that this time there could just maybe be a surprise (PS: According to Barron's published on Saturday Goldman Sachs have the same suspicion). The Fed almost always raises interest rates too much and induces a recession. Long-bond yields fell today. I have been reading Brian Berry's book on long-wave cycles. The first thing I have read on this that actually makes sense - actually it was Michael Alexander's columns that got me interested. I think we are still essentially in a declining interest rate cycle that started in 1981. After the next recession interest rates will start rising for real along with inflation according to the Kondratieff Cycle Theory. One thing that could help the next cycle be more inflationary is if the Fed triggers a deep recession here and future Fed chairmen dare not be so aggressive. This is just a wild speculation of course. With big bets on bonds, I of course want to see interest rates fall (which pushes up the value of bonds).
At the moment I am still in the real time testing phase of the model. I am only using about a third of the capital that I think would make sense to allocate to the model trading eventually. The eventual plan, if things check out consistently, would be to put about half of my non-retirement capital into it and trade that with about 3 times leverage. The rest of my non-retirement capital would be in unleveraged long-term investments so that the overall leverage is only 2 times, which I believe is a safe level. That is a limiting level. If I felt scared to trade that much I would trade a lesser amount. The ratio of trading to investment capital will also differ in bull and bear markets. The model performs best in bear markets. In bull markets good quality stocks could match it. Problem is finding those stocks!
Amusing Article about a Hedge Fund Conference
An amusing article about a hedge fund conference. One guy wants to start a hedge fund and has never traded anything! Even if my trading model works out really well, I wouldn't want to start a hedge fund. Not anytime soon anyway.
Thursday, August 03, 2006
July Report
Net worth increased by $13059 to $316,244. This is still about two thousand below the May high but a nice recovery. My retirement accounts hit a new high. The portfolio rate of return was 3.41% vs. the 0.71% gain for the MSCI. The biggest positive contributers were the rise in the Australian Dollar of about 2 US cents over the month and $4350 in profits from trading QQQQ. The most important negative "contributers" were Ansell and my Australian mutual funds. This month is a good example of my hedging strategy working with gains from currency and trading offsetting investment declines. Performance would be much worse if I wrote off Croesus this month. I plan to adjust the past figures when Croesus is finally presumably delisted assuming its value fell smoothly from the time of the initial trading halt to delisting. On the spending and saving side, my spending seems to be about $1700, which implies around $2700 in saving from salary and retirement contributions. I am surprised spending was so low actually. Maybe I amde a calculation mistake.
Tuesday, August 01, 2006
Further Downside Risk?
The stock futures are off this morning and in recent days the Bank of Japan continues to try to reduce its money supply - a move that has preceded market slumps in recent months. A news releases on personal consumption spending is due at 8:30 EST which should give the market some further information on economic growth and inflation. If the downtrend is confirmed I will likely buy more put options in my Roth IRA account that is currently 90% in a money market account.
Update: 4:58pm
I added 5 QQQQ $39 August Put contracts... I reached a milestone today. Finally, my QQQQ trading over the last several years became profitable. As Investment of course it was lousy. But It helped teach me to trade. Next goal is to regain all trading losses on my US trading account. That's going to probably take a few more months of successful trading to achieve. Currently the model is predicting that the trend will reverse to an uptrend the day after the FOMC announcement next week.
Upside Risk Reduced
Today the market fell a little, but pretty much went sideways all day. The pop up in the NASDAQ 100 index in the morning extended its trading range and meant that though the stochastic oscillator increased, it didn't increase by much. The risk that the oscillator and the market will actually go up in the near-term is much reduced. Yes, that is the risk that it will rise. If you are short the market like me, you want the market to go down... I get more and more annoyed by the bullish bias in the media that talks about good days when the market goes up and bad ones when it goes down. I think it is discrimination against bears :)
Subscribe to:
Posts (Atom)