We exceeded our optimistic forecast of reaching a net worth of AUD 1.7 million by the end of 2016. The optimistic forecast for 2017 is currently AUD 2 million. Coming soon: December accounts, 2016 accounts, and more detailed projections.
Friday, December 30, 2016
Saturday, December 03, 2016
November 2016 Report
Here are our monthly accounts (in AUD):
 Spending (not counting mortgage) was fairly typical at $6.3k. The biggest single expenditure was a $956 quarterly electricity bill. This covered part of the winter and with the baby we have been using much more heating - both reverse cycle air conditioning and conventional resistance heating. Our hot water and cooking are gas powered and so this bill was really large.
Salaries, tax refunds etc. added up to $19.7k (after tax). We both got three pay checks this month and Snork Maiden's pay went back up to the regular full time rate for some reason, even though she is not back at work yet. I also got a tax refund of $990.
After taking into account the mortgage payment of $3.7k (which includes implicit interest saving due to our offset account - the actual mortgage payment was about $500 less than this) - which shows up as a transfer to the housing account, we saved $9.7k on the current account. We made $3.6k of retirement contributions, and saved a net $1.7k in added housing equity. Net saving was, therefore, $15k across the board, which is very high by recent standards.
The Australian Dollar fell from USD 0.7613 to USD 0.7386. The ASX 200 gained 2.99%, the MSCI World Index gained 0.81%, and the S&P 500 3.70%. We gained 2.24% in Australian Dollar terms and lost 0.80% in US Dollar terms. So, we underperformed both the Australian market and the international markets. The best performer in dollar terms was the CFS Geared Share Fund, which gained $18.4k followed by Platinum Capital and related funds, which gained $3.3k. The worst performing investment was Oceania Capital Partners, down $3.8k after the big gains last month. U.S. stocks were the best performing asset class in percentage terms with a 2.88% gain, while the worst performing was private equity, losing 3.56%. Australian small cap stocks also performed poorly losing 2.50%. That's not a good sign of the sustainability of stock market performance going forward.
As a result of all this, net worth rose AUD 42k to $1.646 million (a new high) or fell USD 5.4k to $US 1.216 million.
Saturday, November 05, 2016
October 2016 Report
A down month in the financial markets and a very high spending month for us. Here are our monthly accounts (in AUD):


The Australian Dollar fell slightly from USD 0.7665 to USD 0.7613. The ASX 200 fell 2.15%, the MSCI World Index fell 1.67%, and the S&P 500 fell 1.82%. We lost 1.22% in Australian Dollar terms and 0.27% in US Dollar terms. So, unusually, we outperformed both the Australian market and the international markets. The reason for this was largely the big gains we had in Oceania Capital Partners, which gained $8.7k. The worst performer in dollar terms was the CFS Geared Share Fund, which lost $15.5k. The best performing asset class in percentage terms was, of course, private equity, which gained 10.96% and the worst commodities, which lost 2.83%.
As a result of all this, net worth fell AUD 12k to $1.604 million or fell USD 17k to $US 1.221 million.
Saturday, October 08, 2016
Moominmama's Taxes 2015-16 Edition
I've filed Moominmama's (formerly Snork Maiden) tax return for this tax year. The tax year runs from 1st July to 30th June in Australia. The figures ignore employer and employee contributions to
superannuation (retirement account) which amount to a lot of extra
income. Everything is in Australian Dollars of course.

Her salary is down because she went on maternity leave and the average tax rate also falls as a result. Investment income is up though.
Here are the reports on Snork Maiden's taxes for all previous years:
2014-15
2013-14
2012-13
2012-13
2011-12
2010-11
2009-10
2008-9
2007-8

Her salary is down because she went on maternity leave and the average tax rate also falls as a result. Investment income is up though.
Here are the reports on Snork Maiden's taxes for all previous years:
2014-15
2013-14
2012-13
2012-13
2011-12
2010-11
2009-10
2008-9
2007-8
Moominpapa's Taxes 2015-16 Edition
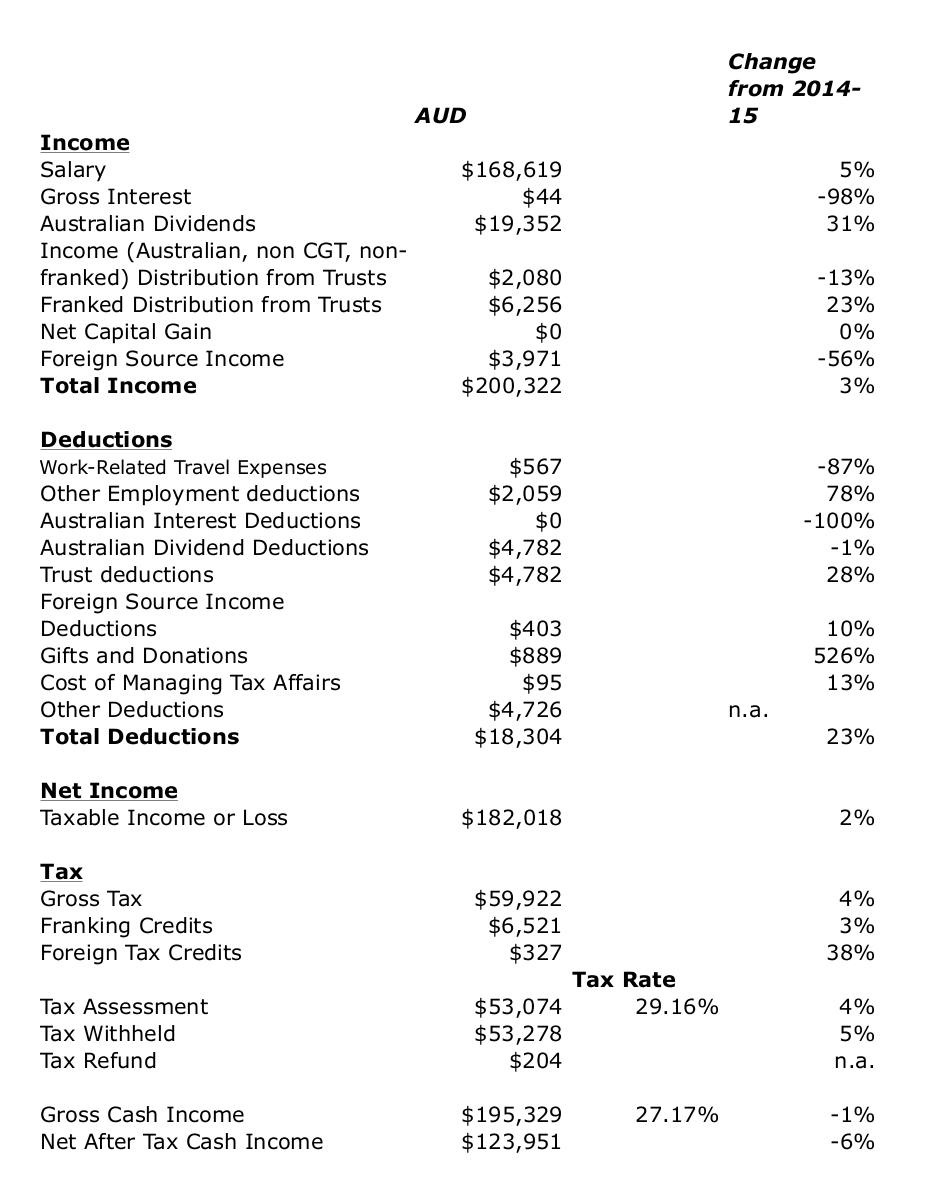
I have now completed my tax return. Looks like I should get a $204 refund. My taxable income is up by 2%. But my tax is up 4% despite a 23% increase in deductions and increases in tax credits. I'm a bit puzzled by that but I did move into the top tax bracket. Gross cash income is before tax income ignoring franking and other tax credits and adding in net undiscounted capital gains (not deleting losses from previous years).
This was the first year I checked what information the government knows about my tax affairs as revealed by the prefilled information on my tax return. They are missing a lot of information on my Australian accounts and none on my foreign holdings. Strangely they have dividends for some shares I have with a broker and don't have information on dividends from other companies that I hold through the same broker. Also they have one managed fund account but not the other I hold with the same firm. If I filed a return based on the numbers they know but taking the deductions I could document my return would look so radically different to last year that I think it would raise a lot red flags. But I didn't want to give the government any more information than they have, so I again filed a paper return. I filed Moominmama's return online for the first time, using the prefilled numbers plus deductions.
Previous years' reports:
2014-15
2013-14
2012-13
2011-12
2010-11
2009-10
2008-9
2007-8
P.S. 9 November
I got a more than $900 refund. Don't know what I got wrong in my calculations, but I'm not complaining :)
Wednesday, October 05, 2016
September 2016 Report
This was an uneventful month in the financial markets. Most notable thing was in our local housing market. A strong auction of a house in our development caused me to increase the carrying valuation of our house. Here are our monthly accounts (in AUD):

The Australian Dollar rose from USD 0.7520 to USD 0.7665. The ASX 200 fell 0.48%, the MSCI World Index rose 0.66%, and the S&P 500 rose 0.02%. We lost 0.15% in Australian Dollar terms and gained 1.78% in US Dollar terms. So we underperformed the Australian market and outperformed the international markets.
The best performing investments (in total dollars not RoR) were Oceania Capital Partners and Platinum Capital, which both gained $2.1k. The worst performer was the Unisuper superannuation fund, losing $1.6k. The best performing asset class was private equity, which gained 2.79% and the worst commodities, which lost 0.82%.
As a result of all this, net worth rose AUD 23k to $1.617 million or rose USD 41k to $US 1.240 million.
Subscribe to:
Posts (Atom)