This one a lot better than the last for me.... The day after the last one is when I started running "the model". I am currently short and added a little bit to the short after the direction of the market got clearer after the FOMC announcement. It was pretty much exactly as expected. The probability of a rate hike was less than 20% and we had one Fed member dissenting and voting for a hike. The others voted to keep rates on hold. And the statement says that future rate hikes will be data driven. Goldman Sachs had been looking for a rise in rates. Given I was short I wasn't worried about that.... So why is the market down - well the technicals are pointing down, which is why I am short. The only other thing might be that dissenting voice. It is hard to think major market participants would be naive enough to think the Fed would confirm that that was the last rate hike.
I am still short and currently expect to be so at least through Friday unless the stochastic goes below 20 in which case the short would continue into next week. Cisco announces after the close today. It is a major NDX stock so could have some effect on the NDX going forward from here.
Wednesday, August 09, 2006
Sunday, August 06, 2006
Secret to Planning a Successful "Retirement"
Well I don't believe in retirement as usually construed, but thought this was a good article as he seems to be saying the same thing. Of course there isn't a point in pursuing something as a career that you like but you aren't really talented at. That better stay as a hobby or sideline. And maybe you need to do some job to make money while you develop your alternative career. But the ideal is to do what you like and are good at and look for ways to make money from it.
This has been my path up till now and will continue to be so. Successful academics get into it either because they love teaching or research (latter in my case), or both. The path to a tenured professorship in today's world is one of high risk and uncertainty particularly in the United States and particularly on the research track (and the latter particularly in fields that don't have high research funding). Getting to be a tenured professor shouldn't stop one from switching career and doing something else if one wants to and has the opportunity. Quite a lot of academics in fields that are more prone to application find money making ideas which they then develop in a second career. In economics for example there are also opportunities to move into government etc. Often I read about successful figures in various fields that they started their career getting a PhD or being a professor. But a lot of my fellow academics seem to lose their appetite for risk and in fact become very risk averse (a lot I think are actually risk averse and are traumatised by the path needed to get to tenure). But if you are not going to be a world class star in your field and have a good idea of something else to do, why not do it?
This is the "industry" I am in but similar things will apply in other professions too.
Saturday, August 05, 2006
End of Week Report
Today the market rallied initially on an unemployment report and then ended the day lower. The model got stopped out because the NDX rose more than 1.25% intraday. However, I ignored the model as other indicators suggested that was the right course. So far this month my account is up 1.13% though the model is down 1.54% and the market down 0.37%.
Though everyone thinks the Fed will not raise interest rates on Tuesday, I have a suspicion that this time there could just maybe be a surprise (PS: According to Barron's published on Saturday Goldman Sachs have the same suspicion). The Fed almost always raises interest rates too much and induces a recession. Long-bond yields fell today. I have been reading Brian Berry's book on long-wave cycles. The first thing I have read on this that actually makes sense - actually it was Michael Alexander's columns that got me interested. I think we are still essentially in a declining interest rate cycle that started in 1981. After the next recession interest rates will start rising for real along with inflation according to the Kondratieff Cycle Theory. One thing that could help the next cycle be more inflationary is if the Fed triggers a deep recession here and future Fed chairmen dare not be so aggressive. This is just a wild speculation of course. With big bets on bonds, I of course want to see interest rates fall (which pushes up the value of bonds).
At the moment I am still in the real time testing phase of the model. I am only using about a third of the capital that I think would make sense to allocate to the model trading eventually. The eventual plan, if things check out consistently, would be to put about half of my non-retirement capital into it and trade that with about 3 times leverage. The rest of my non-retirement capital would be in unleveraged long-term investments so that the overall leverage is only 2 times, which I believe is a safe level. That is a limiting level. If I felt scared to trade that much I would trade a lesser amount. The ratio of trading to investment capital will also differ in bull and bear markets. The model performs best in bear markets. In bull markets good quality stocks could match it. Problem is finding those stocks!
Amusing Article about a Hedge Fund Conference
An amusing article about a hedge fund conference. One guy wants to start a hedge fund and has never traded anything! Even if my trading model works out really well, I wouldn't want to start a hedge fund. Not anytime soon anyway.
Thursday, August 03, 2006
July Report
Net worth increased by $13059 to $316,244. This is still about two thousand below the May high but a nice recovery. My retirement accounts hit a new high. The portfolio rate of return was 3.41% vs. the 0.71% gain for the MSCI. The biggest positive contributers were the rise in the Australian Dollar of about 2 US cents over the month and $4350 in profits from trading QQQQ. The most important negative "contributers" were Ansell and my Australian mutual funds. This month is a good example of my hedging strategy working with gains from currency and trading offsetting investment declines. Performance would be much worse if I wrote off Croesus this month. I plan to adjust the past figures when Croesus is finally presumably delisted assuming its value fell smoothly from the time of the initial trading halt to delisting. On the spending and saving side, my spending seems to be about $1700, which implies around $2700 in saving from salary and retirement contributions. I am surprised spending was so low actually. Maybe I amde a calculation mistake.
Tuesday, August 01, 2006
Further Downside Risk?
The stock futures are off this morning and in recent days the Bank of Japan continues to try to reduce its money supply - a move that has preceded market slumps in recent months. A news releases on personal consumption spending is due at 8:30 EST which should give the market some further information on economic growth and inflation. If the downtrend is confirmed I will likely buy more put options in my Roth IRA account that is currently 90% in a money market account.
Update: 4:58pm
I added 5 QQQQ $39 August Put contracts... I reached a milestone today. Finally, my QQQQ trading over the last several years became profitable. As Investment of course it was lousy. But It helped teach me to trade. Next goal is to regain all trading losses on my US trading account. That's going to probably take a few more months of successful trading to achieve. Currently the model is predicting that the trend will reverse to an uptrend the day after the FOMC announcement next week.
Upside Risk Reduced
Today the market fell a little, but pretty much went sideways all day. The pop up in the NASDAQ 100 index in the morning extended its trading range and meant that though the stochastic oscillator increased, it didn't increase by much. The risk that the oscillator and the market will actually go up in the near-term is much reduced. Yes, that is the risk that it will rise. If you are short the market like me, you want the market to go down... I get more and more annoyed by the bullish bias in the media that talks about good days when the market goes up and bad ones when it goes down. I think it is discrimination against bears :)
Monday, July 31, 2006
What Type of Trader are You?
Everyone trades to some degree, even when they buy or sell a passively indexed investment. Some traders lose from trading and some gain. Find out which sort of trader you are.
Saturday, July 29, 2006
Going Short
The model is saying to be short on Monday. I have shorted QQQQ before the end of the day ($37.01). Could be early (the price already went to $37.10 and then fell back again), but eventually will be right I think. Based on the chart, this upcoming downmove could be signficant. The model though gives no information on future levels of the index, just the direction.
4:05pm Update:
I was a bit early going short but still up substantially for the day. Updated performance stats since 6/29/06:
Market Gain: -4.75%
Model Gain: 8.80%
Excess Return over Market: 14.22%
Account Gain: 14.90% (about $4000 on this account - not keeping track of gains in the Roth account but it is now up almost 40% on the contribution made earlier this year).
Excess Return over Market: 20.63%
Which is 145% of the model's gain. Using leverage and some intraday trades should result in a gain greater than the model and we are now seeing that. This kind of trading gain for a month is not unusual. What is hard is to not give the money back again. That is the next challenge.
If the index continues to rise on Monday and the full(5,5,3) stochastic goes over 80 (it is now at 75) I will close the short and go long as we will have entered the persistent overbought state. There is a risk of this based on my most forward looking indicator. I am short 2500 QQQQ shares in the trading account and long 5 $39 August puts in the Roth account. A one cent change in QQQQ therefore has a $30 impact on my net worth...
Friday, July 28, 2006
Bill Gross' Latest Commentary
More evidence that in Gross' opinion the recent bear market in bonds is over.
Limited Transactions on Online Savings Accounts
One downside of these high interest online savings accounts that I didn't know about till today. Received a letter from HSBC telling me that I had been doing too many transactions on my account and was violating Federal regulations. If you do this for three consecutive months they will close your account or change it to another account type. The limit is six transactions per month including transfers to your own accounts online. I had been trying to do as many transactions as possible using my savings account in order to maximize my interest income. I would move most of my pay into the account each time I received a pay check. So from now on I will only move money there that I think is really going into savings but I am not yet ready for whatever reason to move to its final "home".
Wednesday, July 26, 2006
Bernanke Financial Disclosure
Like PF blogs financial disclosures by public officials are always fascinating.
Tuesday, July 25, 2006
Balance Transfer
Just completed a balance transfer, paying off about $8500 on my Amazon credit card using a balance transfer from my HSBC credit card. The balance on the HSBC card is now $7000. My total credit card credit line is $19500. I like to keep plenty of the credit line free for emergency spending, even though from what I understand it doesn't have a long-term impact on your credit score. The new HSBC loan is at 2.99% and the old Amazon one was at 0%. I get lots of zero percent offers in the mail almost every day. I am not taking them since I learned that these do have a long term impact on your credit score. Why carry any balance? The loan helps fund my trading account. If the balance is below $25000 you can't make day trades and this money is free or very cheap. Hopefully, if and when I finally grow my trading account more I will probably pay off the credit card loan just because it is a hassle to think about and only amounts to about 2% of net worth at the moment and I like to keep life simple.
Elite Trader
I have been a member of Silicon Investor for 8 years but only just discovered a site called Elite Trader today. Read an interesting discussion of Jim Simons' hedge fund. Don't know how useful it is in general but thought I'd just pass it along for those interested in learning more about trading.
Today, finally things seem to be going to plan trading wise. Much more relaxing. At this point it is looking like the rally continues all week long though there could be a significant correction in it around Wednesday.
4pm update - since 30 June:
Model: +6.8%
NDX: -6.5%
Excess Return: 14.2%
Trading Account: +2.9%
Excess Return: 10.0%
Capture of Model Performance: 70%
Am happy to be back on the positive side :) This is the revised version of the model. My account perfomance is as it happened. Excess return measures the difference between an account invested in NDX and an account invested in the model from inception. Excess return increases only when the model is correctly short.
Sunday, July 23, 2006
Heads and Shoulders
No not a special deal on shampoo :) Everywhere you look across the stockmarkets there are head and shoulders formations or closely related chart patterns. One of the most prominent is on the Dow. The implication is a fall to around the low of August 2004. In Elliott Wave terms the move down from the top is an ABC (or WXY) pattern with the wave C ( or Y) down just getting started. I and Volkmar Hable both think there will, however, be a rally in the coming week, which on the NASDAQ and SPX indices will complete wave 2 of this C wave, an upmove which started some time on Tuesday.
Will the head and shoulders correction be the end of this current short-term bear market? It is impossible to say but I think there is a strong probability that it will be. Most bears are looking for a low in October or even 2007. What most people are looking for often doesn't happen. I'm now thinking that this year will turn out to be more like the mid-cycle slow downs in 1985 and 1995 rather than a full blown recession and the market might act more like 1987 (but without the dramatic crash) or 1998 - i.e. a short, sharp correction over a few months. This is partly based on trying to fit Elliott Wave patterns to various foreign stock indices. It's hard to believe that their rallies since 2002-3 are corrective in nature rather than bull market impulse waves. If the latter is true then the current correction is just wave 4 of an ongoing bull-market and the market should not go below the 2004 (e.g. FTSE, DAX) or 2005 (in Australia) highs in these indices.
Learning from your mistakes is one of the most important habits of successful investors. So I have been busy analysing where I sent wrong in the last few days. I've come up with at least one or two useful additional trading rules. Also it is clear that some times my technical analysis tools and model give trades with higher probabilities than others and the size of the trading position needs to be modified accordingly.
Saturday, July 22, 2006
Losing Streak
The model has now lost money for 5 days in a row :( This is the longest losing streak so far in the simulation I did for this year. On average the model only loses money for 5 or more days in a row one time each year. The longest losing streak in the last 10 years is 6 days.
Friday, July 21, 2006
Trading Performance Update
Since I have been using the model the NASDAQ 100 Index is down 7%, the model is up 3%, and my account is at... zero. Actually, this is not so bad - I beat the market by 7% and captured 70% of the model's excess return over the market. Over time, I hope my trades will capture more of the model's returns as I get used to using it. Of course, if you were in cash you also would make close to zero percent over this period. But if the market had instead gone up you wouldn't have beaten the market. Today the market corrected much of the recent rally. I am predicting a 4 day rally through Wednesday which might take the QQQQ's to $37.50 (optimistically). This evening the market is reacting well to the Microsoft earnings report and negatively to Google who beat their numbers but.... There were wild fluctuations in GOOG following the announcement. I think this is because Google has such a lot of numbers computed in non-GAAP ways as well as according to GAAP in its earnings report and traders get very confused.
Thursday, July 20, 2006
Croesus Again
A glimmer of hope of getting something back from the Croesus debacle. Trading was rough today as I was still short when the market rose in response to Bernanke's comments. The model now switches to a long recommendation as the stochastic rose above 20. In yesterday's post I labeled the beginning of this upward correction in the market wave iv. That will have to be relabeled wave 2. Wave 1 down is therefore complete. The outlook for the next month or so is still bearish, however.
Wednesday, July 19, 2006
Bearish Outlook
I went long and lost money and then went short and lost money... Of course if I followed my model and rules precisely I would have stayed short and ended up a little down on the day but not as bad as I was. I kept the short position.
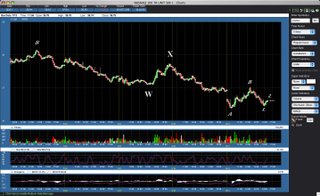
Here is my latest Elliott Wave interpretation of what is happening:
The chart implies that there will be another day or two before a modest upward correction. There will be two more stochastic cycles before we hit bottom though as there should be five waves in total in a wave C which we are now in. So this is very bearish. Will that be the end of the bear market? I don't know. Will update you when I have a more solid idea.
Yahoo reported this evening and its stock is getting totally trashed. This supports my interpretation and forecast.
Here is my latest Elliott Wave interpretation of what is happening:

The chart implies that there will be another day or two before a modest upward correction. There will be two more stochastic cycles before we hit bottom though as there should be five waves in total in a wave C which we are now in. So this is very bearish. Will that be the end of the bear market? I don't know. Will update you when I have a more solid idea.
Yahoo reported this evening and its stock is getting totally trashed. This supports my interpretation and forecast.
Tuesday, July 18, 2006
All Bets Off
On Tuesday, Japan reversed the change in money supply to reduce money supply relative to last Thursday and plans a further reduction on Wednesday. Market isn't responding much to this morning's PPI figure. The CPI will be announced tomorrow. Lots of corporate earnings reports this week too. The stochastic oscillator is still below 20 - it increased a little yesterday - at this level the presumption is to still be short. But yesterday the oscillator increased a little and to remain constant today prices pretty much need to rise.... movement of the oscillator tends to be pretty smooth and so this suggest higher prices today. A very big rally is needed to get above 20 still - about 3.5%. So I am again going tentatively long this morning but not holding overnight positions until the trend is clear.
Monday, July 17, 2006
Bank of Japan Massively Increases Money Supply
The financial mass media does not discuss this major driver of the stock market very much if at all. More specialized sources are only recently beginning to understand the importance of changes in Japanese Money Supply on global asset prices. Fluctuations in the Japanese monetary base dwarf those in the money supply of any other country including the United States. It seems that Japanese monetary policy is far more important than the actions of the U.S. Federal Reserve. Before and during the May decline in global financial markets the Bank of Japan sharply reduced the money supply. Only when they began to increase it again did the collapse in the markets mitigate. Then starting on July 4th the BoJ again withdrew liquidity. On July 14 they increased the current account balance by an unprecedented 40% in one day! If history is a precedent this should trigger a strong rally in the market in coming weeks. The BoJ does, however, plan to reduce the increase, which was unplanned. How do you accidentally create $40billion in high powered money?
This morning the US Dollar is up strongly - this might indicate dollars being bought with those Yen? The Japanese market was closed Monday for a national holiday. I went long QQQQ at 35.88 around 8:15am this morning.
This morning the US Dollar is up strongly - this might indicate dollars being bought with those Yen? The Japanese market was closed Monday for a national holiday. I went long QQQQ at 35.88 around 8:15am this morning.
Saturday, July 15, 2006
A More Positive Post!
At mid-month things are looking a lot better than at the end of last month. Since the disastrous 29 June FOMC Day I have recouped my trading losses of that day and more by trading QQQQ. The market has fallen 8%, my model has added 5%, but my trading account has added 18%. This is due to trading on margin and buying and selling intraday - the model is based on closing (day-end) prices only. Don't believe the real estate gurus who tell you that only real estate allows leverage. Using leverage in the stock market is no more dangerous than in the real estate market if you know what you are doing... And if you don't know what you are doing it is just as dangerous in both (though I know how I could lose all your money for you in a day in the stock market, which isn't possible in the real estate market - it takes longer to lose all your money there - put all your money in an out of the money option the day before option expiry if you really want to lose it :)).
My Roth IRA account has reached a new high $10,860 from a total investment of $8000 a few months ago. So I am 28% of the way to the goal of making $10,000 in profits on my Roth IRA. Net worth is now only $3000 from my highest month-ending figure (though I reached maybe $328,000 at one point intra-month). I am $55,000 from reaching my end of year goal and so am behind where I should be at this point - $324,000. I am fairly confident now of achieving the goal though.
Recently my blog has discussed trading moves more and more and I hope that isn't too boring for those of you not interested in trading. By the way, it is dangerous to follow my moves blindly as maybe I won't have time to post when I change direction. Please just use these posts as additional opinions about market conditions. It is dangerous to try to follow anyone else's trading moves blindly!
Finally, nice to see a positive article about one of my more disappointing investments: Challenger Infrastructure Fund.
Ameritrade Sucks But I Love the Streamer
Today I placed an order to cover my QQQQ short at $35.80. This was 1 cent above the low price of the day. Just as I did so, Ameritrade's servers crashed - the order was not accepted and when I tried to log-in again, I couldn't even get the login page. From reports on the Yahoo website, all of Ameritrade's customers were affected. Eventually I did cover - I missed a couple of good opportunities after I got back on and finally closed out at $35.95. The difference is $375. I have seriously considered moving my account to Interactive Brokers in the past. But I really liked the Ameritrade interface and so decided not to. Also for orders of more than 1000 shares Ameritrade is cheaper. The big advantage of IB is that you can trade futures as well. I think I may now make the move and keep the Ameritrade account for the sake of the charts as well as keeping the Roth IRA there. I haven't gone long yet, but based on the model will likely do so on Monday.
Friday, July 14, 2006
Change of Plan
Went long at the open at 36.61 on the QQQQ. Stopped out at 36.45. Went to a long meeting (PhD dissertation defence - environmental research in China was the topic) and then came back and went short again at 36.71 with 3000 shares this time instead of the 2000 + 3 option contracts in the Roth the first time. The stochastic is below 20 which is the persistent oversold state and though other diagnostics from the model didn't suggest that we were persistently oversold, and looking at the S&P 500 index would hardly make you think so... I should probably have just stayed short. Anyway, I am up for the day at this point and that is what matters I guess. The market looks like going lower than today's low so far. The whole correction from 3 July looks now like a double zigzag in E-Wave terminology. This morning was the end of wave A of the second zigzag and now we are in the wave C of the second zigzag.

Thursday, July 13, 2006
Cover Shorts and Go Long
The model says to be long from tomorrow. So I sold my QQQQ put options and bought back the QQQQ stock I had sold short. The underlying QQQQ position was a bit more than 50% of my net worth. Today's gain alone was $2700. I plan to establish long positions in the morning. The market closed very close to its lows and the stochastic is in the persistently oversold range. So best to still be cautious about going long. I didn't have time to buy options in my Roth account either before the close. Intraday the price action played out in almost perfect Elliott Wave Theory fashion. SPX/SPY has a clear 9 waves down - an extended impulse. In the QQQQ/NDX that itself is the 5th wave from the July 3rd high.
Over the last month or so I have developed my new approach to trading through a couple of different versions. Trading using my new systematic model based approach is so different to using traditional "analog" approaches. I am fairly confident that I have discovered something very significant. Am trying "not to count my chickens before they hatch" but it is hard not to speculate about the future. I don't feel at all euphoric. That is probably a good thing.
Over the last month or so I have developed my new approach to trading through a couple of different versions. Trading using my new systematic model based approach is so different to using traditional "analog" approaches. I am fairly confident that I have discovered something very significant. Am trying "not to count my chickens before they hatch" but it is hard not to speculate about the future. I don't feel at all euphoric. That is probably a good thing.
Tuesday, July 11, 2006
Mutual Funds Improve
Interesting article about improving performance of mutual funds. I've posted a couple of times about how actively managed funds seem to do better than passively managed funds in weaker stock market conditions and vice versa. Last night I was checking out the performance of TIAA-CREF's variable annuities (these are basically mutual funds - not the standard variable annuities). Over a 10 year horizon their indexed stock fund has essentially performed the same as their actively managed Stock Fund. But in the last year the actively managed fund has strongly outperformed the indexed fund. Their Growth Fund however has totally underperformed over every time horizon. But interestingly their best fund of all is the TIAA Real Estate Fund which invests directly in real estate. It has outperformed the equity funds on every time horizon. Currently my TIAA-CREF account is invested in the Real Estate Fund and the Bond Fund.
Monday, July 10, 2006
Forecast Update
Currently my model is projecting Thursday as the turn around day in the market when a new uptrend will start. Of course this can change as we approach that date and new info updates the model. Am visiting in Burlington, Vermont for the last few days. beautiful weather. Went hiking to the top of the highest mountain in Vermont. We cheated and got a cable car to the top of the ski slopes. Then we hiked to the summit from there. After that though we hiked all the way back down to the valley bottom. Still sore :( Very steep and rocky descent involving lots of jumping down rocks and just the continual shock of taking my weight onto my legs in the descent. The ascent route involved a little rock climbing, some people were giving up and turning back but once you figured the route it wasn't too hard. It was rated DDD for very difficult on the map they gave out and there were lots of warning signs at the beginning of the trail to only try it if you were well prepared (we had no special gear was just wearing sneakers). From the top we could see right across the state from the Adirondacks in NY , Lake Champlain, and up and down the green mountains. May post pictures some time when we have them available.
Thursday, July 06, 2006
Trading Update
My trading model automatically stopped me out this morning when QQQQ reached 1.25% down. It then fell further and I went long for a daytrade. But I expect to go short before the close. The model is a bit ambiguous today on the forecast for tomorrow, but looking at a bunch of other stuff I have to side with the more negative view. Today's downmove was ostensibly started by the North Korean missile launch putting pressure on the Japanese market. Then some strong economic reports came out this morning in the US, raising interest rate fears again. The model didn't fail today despite prices falling - we can't predict prices and don't try to. The stochastic oscillator I am forecasting will end the day up, validating the forecast. The stop loss helped boost my returns above those of the market. Perhaps I should have reversed to short when the stop was hit. But you can't win them all.
Tuesday, July 04, 2006
June Report
June 30 is the end of the financial year in Australia and is when mutual funds make distributions including tax credits. Therefore, this month's figures may still need to be adjusted when all the information is in.* Net worth fell $15233 to $303249. Investment return was -4.61% for the month. The MSCI index was flat. Spending came in at $1949:
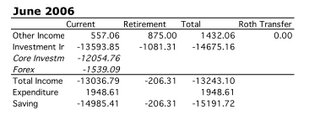
Non-investment income is low this month because of the strange schedule we get paid on. We receive June's pay at the end of May. The other income for June is some money from a research grant I got last year and wasn't paid this bit till this year and retirement contributions related to it and the combined May and June pay.
I report my numbers a bit differently to most other PF bloggers. Most people seem to list things according to accounts and note the change in the accounts each month. I think of investments as individual assets rather than accounts and I think of income in terms of whether I have direct access to that income - i.e. current income - or whether it is in a retirement account - retirement income. I am most concerned with raising my current assets and income rather than retirement income and assets. Mostly it is locked up till age 60. Though, as I've discussed in previous blogs, it is true that the US 403(b) portion (about $30k) can be withdrawn at marginal tax rates and penalties or perhaps without penalty as a 72t. The Roth contributions ($8k) can be withdrawn any time without tax or penalty, so perhaps I should list them as current assets. Roth profits can be withdrawn tax free for a first time home purchase... But the Australian superannuation account is the bulk of my retirement assets and is very hard to access before age 60. My goal is to reach a level where I can live off investments and trading way before that age. So essentially the money is useless to me.
Unlike most PF bloggers, I am not only concerned with the change in net worth but also in the rate of return on investment. Is net worth changing due to spending/saving behavior or due to investment gains or losses?
I also split out the effects due to changes in exchange rates on the current assets. A loss in terms of USD means there was some gain in terms of AUD. Therefore, this loss is not as critical as a loss in the actual base value of assets which I call core investment income.
*P.S. 13 July - adding in tax credits on mutual fund distributions in Australia the return for this month improved to -4.54%...
Monday, July 03, 2006
Buffett and Gates
EI just posted my take on Buffett's donation in response to a poster on the Silicon Investor website:
"Why are you so suspicious? Gates got to be the richest person on Earth. So once you've done that what's the point in accumulating more billions (by selling MSFT stock and investing in other stuff). So you move on to plan two: Create the world's largest charitable foundation. Yes you do get a massive tax deduction so you never pay tax on your income for the rest of your life. Best of both worlds!
Buffett is more interesting. He stopped short of overtaking Gates - he realizes though that in dollar numbers he will never reach in his lifetime the level that Gates reached when MSFT stock was at its peak. The next move is more interesting - he has exchanged the option of making the Buffett Foundation bigger than the Gates one for outsourcing the job and not having to run a foundation - just sit on the board - so he can keep doing what he wants which is running Berkshire.
There is no point I think in giving billions (rather than millions) to your children unless you want them to retain control of your firm. In Gates case he was a minority shareholder anyway - though the biggest. So this wasn't going to be an option. In Buffett's case this ain't going to happen. His three children dropped out of college and aren't interested. They will now have plenty of charity to manage.
OTOH in Australia where there are no inheritance taxes you don't see this happening. Recently the wealthiest Australian resident, Kerry Packer, died. His son was already an executive in the family and public firms. He is now CEO and the shares primarily passed to him, so he is now the wealthiest Australian. Murdoch seems to have struggled with this. Though he is a US citizen now and even transferred the News Corp listing to NY. Will be interesting to see what the eventual outcome is there. Currently the inheritance will be divided among his various children. The News share structure is complex like Berkshires with voting and non-voting shares."
Sunday, July 02, 2006
Learning to Trade
Picking stocks isn't easy and neither is learning to trade. This is why most people are better off buying ETFs or mutual funds, dollar cost averaging and some of the other strategies I have suggested.
When I first started trading I tended to lose money. I would make money for a while and then lose more than I had made. This stage was the "tuition stage". This term is often used by traders.
Recently I have only lost as much as I have made. We could call this the "internship stage" :) Working for free.
Hopefully the next stage when I am trading according to the model will finally be the regular job stage. At least a side job at first.
Why bother? I have learnt a lot through this process. I think there is a high probability that I now start to make serious money from it. Unless my model breaks down and stops working that is. That's what happened to the guys at LTCM. The key to survival is to never take the kind of risks that they did in terms of leverage.
Will report detailed financial results for June soon. What I can say now is: I stayed above $300k in net worth. I lost around 4-5%. The MSCI index was flat for the month. Last month I was up when the MSCI was down. As a result I have about matched the index over these two months. In Australian Dollar terms the loss is about 1% less than in US Dollar terms.
Saturday, July 01, 2006
End of June, Finally :)
A calm day after yesterday. Glad this month is over. I lost money but think I have developed a tool that will make me a lot of money in future. So actually, maybe, it was a good month.
These are the average monthly returns of the MSCI All Country World Gross Equity Index over the last ten years:
January 0.20%
February 0.04%
March 1.02%
April 1.60%
May 0.17%
June 0.94%
July -0.66%
August -2.06%
Septembe-1.51%
October 2.20%
November 3.22%
December 2.34%
And here are mine:
January 1.13%
February-1.48%
March 0.97%
April 0.11%
May -0.42%
June 0.55%
July -0.11%
August 0.41%
Septembe-2.31%
October 3.95%
November 2.85%
December 1.65%
I don't tend to do well in summer but do beat the market in July and August. I do very well in October too. At this point July is looking likely to be negative if I end up writing off Croesus Mining (around 2.5% of net worth). Will be nice to end up with a positive investment return.
Friday, June 30, 2006
FOMC Day
Apparently the markets think the Fed's statement is bullish. I was short and suffered a big loss. Mainly due to being short individual stocks. If I had traded strictly according to the model I would have lost only about 25% of what I did. If you reversed to long when the stop was hit you would be flat for the day. The stop is at a 1.25% loss and the market rose another 1.25% after that. It makes sense I think to reverse at the stop when the next day's forecast is for a change of trend.
I closed all positions and went long... too late in the day though. The model is now forecasting up (like that's hard to do LOL).
From now on I am trading only QQQQ in position trades and now and then in day trades to improve my position. I may also do trades in individual stocks if there is a good reason to do so. But I won't use them to capture the market direction. I may use other ETFs like HHH too. Of course I also invest but I follow strict risk control there too in terms of position sizes.
Let's see if this improves my net worth. This month will be very bad. If I am lucky I will stay just over the $300k mark.
Thursday, June 29, 2006
The Market Went up Today... Better News from Australia
The market went up today, but my model is still on short heading into the FOMC announcement tomorrow. We are getting close to a turning point in the market though. Better financial news out of Australia for me today. There was an update about a very complicated real estate security (IYS) I invested in which is going to be wound up and the capital distributed. The final distribution will be 21 Australian cents a share more than previously offered ($A1.91 vs $A1.70). Should wind up in September. I am tempted to buy more but the risk control side of me says: "who knows what might happen?". The spread is enormous. The bid is $A1.24 and the offer $A1.72. It almost never trades. Maybe put in a bid at $A1.25 and see what happens? I can't see why anyone would sell at that price though. But why sell at the offer price either?
Wednesday, June 28, 2006
Croesus Mining Declares Bankruptcy
I wrote in an earlier post about the trading halt in the shares of Australian gold miner Croesus Mining. In the last couple of days the firm went into "administration" the Australian equivalent of Chapter 11 after the Japanese Mitsui Bank refused to reschedule the gold hedging contracts between it and Croesus. Macquarie Bank in Australia had agreed to reschedule the hedging commitments. This means the value of the shares is likely totally wiped out. I won't write down the loss to my net worth (about 2.5%) until this is finally confirmed. At least some of it can be used as a short-term capital loss reducing the hit somewhat. The basic problem was that Croesus was not producing enough gold to meet its commitments to sell gold to the banks at the prices of the hedging contracts. Therefore, they would be forced to buy gold on the open market at a much higher price fill the contract. Macquarie was happy to reduce the monthly commitment. I suppose they thought that the price of gold will continue to rise so it doesn't matter if they have to wait a while for their cheap gold. And, additionally, they let a borrowing client survive to borrow another day.
Tuesday, June 27, 2006
Kiyosaki Wrong on Mutual Funds
I like a lot of what Robert Kiyosaki says usually and there are serious problems with a lot of mutual funds, but the basic point in his column on Yahoo's website is plain wrong. He says that if a mutual fund earned 8% a year and charged 2.5% in fees (the first number is plausible as an after inflation return on a long stock mutual fund, the second number is high but not totally implausible) then your after fees return is 5.5% which means that over a 65 year period $1000 would grow to $140,000 if there were no fees but only $30,000 after fees. So far so good. But then he says that this implies that the fund manager makes 80% of the return and you only make 20%. Not true. You make 21% of the potential before fees return but the fund company only makes 10% of the potential return ((2.5*30,000/5.5)/140,000). 69% of the potential return just disappears. So it is just as bad as he said but the mutual fund company isn't benefiting from this. The idea that if you lose someone else must be gaining is a common myth among investors - many people think that if the stock market goes down and investors who own stocks lose someone must have gained. Not true - a few short-sellers do gain, but most of the value just evaporates.
The truth about mutual funds is that actually fees don't matter. Fund companies like Vanguard who have low fees would like you to think this. All that matters is your net return after fees. If the return after fees is better than you can do on your own after taking into account the value of your time you would rather spend on something else then the mutual fund is worth buying and otherwise not. You could just buy an ETF invested in a stock index. If an actively managed mutual or hedge fund returns after fees more than this investment then it is worth buying. I find that in very strong trending markets, passive investing beats active investing. In weaker markets active investment seems to win out even after fees. Last year in the US active funds beat passive funds. But in Australia the opposite was true. In the 1990s, active investing won in Australia and passive investing in the US.
The truth about mutual funds is that actually fees don't matter. Fund companies like Vanguard who have low fees would like you to think this. All that matters is your net return after fees. If the return after fees is better than you can do on your own after taking into account the value of your time you would rather spend on something else then the mutual fund is worth buying and otherwise not. You could just buy an ETF invested in a stock index. If an actively managed mutual or hedge fund returns after fees more than this investment then it is worth buying. I find that in very strong trending markets, passive investing beats active investing. In weaker markets active investment seems to win out even after fees. Last year in the US active funds beat passive funds. But in Australia the opposite was true. In the 1990s, active investing won in Australia and passive investing in the US.
Market Forecast
Despite the market being up today all my newly developed indicators are pointing the same way - down. Some other indicators and the chart pattern too are ambiguous. The NDX (NASDAQ 100 index) would need to rise around 14 points I think to reverse this. Something unexpected can always happen. I'm thinking now when I do reverse position I will set up main position using stock after all. This is so I can do an after hours trade if neccessary - you can't trade options outside regular market hours. But the position in my Roth IRA will remain in options. Will be interesting to see how the two approaches work out.
Monday, June 26, 2006
Technical Analysis Modeling
Been spending a lot of time recently on developing new technical analysis methods (commonly known also as "charting" - but the stuff I am developing barely involves a chart). In my academic career most of my research has involved applying time series models (statistical modeling methods related to regression analysis applied to data that is available as observations over time like historical temperatures, GDP, stock prices, population etc.). I have also done some work to apply these methods in the stock market.
I have found that, not surprisingly, it is pretty much impossible to forecast daily changes in stock prices using any standard time series model. This is why academic economists who work in finance say that technical analysis is rubbish and can't work. It is also why technical analysts use indicators which rather than forecasting changes in stock prices try generally to pick out turning points in the trend. I have created one indicator myself that is fairly useful by using an unusual combination of time series methods. My new approach is to try to forecast an indicator.
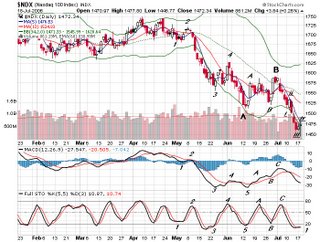
Recently, I have found that if you could predict the direction of the %K(5,5) full stochastic oscillator correctly (see this chart) you would beat the market by maybe 100% in bull market years and by hundreds of percent in bear market years. So being able to predict it is definitely a worthwhile thing. And it is far more predictable than stock prices themselves. Of course, no forecast can be 100% accurate and so these kinds of returns are not possible.
The time series model I have developed so far (in the last couple of days) can predict it well enough to increase the value of the account in bear markets. But in bull markets, following it blindly could lose money big time. Interestingly, we are now in a bear market by that definition. I tested each year from 1997-2006 and see how the model does over each year separately. This is called backtesting and is standard in developing technical analysis methods.
So I think my focus should be on improving those forecasts. Next step is to try some things that aren't in the time series textbook.
Anyway at the moment we have a very high probability forecast that the oscillator will be lower on Monday - i.e. stay short. This is backed up by the McClellan Oscillator and my E-Wave discussed in previous posts.
I have found that, not surprisingly, it is pretty much impossible to forecast daily changes in stock prices using any standard time series model. This is why academic economists who work in finance say that technical analysis is rubbish and can't work. It is also why technical analysts use indicators which rather than forecasting changes in stock prices try generally to pick out turning points in the trend. I have created one indicator myself that is fairly useful by using an unusual combination of time series methods. My new approach is to try to forecast an indicator.
Recently, I have found that if you could predict the direction of the %K(5,5) full stochastic oscillator correctly (see this chart) you would beat the market by maybe 100% in bull market years and by hundreds of percent in bear market years. So being able to predict it is definitely a worthwhile thing. And it is far more predictable than stock prices themselves. Of course, no forecast can be 100% accurate and so these kinds of returns are not possible.
The time series model I have developed so far (in the last couple of days) can predict it well enough to increase the value of the account in bear markets. But in bull markets, following it blindly could lose money big time. Interestingly, we are now in a bear market by that definition. I tested each year from 1997-2006 and see how the model does over each year separately. This is called backtesting and is standard in developing technical analysis methods.
So I think my focus should be on improving those forecasts. Next step is to try some things that aren't in the time series textbook.
Anyway at the moment we have a very high probability forecast that the oscillator will be lower on Monday - i.e. stay short. This is backed up by the McClellan Oscillator and my E-Wave discussed in previous posts.
Friday, June 23, 2006
Plutonomy
Plutonomy is a term invented by some analysts at Citigroup. Download their articles here. The central thesis goes against everything you probably thought about people's saving behavior and what is taught in macroeconomics and development economics. They provide evidence that today in the more unequal developed economies - the plutonomies - the rich save less than the poor or the middle class. In order to understand this idea you need to remember that in the national accounts capital gains are not included as part of personal income. Most capital gains go to the highest income and wealthiest segment of a society. If you are a CEO with big options grants it is easy to spend your salary and save the profits from your option exercises and have a zero savings rate. This turns the popular notion that the decline in the US personal savings rate is due to poor and middle income consumers spending beyond their means (by cashing out housing equity in the middle class or running up credit card and other consumer debt in the working class) on its head. Another thing they don't mention is that people who save successfully for retirement are going to end up in the wealthier segment of society and they are dissaving. This phenomenon does not apply to developing economies apparently even though many are far more unequal than the United States. It is certainly an intriguing idea and the evidence looks strong but something is still nagging in my mind that makes it hard to 100% believe in it.
The Correction Continues - Technical Analysis
We are still in what I believe is a correction of the 14 June rally in US stock markets. Even though yesterday's rally exceeded the previous highs it took place on weak volume. Volume only really picked up when the selling off started. Today was mostly down and then sideways. This type of correction is called a "flat" in the terminology of Elliott Wave Theory.
Check out this chart of the NASDAQ 100 index. The stochastic oscillator maps out the waves pretty clearly. And the last wave of the oscillator is clearly pointing down and has some ways to go before it bottoms out. So market timing doesn't work and technical analysis is rubbish? It is still hard to determine a turning point as it happens. Once the move is underway though the momentum is pretty clear. But a rally like yesterday's is just noise as far as the oscillator on a daily chart is concerned. You need to go down to the hourly chart to detect it... and then keep the daily one in mind too. And this is part of the reason why I am thinking of using multiple trades simultaneously some longer term (based on the daily chart) and some shorter term (based on intraday charts). My mutual fund investments would be traded on the basis of a montly chart perhaps.
Check out this chart of the NASDAQ 100 index. The stochastic oscillator maps out the waves pretty clearly. And the last wave of the oscillator is clearly pointing down and has some ways to go before it bottoms out. So market timing doesn't work and technical analysis is rubbish? It is still hard to determine a turning point as it happens. Once the move is underway though the momentum is pretty clear. But a rally like yesterday's is just noise as far as the oscillator on a daily chart is concerned. You need to go down to the hourly chart to detect it... and then keep the daily one in mind too. And this is part of the reason why I am thinking of using multiple trades simultaneously some longer term (based on the daily chart) and some shorter term (based on intraday charts). My mutual fund investments would be traded on the basis of a montly chart perhaps.
Tuesday, June 20, 2006
Trading Diary Part II
9:33am
I won't post hour by hour detail today. Have a big meeting from 12-2 anyway. Market is showing early strength. For the moment I will hold my positions until I am clear a bottom has been reached and then reverse course to the long side. Will report positions at the end of the day. Right now I am short 50 GOOG, 500 QQQQ, and 100 AAPL as at the close yesterday.
4:03pm
A mixed day - not much to report - ended down $50 overall in my Ameritrade accounts and with more short positions than I started. So the new plan still isn't implemented but my trading positions are not bigger than my risk management allows: 1000 QQQQ, 50 GOOG, 100 HANS, 100 AAPL all short (and 4 QQQQ puts and 150 GLD long in my Roth account). The GOOG and HANS positions are in the 5-6% of net worth range. QQQQ positions can be much bigger as this is a market index. My current position is conservative.
Monday, June 19, 2006
Trading Diary
Today I am trying to exit from my previous strategy and initiate the new one.
9:54am
I went into today short 100 GOOG and 500 QQQQ in my trading account (I also have 1 BRKB in this account. I added 500 QQQQ and 100 HANS to the short position in pre-market or the first few minutes of trade. Let's see how it goes. Barrons had a negative article on GOOG (as did the Economist) over the weekend. In Friday trading GOOG's share price got pinned down to the $390 strike at the option expiration. Maybe it can fall a little now that the options expiry is over. I see the market as a whole as needing to consolidate a little after last week's rally. HANS is very volatile and so sometimes is good for daytrading though often spreads are big and often it can't be shorted and because of the relatively low liquidity spikes in either direction can easily appear from nowhere. So not the ideal daytrading stock. But I don't have any other real ideas.
I have the market running on my laptop while working on other stuff on my desktop. Using the F9 key on my Mac I can get all the windows to be visible nicely spreadout across the screen and monitor various stocks for anything unusual out of the corner of my eye....
10:10am
Perfect reason not to trade individual stocks in large amounts - $5 spike up in GOOG came out of nowhere in 5 minutes. $2 of the spike happened in 1 minute. As I write the stock is falling back. No news out, nothing. I don't need this kind of stress. If I had half the number of shares I wouldn't worry.
10:23am
GOOG's back in the red for the day LOL
12:53pm
I am tracking the SP500 index. Tech stocks are showing relative strength today and it is hard to tell which way the market will go by just looking at the NASDAQ indices alone. The SP500 index though is much easier to read and if it goes down it is hardly likely the NASDAQ will go up. Looking at correlations across multiple indices and securities is one of the ways I try to work out what will happen next. Most individual traders and market commentators seem only able to focus on one thing in isolation.
1:40pm
With AAPL showing relative strength today and everything else near or at session lows. I add 100 AAPL to the bundle of shorts. Maybe this is getting too clever for my own good. But I figure the downside can't be too bad. Now I am using my full daytrade buying power.
2:47pm
With indices at session lows I bought to cover half my QQQQ and GOOG positions. The remaining positions are around 6% of net worth each and so much closer to my comfort zone. I am also well within the overnight margin requirements. So from now on if the market goes down more good, if it goes up a bit no big deal.
3:31pm
I covered the HANS position for about $500 profit. Actually I accidentally pressed the button :) I had the order set up and was looking for the price to fall back a bit and then accidentally leant on my laptop.... anyway the probability of more gain is too low now to make reshorting it worthwhile.
7:24pm
Well it was a good trading day, but we will need to wait till tomorrow to complete the transition plan. But at least I no longer have an outsized position in an individual stock.
Sunday, June 18, 2006
Mid-Month Update
As of 16 June net worth has declined to $304k (down $14k) with an investment return for June so far of -4.56%. The MSCI global index (in USD terms and including dividends on a pre-tax basis) is down -3.41% for the month so far. So I am lagging the index. YTD my return is only 3.20% against the MSCI at 2.80%.
Saturday, June 17, 2006
New Short-Term Trading Plan
After my experiences over the last couple of months I have developed a new trading plan to try to implement a bit more discipline. This doesn't cover very long-term trades using mutual funds and changing currency exposure.
1. Only do short-term trades in my US accounts. This gives me a break rather than thinking I need to trade in both the US and Australia. Australia is only for long-term investment and long-term trades. The rationale is that it is more expensive and difficult to trade in Australia in every way (executing trades and getting real time information) and the market is less liquid.
2. Set up a position trade (i.e. for period of week, weeks, months) using options on QQQQ based on my own market timing model, E-Wave, and other technical analysis of daily and weekly data. The rationale for this is that options give some up and downside protection in the event of an unexpected market move (and stops won't really help outside the regular market day) and that option spreads (difference between bid and ask prices) are wider than individual stock spreads so that daytrading options can be difficult.
3. Set up a few position trades of small size in individual stocks. These should be less than 5% of net worth and probably smaller.
4. Do day and multi-day trades using stock in QQQQ and individual firms where appropriate. Use stops on these trades to weed out the losing trades fast. I don't have to day trade as I will have a position trade in place. Hopefully in a situation like yesterday I would have shorted the stock but kept a call options position. This would have mitigated the damage. Even better would have been not to go short at all till the end of the day :)
Comfortable Being Bearish
Went into today with my Ameritrade account short and added to the shorts and bought puts in my Roth IRA. So far it is working out. And I feel much more comfortable being bearish than trying to be bullish. It suits me much better :)


Friday, June 16, 2006
Trading and Emotions
I am now at the point where I know good money-making trades but the problem is actually executing them. Seems that all the recent volatility in the market has shaken me up and I am making bad decisions. Starting today I had good positions and ideas for good trades. I executed those trades and then midday reversed course and blew up most of the profits I had made. Don't really know why I did it. I guess there is the fear of losing the profits I had made. But why go short? Anyway the market kept rising through the day and I ended up giving back most of my profits by the end of the day. My trading account and Roth IRA ended up about $500 on the day but it could have been at least $2000 if I had played things right. Only consolation is that this is only 10% of my money. Another 10% is in my 403(b) and 80% in Australia in retirement and non-retirement accounts which I am not actively short-term trading.
Sunday, June 11, 2006
Net Worth Update
After last week's "trauma" I did a thorough update of the results so far this month. Investment return is -2.67% but the MSCI World gross index is down 2.82%. So still beating the benchmark :P I guess reversion to mean. Lot of luck in this business. I just hope that each debacle I suffer in the markets makes me a better investor and trader. The data so far say yes. But it is a very slow process. I updated my net worth profile and it is down almost $8000 or 2.5%.
Friday, June 09, 2006
Stressful Trading Day
Today is a day when everything went wrong. Here are just some of the things
1. I went into the day long even though I didn't really have any good case for it and vaguely thought I already should have sold.
2. I didn't manage to sleep last night. Not good for cool headed decisions.
3. I still didn't sell when the futures showed the market would open down or whent he market started falling - I was like a deer in the headlights.
4. Cramer said to sell HANS the night before.
5. I finally sold half my position after QQQQ had bounced 20 cents above the bottom. That was enough for me to stop panicking.
6. The market then rallied to end the day not far from where it started. I had to be in a meeting for part of that, but don't think I would have added to my position anyway at this stage.
The realised loss after tax is about 1/2 % of net worth. So in the big scheme of things not really such a big deal I guess. B ut I was feeling very scared while it was happening.
One of my problems is that when my trading starts going well I get cocky and arrogant and start breaking my rules. Then I blow up. Mostly I am upset at the time I wasted making those profits in the first place and why I was so dumb.
To make money trading you need emotions, but too much fear and panic will end up losing you money.
One good move: I sold my TLT call options just when bond prices were at the peak of the day.
Wednesday, June 07, 2006
Today's Report
I think there is still more downward movement coming in the stockmarkets in the next week or two, but today I sold most of my put options (kept Starbucks as it didn't seem worth trying to trade it) and covered my short positions and went long (QQQQ and HANS) for this bounce. The bounce might end tomorrow already but hard to tell at this point of course. I now have a small margin loan in my US account.
Tuesday, June 06, 2006
Net Worth in Australia
An interesting article about net worth levels in Australia. In the US median net worth is around $US93000. Recently I read in the New York Times that US mean net worth was just above $US400k. The mean net worth in Aus according to this article is similar ($US351k), while the median is more than twice as much ($US225k). However, the Australian study includes the value of cars and household contents in net worth which the US data does not - a comparable median figure is probably around $US175k. Official statistics typically place Australia with income per capita of around 80% US levels and around the same level of inequality in terms of income. These data indicate less inequality of wealth in Australia than in the US. I have seen median net worth statistics for Sweden and the UK which were much lower than the US median. Is the typical Australian the wealthiest citizen in the World? A comprehensive international comparison would be very interesting.
Sunday, June 04, 2006
Kondratieff Waves and Deflation
Michael Alexander has begun a new series of articles on SafeHaven. His analysis can look a little weird to mainstream economists like me but reading his articles in the past was the first time I really began to understand the Kondratieff Cycle. Of course I was familiar with this long cycle of more than 50 years in economic activity, but none of the previous discussions I had read seemed to be particularly well-informed and it was rather confusing to me. If the theory is valid then the current cycle is longer than previous ones. We are currently supposedly in the deflationary depression part of the cycle in the US - though Japan went through that in the previous decade. Yes, both Alexander and Mike Shedlock think that deflation, not inflation is the threat. I think they are probably right. My big bet on bonds in my portfolio (and my Mom's) wouldn't make sense if I thought we were facing inflation. In inflation interest rates rise and bond values fall. This is what happened from 1966 to 1982 in the US. Since then the reverse has been happening. We believe that the disinflationary cycle is not yet complete. Both these commentators have been marshalling the evidence in favor of this thesis. Everything I see reinforces the suspicion I already had that this is what will happen. Of course this is a hyper-contrarian belief. Most so-called contrarians believe that inflation is greater than government agencies state and that it will rise further. Wall Street orthdoxy is that the economy is strong, the Fed will stop both inflation and deflation etc. Actually, I don't think we will see any significant deflation in the prices of goods or services but little inflation either.
BTW, I finally got the second part of my Federal Tax Refund in my HSBC Online Savings Account. I now have over $11k piled up there exactly balancing my credit card debt. In July I will pay off all those debts before the zero percent offers terminate. I may get balance transfers in the future but will use a lower balance ratio so as not to affect my credit score.
BTW, I finally got the second part of my Federal Tax Refund in my HSBC Online Savings Account. I now have over $11k piled up there exactly balancing my credit card debt. In July I will pay off all those debts before the zero percent offers terminate. I may get balance transfers in the future but will use a lower balance ratio so as not to affect my credit score.
Saturday, June 03, 2006
Levels of Frugality and Wealth Creation
There is a lot of personal finance advice out there on the web and a lot of it is quite good, but of course little or none of it is tailored for people's specific financial situations. The things that are going to be important to focus on are going to change not only with people's life stages but also with their wealth and income relative to expenses. I've seen quite a few discussions in the blogosphere about whether paying attention to the latte factor makes a difference or whether PF bloggers are saving too much for retirement. And then there are people with negative net worth giving advice to supposed multimillionaires.
So here are some random thoughts:
1. If you are a student or on a low income the key is not to get into a level of debt which will be hard to stablize or pay down once you start working or get into a higher income job. Being very frugal is going to help. But it doesn't make sense to make undue sacrifices if you know your future income is likely to be much higher. My Dad told me I should be saving when I was a grad student rather than borrowing. I ignored his advice, to my mind that made no sense.
2. If you are earning roughly the average income for your city, country etc and can't make ends meet, then serious frugality intervention is required to get back into balance. This is where the stop buying crap, latte factor etc. are going to be important. Otherwise, I think even if you expand your income, your expenses probably will expand at the same rate. This has never been a problem for me or some others. We are just lucky to have had the frugalness meme instilled in us I guess. So I don't discuss this at all in my blog.
3. Once you have that under control then I think income expansion becomes the next focus whether increasing salary, or business and investment income. My focus in the blog is on the latter and how to manage the money. The key I think is to expand expenditures slowly and smoothly over time so that they always remain far behind income.
4. Once you have money to save then the natural focus is where to put it. When your monthly savings are still relatively large compared to your total wealth, managing the money is probably less important. For example, if the stock market goes down, the dollars you lose will not be very many and your new savings will buy more shares through dollar cost averaging. At this stage all the usual PF advice about building up emergency funds, index fund investing, different types of retirement accounts etc. is most relevant.
5. Soon enough you have more wealth than annual income or several times more wealth than annual income. The absolute dollar impact of each investment decision becomes greater. At this stage, searching for superior investment managers, seeking true diversification, thinking about market timing strategies etc. becomes much more relevant. That is the stage where I am at with financial wealth equal to more than four times annual income. So it's what I am mostly going to blog about. Buying real estate (or not) I think should come in at this stage. Most middle class people are house rich and financial asset poor. No surprise that I'm not a big believer in the usual advice about buying a house. To my mind it would usually be a good idea to get beyond stage 4 at least first, but this will differ with local conditions and personal preferences.
There are stages beyond here of course - when true wealth is reached and you can live off of business income, investment income, or retire. Or take an increasingly proactive role as an investor.
Friday, June 02, 2006
Monthly Report for May
I am happy with my financial performance this month and this year so far. Net worth increassed $6413 to $318482. It would have been stronger if there hadn't been a bit of a fall in the Australian Dollar. The gain in Australian Dollars was $A12740. I am almost halfway to my goal of adding $100,000 in net worth this year. At the beginning of this blog I said I would be happy with adding only $50,000 for the year, so I should be really happy now :) Investment performance for May was 0.59%. Doesn't seem much but the MSCI world index fell 3.33% and many stock indices and mutual funds fell by much more. I've noticed quite a few bloggers out there commenting on the decline in their portfolios in May. I am up 8.14% year to date (MSCI 6.35%) and 18.97% for the last 12 months (18.55%). Over the last three years I have gained more than twice the gain in the index. Beating the index is possible. But it takes both effort and skill and maybe luck :)

Other income is particularly high this month because my employer always pays June's salary on the last day of May. Spending was high this month because of the vacation trip and associated expenses. As you can see investment income on non-retirement accounts was halved by the change in exchange rate (I don't bother computing this for the retirement accounts). In order to increase net worth in June I am going to need to have a higher investment income than my spending (the retirement contributions for June will still occur in June though). That might be hard!
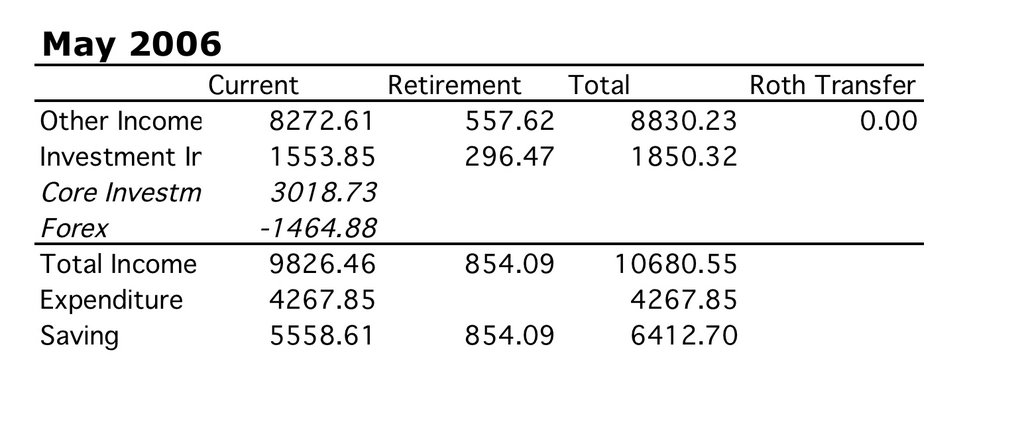
Other income is particularly high this month because my employer always pays June's salary on the last day of May. Spending was high this month because of the vacation trip and associated expenses. As you can see investment income on non-retirement accounts was halved by the change in exchange rate (I don't bother computing this for the retirement accounts). In order to increase net worth in June I am going to need to have a higher investment income than my spending (the retirement contributions for June will still occur in June though). That might be hard!
Thursday, June 01, 2006
Follow-Up on US Retirement Accounts
I've done a bit more research since posting on the retirement account puzzle. I now see that there are more options to get the money out of US retirement accounts without penalty before age 59 1/2 than I thought. The main one is if you convert the account into a lifetime annuity you can withdraw the money anytime without the 10% penalty (see comments for a better option suggested by Stealthbucks - coincidentally one of my local fiannce radio shows is talking about it right now...). For 401(k)s and 403(b)s it will be taxed at your marginal income tax rate rather than the lower investment (long-term CGT, qualified dividends) rates. You can get a variable annuity which varies with an underlying investment or a fixed annuity. A key issue here will be your tax rate when making contributions vs. withdrawing them. If you are happy with the annuity option and the tax rates work out in your favor then this could make sense. However, for a Roth IRA the distributions are taxable before age 59 1/2. So 401(k)s, 403(b)s, and traditional IRAs are clearly superior for this purpose and I think taxable accounts are too.
The other way money can be withdrawn before age 59 1/2 without penalty is if you are over 55 and leave your job or make a hardship withdrawal etc. (Roth's also allow a withdrawal for the first time purchase of a residence after the account has been open 5 years).
Australian retirement accounts are not as flexible in terms of withdrawing the money before age 60 (for those of us born in 1964 and later). It's not even a question of paying penalties.
Please only use my blog as a starting point to do your own research as I am not a qualified financial adviser of any sort.
Tuesday, May 30, 2006
Hussmann and Svenlin on the Stockmarket
Here is the latest from Hussmann on the stockmarket. He seems to be one of the smarter guys around with regard to market analysis. Basically, he says hedge your stock portfolio against loss at this point. This is what I have been doing (after a rebound in the Aussie markets in the last two days my investment return for May seems to be 0% exactly :)).
Why hedge rather than just selling everything and going to cash? In taxable accounts there is the capital gains tax issue. If you sell you pay the tax with 100% certainty and you especially don't want to pay the short-term rates (as they are in the US and Aus) if you can avoid it. If you hedge and you are wrong you sell the hedging instrument (or buy back shorted shares) and take a capital gains loss. Another issue is mutual funds cannot be traded intraday. In reality there can be a day or two delay in getting the transaction done. If the market moves up suddenly you lose out. Hedging positions are normally much more liquid - I hedge with shares or options on ETFs or heavily traded stocks. For big investors, individual stocks are illiquid, they hedge in the futures market which is much more liquid.
Of course you can get more aggressive and overhedge until you are net short. I am slightly net short by standard measures. Again it is a risk if you are wrong - in the long-term stocks go up and based on the law of percentages up moves are bigger than down moves - a stock can only go to zero on the downside - but can go up infinitely in theory on the upside...
Carl Svenlin has posted an article on shorter term technical trends. I think that short term bounce is likely completed for now, but a larger rebound will happen in the first half of June.
Sunday, May 28, 2006
Portfolio Update
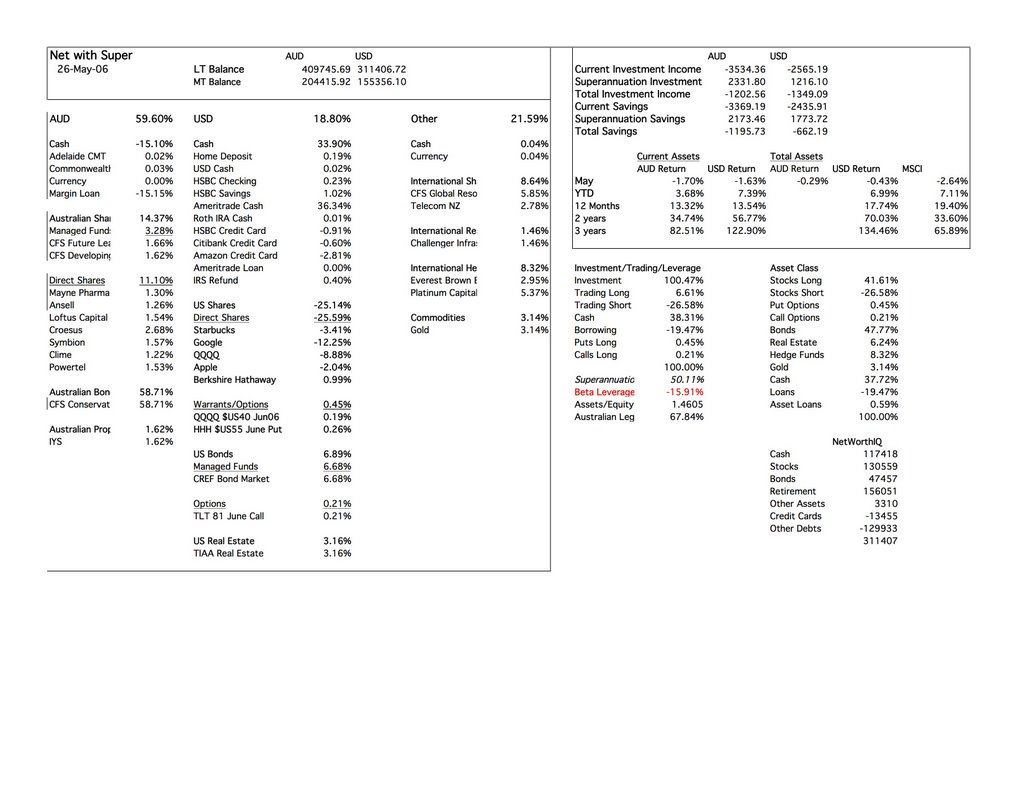
This is the first time I have provided a snapshot of the allocation spreadsheet I use to give myself a picture of my portfolio and calculate my NetWorthIQ numbers. It includes percentage allocations, summary allocations, performance figures, and total portfolio, saving etc. in US and Australian Dollars. It is based on a whole series of underlying spreadsheets. Each month I create a new worksheet like this from the previous one. That way I can compare this month to previous months. I was inspired by the worksheets George Soros provided in "The Alchemy of Finance".
I'll mainly focus on the current allocation in these comments. The main window shows the allocation of assets to securities and funds irrespective of whether they are in a retirement or taxable" account (Australian retirement accounts are taxable, but at a concessionary rate). The overall strategy which I ahve discussed is to invest 100% of assets in medium to long-term invests and then use leverage to trade. The market risk of the medium to long-term investments is adjusted slowly - preferably not more than once a year.
Main categories:
Mutual funds:
CFS (Australia), TIAA, CREF mutual funds - 78% of total. These are currently in a conservative mix - the largest amount is in the CFS Conservative Fund which is 70% bonds and cash, 30% equity related. When I think the stock-markets have bottomed I will become much more aggressive here.
Closed end/listed hedge funds/fund managers:
Everest Brown Babcock (fund of funds), Platinum Capital (listed hedge), Loftus Capital, Clime, Berkshire Hathaway - 12% of total - in the long-run I want to have much more in these kind of investments with the plan to only sell if the managers performance declines. Listed property/infrastructure adds another 3% in Challenger Infrastructure and IYS. Berkshire is really an insurance conglomerate but I think of it like a hedge fund/fund manager.
Individual stock investments:
Telecom NZ, Mayne Pharma, Symbion, Ansell, Croesus, Powertel - 11%. This is the extent of my "traditional stock picking". As I've posted, I don't do a lot of it. Mainly these are health or telecom firms. Croesus is a rather unsuccessful gold miner.
Trading:
A mix of short stock positions - Starbucks, Google, Apple, QQQQ, options - TLT, HHH, QQQQ, and gold. Any of these can be traded at any time, often intraday. Overall I end up with 46% more assets than equity. Less than half of that additional money is borrowed cash (19%) the rest is in borrowed stocks (26%). Short-selling requires holding lots of cash on deposit. That's the reason for my big cash holdings: 38% of assets. Cash outside my trading account is only 2% of assets. I have been withdrawing some profits from my trading account to my HSBC Savings Account in anticipation of paying off my credit card balances in the next couple of months (mostly zero percent). I missed out on playing this bounce in the markets in the last 3 days - I think there is another downwave to come before a more significant rally occurs. I will let you know when I get short-term bullish. However, I am not so bearish - If the stockmarket falls 10% I only stand to gain 1.6% (beta leverage) and so far I have lost money this month (0.43%) though less than the benchmark index has (2.64%).
Saturday, May 27, 2006
Two Interesting Articles from the Economist
One story about the world economy and state of the financial markets and another with the latest edition of the Big Mac Index. Seems to me that the Economist is a bit too optimistic about current earnings levels of firms being maintained going forward. Also I am surprised that the Yen and Hong Kong Dollar are undervalued by this measure.
Friday, May 26, 2006
Timing the Market
Today stock markets are rising around the world. The decline to this point hasn't received much attention outside the financial media. Some bloggers are beginning to notice though that their portfolios are taking a hit. I think that those who are selling out of stock mutual funds at this point are likely to feel better about their decision later in the year. I have been discussing the potential for a significant decline in the markets for a while now on this blog. And many others are coming to similar conclusions. As this article notes though, most individual small investors don't get market timing decisions right. And more sophisticated traders screw up too all the time :) The real solution is to invest in a portfolio of hedge funds of course and outsource that decision making. That can be hard for most individual investors. There are funds of hedge funds that take relatively small investments. The problem with many of these is that the funds willing to take investments from these funds of funds are not the superior hedge funds. Finding a good one takes some research. I know of one exception which is the Everest Brown Babcock fund of funds listed on the Australian Stock Market - sorry that isn't much use for US investors. The other alternative is a truly diversified portfolio with rebalancing and other techniques which I have discussed on this blog, here, here and probably other places.
Thursday, May 25, 2006
More Volatility
Today was another volatile day in the financial markets. Gold fell - obviously the wave 2 correction I disucssed yesterday is not over but with any luck this is the lowest point it will reach for now. If my new interpretation is right it would be a good trade to sell any short-term rally in gold. Stocks fell and rose and fell and ended up... Bonds rose and the yield curve by one measure is again inverted. The US Dollar strengthened again. But recent action in the dollar looks to me like a corrective wave or consolidation before the next fall (I think the same on stocks too).
And yes, my net worth is now down for the month. Investment performance is -0.5%, which is still much better than the the MSCI index's 4.5% loss (losses for other indices and stock mutual funds and similar or greater). Heavy spending on the trip didn't help either. My long positions in mutual funds and stocks are very conservative, but my short positions are not quite compensating. One short position (on News Corporation) went very wrong. The Australian Dollar has also been weak.
And yes, my net worth is now down for the month. Investment performance is -0.5%, which is still much better than the the MSCI index's 4.5% loss (losses for other indices and stock mutual funds and similar or greater). Heavy spending on the trip didn't help either. My long positions in mutual funds and stocks are very conservative, but my short positions are not quite compensating. One short position (on News Corporation) went very wrong. The Australian Dollar has also been weak.
Wednesday, May 24, 2006
Evening Market Update / Gold Chart
Like the US stockmarket today, Asian stockmarkets opened higher but have reversed at this point after Hong Kong opened at 10pm EDT. Though I am very bearish on stocks I am bullish on gold. Here is a chart the gold ETF GLD in the last two years with my educated guess of the simplest division of the move into Elliott Waves:

The count as posted means that the next move in gold is the third wave of the third wave up since mid 2005. That means that the move since then is less than half complete at this point. 3rd of 3rd waves are often very strong. Even if my exact count since mid 2005 is wrong the chart shows that using E-Wave principles we have to conclude that gold has not yet reached a final bull market peak - up waves must have 5 or 9 (or 13 etc.) subwaves and at the moment we only seem to have 8 at the most - the five subwaves of what I've labelled wave I and then II, 1, and 2. Elliott Wave theory is a very important tool in my technical analysis - both of long term trends and in intraday trading. It takes a lot of experience and skill in pattern recognition to use it properly. I find I get much better results by combining it with other forms of technical analysis and for the longer term analysis combining technical analysis with fundamental analysis and macroeconomics. Most E-Wave practioners think that the latter is tantamount to sacrilege. This doesn't make any sense to me. I also try to understand the relations in the patterns of different markets and securities. In general the more data point in the same direction the more reliable the result is likely to be.
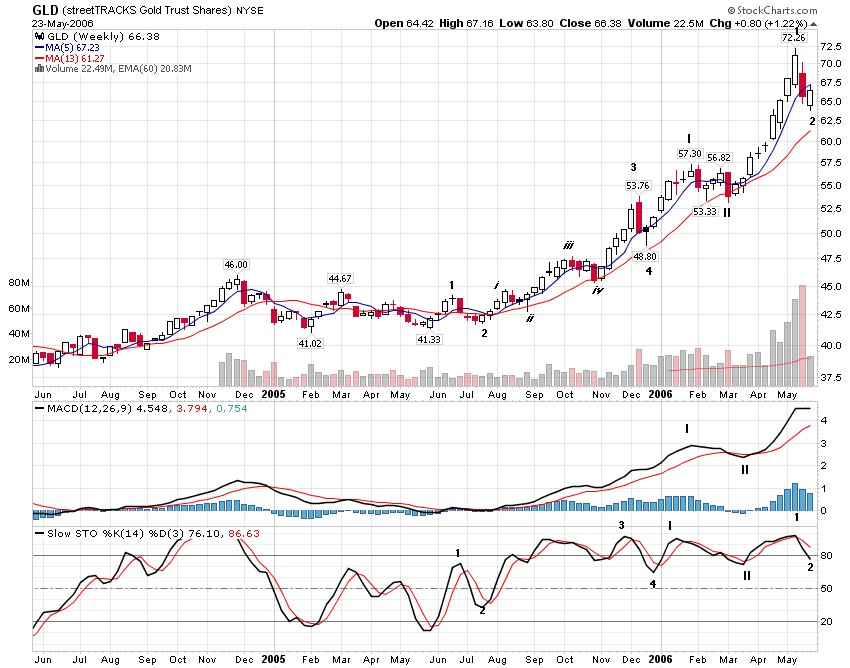
The count as posted means that the next move in gold is the third wave of the third wave up since mid 2005. That means that the move since then is less than half complete at this point. 3rd of 3rd waves are often very strong. Even if my exact count since mid 2005 is wrong the chart shows that using E-Wave principles we have to conclude that gold has not yet reached a final bull market peak - up waves must have 5 or 9 (or 13 etc.) subwaves and at the moment we only seem to have 8 at the most - the five subwaves of what I've labelled wave I and then II, 1, and 2. Elliott Wave theory is a very important tool in my technical analysis - both of long term trends and in intraday trading. It takes a lot of experience and skill in pattern recognition to use it properly. I find I get much better results by combining it with other forms of technical analysis and for the longer term analysis combining technical analysis with fundamental analysis and macroeconomics. Most E-Wave practioners think that the latter is tantamount to sacrilege. This doesn't make any sense to me. I also try to understand the relations in the patterns of different markets and securities. In general the more data point in the same direction the more reliable the result is likely to be.
Another Crazy Day in US Markets
First the stockmarket was up strongly and then towards the close it slid heavily - a slide that continued after the official close. This wasn't at all unexpected to me, though Google rallied stronger than I expected and closed up. I reduced several short positions near the close ($40,000 of SBUX, AAPL, QQQQ) - not because I think we have yet reached the bottom but in order to get back within my margin requirements. Day trading buying power (on margin accounts with more than $25,000 in equity) lets you buy or short much more stock potentially than regular overnight margin requirements allow. If you hold the position overnight you will get a margin call, but the broker won't forcibly close the position that day as they have to allow you time to sell or deposit more cash etc. So this is what happened to me today. I get margin calls all the time because I tend to do extreme things with my account. But I haven't had a forced sale in years... All the trades I closed were profitable. My average profit on closed short-term trades in my taxable accounts is now 0.45% for the year again. This reflects some good and some bad trades. On the other hand Roth IRA is now up 40% since I opened it. I am amazed at how well those trades have gone - again there have been winning and losing trades but the winners have far outshone the losers. Currently I have 150 shares of GLD and 7 $40 June QQQQ puts in the account as well as a very little in a money market fund. I am increasingly thinking that individual stocks are most suited to long term investment and day trades, while short-term position trades are best handled using ETFs (or futures ultimately). The potentially high volatility of individual stocks can be useful intraday, when gapping is not possible and stops can be used. But it can be a real pain if it goes against you on position trades (held overnight, or for days, weeks etc.).
Tuesday, May 23, 2006
Stockmarket Slide Continues - Is Slowing Growth or Rising Inflation Responsible?
The slide in global stockmarkets continued today (and tonight in Asia). Not getting a lot of attention yet in the mainstream media (in the US at least) and in the financial media commentators are mostly remaining bullish. Bill Gross has posted his annual economic outlook. The bottom line is he still expects inflation to be low and bond yields in the US to remain in their recent range. He expects global growth to remain relatively strong. Others also think that the inflation outlook is benign but that global growth is likely to slow. This is on the whole my take, but I think the US stands a strong risk of outright recession in the coming year. Barclay's Bank warn that current conditions are very similar to those in 1987. I already made the same analogy with the big caveat that resource prices have been rising now, which wasn't the case in 1987. Others are similarly bearish but are looking for the main decline in the markets to occur in the Fall. There is no reason why we have to wait for the Fall for a crash to occur. On the other hand a slow slide across the midle of the year is entirely possible as are strong countertrend rallies on the way.
Something interesting is that bonds have begun to rebound from their recent lows. The sell-off in gold and other commodities may also have exhausted itself. I don't see us as being in a commodity price bubble. There is a genuine shortage of supply in many commodity areas. Perhaps the long-term trend of declining real resource prices (except for forest products) has begun to reverse? In the very short-term I am expecting a flight to safety to US government bonds and gold as stocks slide further. Regarding my own portfolio today, I rolled my QQQQ put options to a lower strike to free up some equity and buy gold with it. I also shorted more Google shares.
Something interesting is that bonds have begun to rebound from their recent lows. The sell-off in gold and other commodities may also have exhausted itself. I don't see us as being in a commodity price bubble. There is a genuine shortage of supply in many commodity areas. Perhaps the long-term trend of declining real resource prices (except for forest products) has begun to reverse? In the very short-term I am expecting a flight to safety to US government bonds and gold as stocks slide further. Regarding my own portfolio today, I rolled my QQQQ put options to a lower strike to free up some equity and buy gold with it. I also shorted more Google shares.
Monday, May 22, 2006
NetWorthIQ Top Ten List
I just entered the NetWorthIQ Top Ten List. Cool :) Probably it's because I am the top of the most active user list. Just got back from a roadtrip to Charlottesville, Virginia and back. Was a lot of fun and we had many memorable experiences. That included crashing the car into the grassy median of a highway resulting in $1000 in repairs which we did in various places en route. We also had to stay in New York City for an extra day and had to rejig the trip plan. Will soon get up to speed on the financial situation - there will be some goods (US tech stocks fell) and some bads (Aussie Dollar and gold fell, News Corporation shares rose). Seems that overall I am down several thousand from where I was before the trip. Investment performance for the month is a positive 0.45% gain versus a 3.45% loss for the MSCI index. Year to date I am up 7.94% vs. 6.22% for the MSCI. Over the last 12 months I am up about the same as the MSCI at 18.78% vs. 18.4%. Only a couple of weeks ago I was lagging seriously behind the MSCI over each of these time horizons. My assessment of sentiment from various sources is that on the whole investors remain mostly bullish. This probably means that the selling of stocks has not ended yet.
Thursday, May 11, 2006
More Good Tax News
More good tax news for investors on this side of the Pacific today. Interesting factoid in the article is that only 23% of people in the $50,000-$75,000 income bracket have any taxable investments. And even at the $1 million income level there are still 19% who don't.
Another Fed Day
Nothing unexpected for me in the announcement. After the announcement at 2:15pm, the dollar fell, bonds rose, gold rose, oil rose, and non-resource stocks fell. The "perfect storm" for my portfolio. Nice to have a little encouragement for my strategy. This evening at 5pm EST is the Google shareholders meeting.
Wednesday, May 10, 2006
Australia Simplifies its Retirement Accounts System
In the Federal Budget announced last night, treasurer Peter Costello, announced among other things a simplification of the superannuation system - Australia's retirement accounts system. Unlike the US there was already only one type of account but the tax regime was a little complex. It consisted of a 15% tax on contributions, a 15% tax on earnings, and above certain limits - additional taxes on payouts. Getting a payout as a pension annuity was tax-favored over taking a lump sum. So it was some mixture of tax concession and deferred tax regime.
The new system removed the complex regime of taxes on large payouts. Now it seems there is just a 15% tax on cointributions to and earnings of the funds and no taxes on payouts after age 60. This news is important for me because 40% of my net worth is in an Australian superannuation account. I estimate that I will save at least $A90,000 in tax that would have been paid in 2024-5.
For Americans and people from the many other countries that visit this blog it might be interesting to compare these moves in Australia with the system in your country. The announced changes makes this system simpler and lower tax than any of the US accounts - especially for people in higher tax brackets - as the only tax that will ever be applied is 15%. Also the maximum contributions allowed are much higher for people over 35 than those allowed in the US - equivalent to $US 40,000 per year. The downsides of the Australian system is that it is harder to withdraw your money before age 60 though it seems that now money can be left indefinitely in the Super system at the 15% earnings tax rate. In the US earnings on the Roth remain tax free and IRA/401(k)/403(b)'s etc. remain tax deferred until the money begins to be withdrawn (with compulsory withdrawals at age 70).
Sunday, May 07, 2006
Sell Signal on the S&P 500 and Dow Industrials
The S&P 500 and Dow Industrials rallied strongly on Friday (punching through the 34 day Bollinger Bands indicator I like to use). This triggered the same sell signal on these two indices that occurred for the NASDAQ 100 index a few weeks ago. In 2000 the NASDAQ indices also started the big decline before the S&P 500 and Dow Industrials did. It could happen again.
Saturday, May 06, 2006
The Retirement Account Puzzle
One thing that puzzles me after my explorations in NetWorthIQ and PFBlog space is the obsession with retirement accounts. Many people write about getting financial freedom and are saving but they are stuffing the maximum into retirement accounts. In the US you generally can't touch these until age 59 1/2 and then the money withdrawn is taxed at your marginal rate of federal and state tax. If you touch the money before then you pay the marginal tax plus a 10% penalty (in Aus it is almost impossible to get the money out of a Superannuation account before age 60). Yes I know that a 401(k) defers tax to the future and the profits on a Roth IRA are tax free (if withdrawn after age 59 1/2 or in special cases - see below) and Roth contributions can be withdrawn at any time. But the federal long term capital gains tax rate is now 15% and the qualified dividend rate is also 15% (with 5% rates for lower income earners). And you can use the money to achieve financial freedom at any time....
If you are nearing 60 it certainly makes sense to stuff the maximum into a Roth as you will soon be able to get it out again (a 401(k) or traditional IRA will convert potential investment income though to ordinary income). But if you are in your 20s as many bloggers are - 60 is a long time off. Of course it makes sense to make contributions in order to get an employer match - even after paying a 10% penalty to withdraw the money that can usually be worthwhile.
I have about half my net worth in retirement accounts. Most is in an Australian Superannuation account. I had no choice on the level of contributions as a condition of my employment at a university in Australia. We put in 8% of our salary and the employer contributed 17%! That is the deal the unions had negotiated (I didn't join the union - but had to accept the same pay deal). All employers in Aus must contribute a minimum of 9%. There is no system like the US Social Security in Australia. Instead real savings must be made by employers and there is a flat rate welfare payment for poor retired people called the Age Pension. Here in the US I have to contribute 1% and my employer contributes 8% to a 403(b). I don't have any choice there either, but if I did I would do it - it is an excellent deal. However, we can make extra contributions, which I don't do.
I did open a Roth IRA recently with the sole purpose of creating $10,000 of tax free profits towards a first time purchase of a house, which is one of the special uses allowed. I will likely withdraw the contributions once that goal is achieved, though that is subject to review. The last thing I think I am going to need is more money at age 60.
Friday, May 05, 2006
Reflections on PF Bloggers
I've been reading plenty of these PF blogs as well as creating my own since discovering the NetWorthIQ website. It is very interesting to see how different people think and feel about money. Maybe I should get a new career as a financial adviser instead of as an economics professor :) As a professor, I just just get to tell people how to think about money (when teaching introductory courses) ...
Mainly I have discovered how different I am to the majority of bloggers out there. There are at least two very different universes in the financial internet. People interested in investing and trading on sites like Silicon Investor, which I've belonged to since 1998, have a very different mindset to those interested in personal finance. There are, though, some crossovers like Stealthbucks and Adventures in Money Making. Investor blogs look very different. Investors aren't interested in saving money but instead on making more of it (and protecting what they have). Some of them are naturally frugal and some not. Most, but not all, PF Bloggers seem more directed on saving money than making it. Maybe an exaggeration... but that is why I recently added the phrase "Absolutely no money saving tips!" to my profile.
I don't try to save money and don't need or want money saving tips. It seems I am just trained to be naturally frugal. I don't like buying things, or having things. What I do buy though has to be good quality and convenient. I do take advantage of any deal which is not inconvenient to do. It's not a question of trying to control expenditure or deny myself things. I just spend whatever I want and given current income it isn't too much. On the other hand, when I was a student or unemployed I had to think much more about what I was spending as my income was very low. Maybe all those years helped train me. I seem pretty lavish compared to my parents - perhaps more on that in future posts.
PF bloggers seem to fall into several categories that might overlap:
1. Young people just starting out in the financial world and dreaming of getting rich.
2. People who used to spend beyond their means and regret it and now try to save and invest (I used to spend beyond my means but don't regret it).
3. People whose parents and family are "financially irresponsible" or had little money and didn't know anything about it and are now trying to live a prudent lifestyle themselves.
There don't seem to be many who come from very financially prudent families, got a good financial education, and are themselves a bit more relaxed (that's me).
Thursday, May 04, 2006
The Fed Isn't Printing Money
Despite the ravings of many goldbugs and other conspiracy theorists the Fed is not printing money. The chart of the M1 money supply has been flat for the past year. M1 money is the sum of bank notes, coins and checking deposits. It is in the direct control of the Fed. But that doesn't mean everything is just fine. If commodity prices are rising yet the money supply is not increasing to accommodate them we should get a recession instead of inflation. And that is my forecast which my investment strategy is based on. This morning I shorted more Starbucks - they release earnings tonight and the stock is looking very weak. Seems like there is little justification for the very high price/earnings ratio (around 50) of the stock given year on year earnings growth rates (around 10%). Yesterday I shorted more Apple Computer. That was a good move so far too. Each day we are seeing a pop-up in the markets in the morning and particularly in Google, only to see a sell-off in the afternoon. The myth is that morning price action reflects "dumb money" and afternoon price action "smart money". Could be some truth in that in recent days.
Wednesday, May 03, 2006
April Report
After a bit of a run around I bought a new firewire cable and got into the portable hard drive with my most uptodate accounts on it. Of course, I immediately backed up the disk. I use an Iomega hard drive which I switch between the various desktop and laptop computers I am use as my primary data store. The last cable only lasted 2 weeks! That cable was from our campus computer store where the same brand of cables are selling for less than half the price CompUSA are charging, but it's no good if they keep failing. Strange :o
Anyway, my investment performance for April was a 4.49% gain in US Dollar terms. All of it and more is due to the gain in the Australian Dollar. The core rate of return at constant exchange rates was negative. Net worth increased by $17452 to $312,069. Net worth in Australian Dollars declined. Expenditure for the month was $1925. It's all detailed in this spreadsheet:
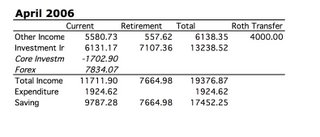
Investment return year todate is 7.45% and for the last 12 months 20.12%. The MSCI Gross World Index is up 3.09%, 10.01%, and 24.91% respectively. I am about a month ahead of my net worth goal for this point in the year.
Returns so far in May are already 2%.
Tuesday, May 02, 2006
Global Markets Update
Here is Bill Gross' latest commentary. The last days and weeks have seen rapid movements in exchange rates, interest rates, stock prices, commodity prices etc. Volatility is increasing. Having some computer problems and so haven't yet produced final April numbers. Yesterday, the first day of May, though, was extremely good for me, especially in the US Markets. Stocks fell sharply, especially after Maria Bartiromo said that Ben Bernanke had told her he was misunderstood. Didn't do any good for my bonds of course (and the US Dollar reversed course and went up - though it's down again this morning). In the morning I covered 20 shares of my GOOG position and then in the afternoon started a short position in AAPL. Google went under 400 - Apple fell too - but would have been better to keep all 120 shares short of GOOG I had in the morning! Am also short (and have puts on) QQQQ. So that helped too.
Subscribe to:
Posts (Atom)