Overview
The biggest development this year at Moomin Valley is that we set up the
SMSF. We also
finished investing the money we inherited in late 2018. I also
reviewed all our existing investments to decide which to drop. Investment returns were again very strong. We exceeded the net worth projection in
last year's report, which at the time I thought was crazy.
In my academic career, I didn't feel very productive. Mainly I worked on completing research projects started in previous years, though there was one project that started right at the end of last year that we have already submitted for publication. I was frustrated with online teaching in the first half of the year and then with the second lockdown in Canberra in the second half of the year. Luckily, we could send our younger child to daycare throughout the lockdown this time. The estimated value of our house rose sharply in line with market trends and we closed some of the lag to the general housing market that we have experienced since buying here. At the end of the year, we went for our first trip outside our local region since the pandemic started, to South Durras, NSW:
All $ signs in this report indicate Australian Dollars. I'll do a separate report on individual investments. I do a
report breaking down of spending after the end of the financial year.
Investment Returns
In Australian Dollar terms we gained 18.8% for the year and in USD terms we gained 11.7% because of the decline in the Australian Dollar over the year. The MSCI gained 19.0% in USD terms and the ASX 200 only 19.5% in AUD terms. The HFRI hedge fund index gained 12.4% in USD terms. Our target portfolio gained 17.4% in AUD terms. So, we only beat the target portfolio benchmark this year. This is expected in a strong bull market.
This chart compares our portfolio to the benchmarks in Australian Dollar terms over the year:
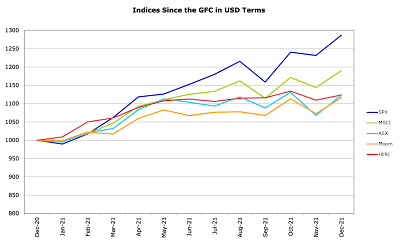
We tracked the target portfolio quite closely and ended the year with a similar return to the ASX 200 but less volatility. This is the goal of our investment strategy. We had no down months. The ASX tracked the MSCI till the middle of the year and then lagged. The S&P 500 was strong throughout. Here are the same indices in US Dollar terms with the target portfolio replaced by the HFRI hedge fund index:
The ASX 200, HFRI and to some degree MSCI, all stagnated in the second half of the year. I ended up with a similar performance as the median hedge fund, but with more volatility because of the translation into US Dollars. If we targeted low volatility of US Dollar returns we would need to short non-US Dollar currency, whereas going long foreign currency achieves low volatility for Australian Dollar investors. US based investors are, therefore, more likely to hedge out foreign currency exposure, while we seek it.
Here are annualized returns over various standard periods:
Both our returns and the benchmark returns have increased over time. We have a better performance than the ASX 200 over the last two years and similar over 5-10 years. We beat the HFRI over all the longer time horizons. We had a similar performance to the MSCI over the last two years, but much worse over longer horizons. Whether you think our performance is good or bad depends on what you think the default alternative investment is. If it is an ASX 200 index fund, then we are doing OK. If it is a global stock index fund then not so good. If you think it is our target portfolio (not in the table) then we are doing a bit better than that over 10 years and about the same over shorter horizons.
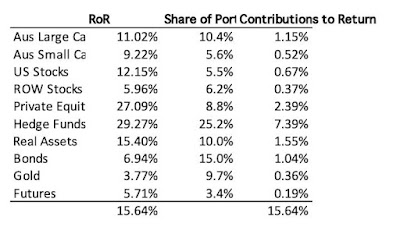
Here are the investment returns and contributions of each asset class in 2021:
The contributions to return sum to the total portfolio return in gross asset terms. These returns are currency neutral and because of leverage are lower than the returns reported above for net assets. The portfolio shares are at the beginning of the year. Hedge funds and private equity again had the highest returns. Hedge funds had by far the largest contribution to total return. Gold was the weakest performer. The rate of return on bonds was surprisingly good. Returns to long-only stocks were surprisingly poor compared to market indices.
Investment Allocation
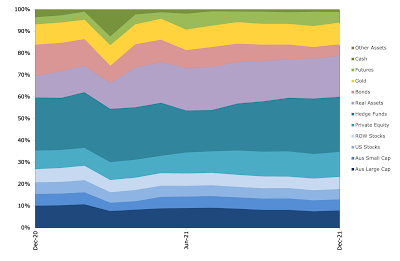
The main changes in allocation over the year were that we continued to reduce our bonds allocation while increasing real assets and private equity mostly:
The blip in the early part of the year is when we transferred funds from Colonial First State to the SMSF. The CFS funds were all converted to cash.
Accounts
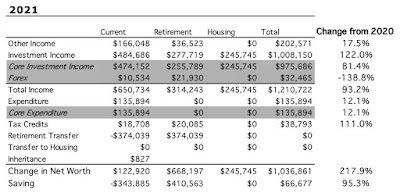
Here are our annual accounts in Australian Dollars:
Percentage changes are for the total numbers. There are lots of quirks in the way I compute the accounts, which have gradually evolved over time. There is an explanation at the end of this post.
We earned $166k after tax in salary, business
related refunds, medical payment refunds, tax refunds etc. This was up 17% on 2020 because Moominmama went back to work. We earned
(pre-tax including unrealized capital gains) $485k on non-retirement
account investments. A small amount of the gains were due to the fall in the Australian Dollar (forex). We gained $278k on retirement accounts with $37k in employer retirement contributions (more details below). The big difference to last year, is that instead of the value of our house falling, I estimate it rose by $246k. As a result, investment income totalled $1.008 million and total income $1.211 million.
Total spending (doesn't include mortgage payments) was up 12% on 2020, which saw a fall in spending. Combining the two years, spending is rising at 3% per year.
$19k of the current
pre-tax investment income was tax credits – we don't actually get that money so we need to deduct it to get to the change in net worth. We transferred $374k into retirement accounts (ultimately the SMSF) from existing savings.
The change in current net worth, was
therefore $1234k. Looking at just saving from non-investment income, we dissaved $344k. So, before the transfer to retirement accounts we saved about $31k (19%) from salaries etc.
We made $37k in pre-tax contributions to retirement accounts (after the 15% contribution tax) and made an estimated $278k in pre-tax returns. $20k in "tax credits" is an adjustment needed to get from the number I calculate as a pre-tax return to the after tax number. Taxes on returns are just estimated because apart from the SMSF all we get to see are the after tax returns. I do this exercise to make retirement and
non-retirement returns comparable. Net worth of retirement accounts increased by $668k.
Total net worth increased by $1.038 million, which was up 218% on last year.
$67k of this was from saving from non-investment sources, up 95% on last year. Thanks to employer superannuation contributions this was 33% of our total after tax non-investment income.
How Does This Compare to My Projection for This Year?
Last year my baseline projection for 2021 was for a very high 19% rate of return, a 6% increase in spending, and flat other income, leading to an $800k increase in net worth to around $5.7 million. This just seemed like too much to me so I also made a "more sensible projection" of an increase of $400k to around $5.3 million. Investment returns matched the baseline projections very closely. The additional gain in net worth is mainly due to the estimated increase in the value of our house. Using the same methodology, the baseline projection for 2022 is for a 16% rate of return, no increase in the value of our home, flat other income, and 6% growth in spending. This results in net worth increasing by $800k to around $6.7 million. Again, anything could happen.
Notes to the Accounts
Current account includes everything that is not related to retirement accounts and housing account income and spending. Then
the other two are fairly self-explanatory. However, property taxes etc. are included in the
current account. Since we notionally converted the mortgage to an investment loan, mortgage interest is counted in current investment costs. So, the only item in the housing account now is increases or decreases in the value of our house. This simplified the accounts a lot but I still keep a lot of cells in the spreadsheet that might again be used in the future.
Current other income is reported after
tax, while investment income is reported pre-tax. Net tax on investment
income then gets subtracted from current income as our annual tax refund
or extra payment gets included there. Retirement investment income gets
reported pre-tax too while retirement contributions are after tax. For
retirement accounts, "tax credits" is the imputed tax on investment
earnings which is used to compute pre-tax earnings from the actual
received amounts. For non-retirement accounts, "tax credits" are actual franking credits
received on Australian dividends and the tax withheld on foreign
investment income. Both of these are included in the pre-tax earning but
are not actually received month to month as cash....
For current accounts "core
expenditure" takes out business expenses that will be refunded by our
employers and some one-off expenditures. This year, there are
none of those one-off expenditures. "Saving" is the difference
between "other income" net of transfers to other columns and spending in
that column, while "change in net worth" also includes the investment
income.