We exceeded our optimistic forecast of reaching a net worth of AUD 1.7 million by the end of 2016. The optimistic forecast for 2017 is currently AUD 2 million. Coming soon: December accounts, 2016 accounts, and more detailed projections.
Friday, December 30, 2016
Saturday, December 03, 2016
November 2016 Report
Here are our monthly accounts (in AUD):
 Spending (not counting mortgage) was fairly typical at $6.3k. The biggest single expenditure was a $956 quarterly electricity bill. This covered part of the winter and with the baby we have been using much more heating - both reverse cycle air conditioning and conventional resistance heating. Our hot water and cooking are gas powered and so this bill was really large.
Salaries, tax refunds etc. added up to $19.7k (after tax). We both got three pay checks this month and Snork Maiden's pay went back up to the regular full time rate for some reason, even though she is not back at work yet. I also got a tax refund of $990.
After taking into account the mortgage payment of $3.7k (which includes implicit interest saving due to our offset account - the actual mortgage payment was about $500 less than this) - which shows up as a transfer to the housing account, we saved $9.7k on the current account. We made $3.6k of retirement contributions, and saved a net $1.7k in added housing equity. Net saving was, therefore, $15k across the board, which is very high by recent standards.
The Australian Dollar fell from USD 0.7613 to USD 0.7386. The ASX 200 gained 2.99%, the MSCI World Index gained 0.81%, and the S&P 500 3.70%. We gained 2.24% in Australian Dollar terms and lost 0.80% in US Dollar terms. So, we underperformed both the Australian market and the international markets. The best performer in dollar terms was the CFS Geared Share Fund, which gained $18.4k followed by Platinum Capital and related funds, which gained $3.3k. The worst performing investment was Oceania Capital Partners, down $3.8k after the big gains last month. U.S. stocks were the best performing asset class in percentage terms with a 2.88% gain, while the worst performing was private equity, losing 3.56%. Australian small cap stocks also performed poorly losing 2.50%. That's not a good sign of the sustainability of stock market performance going forward.
As a result of all this, net worth rose AUD 42k to $1.646 million (a new high) or fell USD 5.4k to $US 1.216 million.
Saturday, November 05, 2016
October 2016 Report
A down month in the financial markets and a very high spending month for us. Here are our monthly accounts (in AUD):


The Australian Dollar fell slightly from USD 0.7665 to USD 0.7613. The ASX 200 fell 2.15%, the MSCI World Index fell 1.67%, and the S&P 500 fell 1.82%. We lost 1.22% in Australian Dollar terms and 0.27% in US Dollar terms. So, unusually, we outperformed both the Australian market and the international markets. The reason for this was largely the big gains we had in Oceania Capital Partners, which gained $8.7k. The worst performer in dollar terms was the CFS Geared Share Fund, which lost $15.5k. The best performing asset class in percentage terms was, of course, private equity, which gained 10.96% and the worst commodities, which lost 2.83%.
As a result of all this, net worth fell AUD 12k to $1.604 million or fell USD 17k to $US 1.221 million.
Saturday, October 08, 2016
Moominmama's Taxes 2015-16 Edition
I've filed Moominmama's (formerly Snork Maiden) tax return for this tax year. The tax year runs from 1st July to 30th June in Australia. The figures ignore employer and employee contributions to
superannuation (retirement account) which amount to a lot of extra
income. Everything is in Australian Dollars of course.

Her salary is down because she went on maternity leave and the average tax rate also falls as a result. Investment income is up though.
Here are the reports on Snork Maiden's taxes for all previous years:
2014-15
2013-14
2012-13
2012-13
2011-12
2010-11
2009-10
2008-9
2007-8

Her salary is down because she went on maternity leave and the average tax rate also falls as a result. Investment income is up though.
Here are the reports on Snork Maiden's taxes for all previous years:
2014-15
2013-14
2012-13
2012-13
2011-12
2010-11
2009-10
2008-9
2007-8
Moominpapa's Taxes 2015-16 Edition
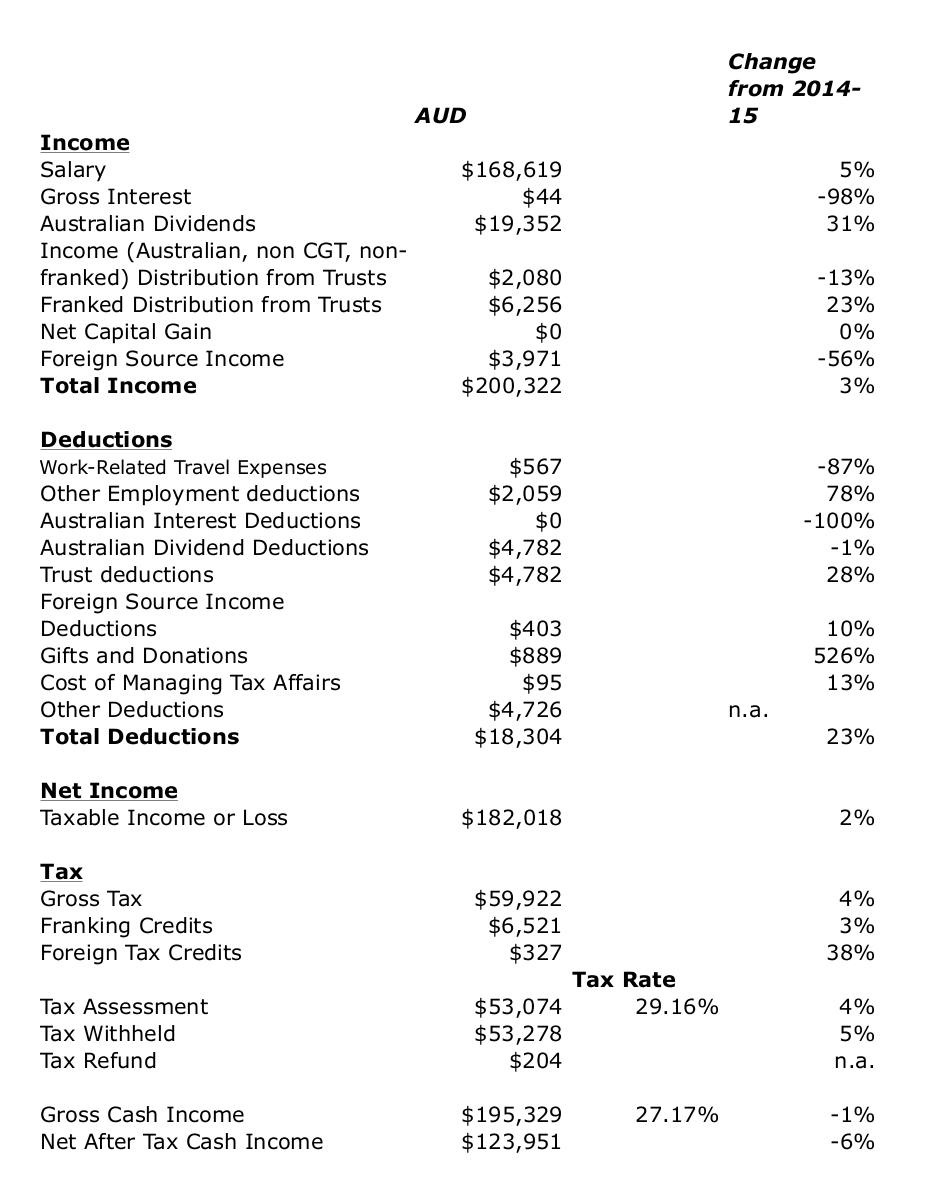
I have now completed my tax return. Looks like I should get a $204 refund. My taxable income is up by 2%. But my tax is up 4% despite a 23% increase in deductions and increases in tax credits. I'm a bit puzzled by that but I did move into the top tax bracket. Gross cash income is before tax income ignoring franking and other tax credits and adding in net undiscounted capital gains (not deleting losses from previous years).
This was the first year I checked what information the government knows about my tax affairs as revealed by the prefilled information on my tax return. They are missing a lot of information on my Australian accounts and none on my foreign holdings. Strangely they have dividends for some shares I have with a broker and don't have information on dividends from other companies that I hold through the same broker. Also they have one managed fund account but not the other I hold with the same firm. If I filed a return based on the numbers they know but taking the deductions I could document my return would look so radically different to last year that I think it would raise a lot red flags. But I didn't want to give the government any more information than they have, so I again filed a paper return. I filed Moominmama's return online for the first time, using the prefilled numbers plus deductions.
Previous years' reports:
2014-15
2013-14
2012-13
2011-12
2010-11
2009-10
2008-9
2007-8
P.S. 9 November
I got a more than $900 refund. Don't know what I got wrong in my calculations, but I'm not complaining :)
Wednesday, October 05, 2016
September 2016 Report
This was an uneventful month in the financial markets. Most notable thing was in our local housing market. A strong auction of a house in our development caused me to increase the carrying valuation of our house. Here are our monthly accounts (in AUD):

The Australian Dollar rose from USD 0.7520 to USD 0.7665. The ASX 200 fell 0.48%, the MSCI World Index rose 0.66%, and the S&P 500 rose 0.02%. We lost 0.15% in Australian Dollar terms and gained 1.78% in US Dollar terms. So we underperformed the Australian market and outperformed the international markets.
The best performing investments (in total dollars not RoR) were Oceania Capital Partners and Platinum Capital, which both gained $2.1k. The worst performer was the Unisuper superannuation fund, losing $1.6k. The best performing asset class was private equity, which gained 2.79% and the worst commodities, which lost 0.82%.
As a result of all this, net worth rose AUD 23k to $1.617 million or rose USD 41k to $US 1.240 million.
Saturday, September 10, 2016
Local Auction
There was an auction today of another free-standing house in our complex. Smaller and without a view but it is at the end of the row, so not as hemmed in by neighbors as many of the houses are here. This time there was bidding interest. The house sold at $A600k with three active bidders. The original price in 2008 was $A459k. That is a 30% uplift. Our house cost $A650k in 2008 and we bought for $A740k at the end of 2014, a 13% uplift. Of freestanding houses in the complex bought since the beginning of 2014, which have sensible prices in the database (i.e. not zero or something else low), we paid the lowest uplift. However, the uplift is very strongly negatively correlated with the original sale price. Based on a regression of uplift on original price for all houses sold excluding ours in that period, the uplift on ours should have been 20%. Date of sale is not statistically significant. So, I'll rerate the carrying value of our house up to $A780k.
Friday, September 02, 2016
August 2016 Report
Here are our monthly accounts (in AUD):

Spending (not counting mortgage) was low at $4.5k. Again, no large and exceptional purchases this month. Salaries etc. added up to $10.6k. After taking into account the mortgage payment of $3.7k (which includes implicit interest saving due to our offset account - the actual mortgage payment was about $500 less than this) - which shows up as a transfer to the housing account, we saved $2.4k on the current account. We made $3.6k of retirement contributions , and saved a net $1.6k in added housing equity. Net saving was, therefore, $7.7k across the board.
The Australian Dollar was fairly stable falling from USD 0.7598 to USD 0.7520. The ASX 200 fell 1.55%, the MSCI World Index rose 0.39%, and the S&P 500 rose 0.14%. We lost 1.25% in Australian Dollar terms and 2.26% in US Dollar terms. So we outperformed the Australian market and underperformed the international markets.
The best performing investment (in total dollars not RoR) was the PSSAP superannuation fund, which gained $1.9k followed by Oceania Capital Partners, which gained $1.5k. The worst performer was the CFS Geared Share Fund, losing $17.3k followed by Platinum Capital, losing $4.3k. The best performing asset class was AUstralian small caps, which gained 2.64% and the worst hedge funds, which lost 2.79%.
As a result of all this, net worth fell AUD 8k to $1.592 million or fell USD 19k to $US 1.197 million.
Thursday, August 04, 2016
July 2016 Report
This was a good month all round - both strong investment performance and moderate spending. Here are our monthly accounts (in AUD):

Spending (not counting mortgage) was low at $4.6k. No large and exceptional purchases this month. Salaries etc. added up to $10.4k. Snork Maiden is again earning money - this are payments at the minimum wage she is receiving from the government through her employer while on maternity leave. I think there about 3 months of those. We decided to receive those now in the new financial year to minimize her taxes by spreading her maternity pay over two financial years.
After taking into account the mortgage payment of $3.6k - there were three mortgage payments this month (and which includes implicit interest saving due to our offset account - the actual mortgage payment was about $420 less than this) - which shows up as a transfer to the housing account, we saved $2.2k on the current account. We made $3.1k of retirement contributions , and saved a net $1.6k in added housing equity. Net saving was, therefore, $6.9k across the board.
The Australian Dollar rose from USD 0.7433 to USD 0.7598. The ASX 200 rose 6.29%, the MSCI World Index 4.34%, and the S&P 500 rose 3.69%. We gained 5.27% in Australian Dollar terms and 7.61% in US Dollar terms. So we underperformed the Australian market and outperformed the international markets. The best performing investment (in total dollars not RoR) was, not surprisingly, the Colonial First State Geared Share Fund, which gained $34k. Unisuper and PSSAP gained $9k and $7k, respectively. There were lots of other strong performers. IPE,AX was the worst performer losing $750. All asset classes gained, with Australian Small Caps the best at 6.54%.
As a result of all this, net worth rose AUD 72k to $1.600 million or rose USD 80k to $US 1.216 million.
Colonial First State closed new applications to their retail First Choice Investments platform. This made me realise that the minimum investment for the wholesale version of this platform is now only $5,000. I had thought it would be $100k per fund or something like that. Management fees are lower for the wholesale platform. As a result it absolutely makes sense to move my CFS superannuation account to this platform. Probably, moving our managed (mutual) funds will result in capital gains tax bills. As I mentioned last month, I have a large carried over capital loss, of more than $60k. I estimate that moving all my managed funds will result in a capital gain of $50k. So, I would still have a capital loss carryover. Yes, this has an opportunity cost as it brings nearer the day that I would have to pay capital gains tax. The actual bill would be $12k. The value of funds is $222k. It would, therefore, take around 8 years to pay off in terms of lower management fees. But I figure that if I keep the funds "forever" it is worth it and if I sell at some point in the nearer future I will have to pay CGT anyway. Also, if Labor get into government next time, they are likely to raise the capital gains tax rate.
For Moominmama (formerly Snork Maiden), the number of years to pay off the tax hit is shorter and this year her tax rate (due to maternity leave) will be lower than other years. So, that's a no brainer.
Just need to find time to meet with someone at the bank and discuss all the details. Probably will wait a couple of months as workwise this is a crunch time in the next couple of months.
Monday, August 01, 2016
Is John Mauldin Saying He Isn't an Accredited Investor?
John Mauldin writes a newsletter Thoughts from the Frontline. In the latest issue he suggests that his net worth is only 1/2 million dollars - the average net worth of him and Bill Gates would be $40 billion but his net worth has 5 less zeros... He is 67 years old. He also markets hedge funds. Apparently, he wouldn't be able to invest in them himself. Or maybe he got the number of zeros wrong.
Sunday, July 31, 2016
2015-16 Financial Year Return
Clime report that the average Australian balanced fund returned 2.5% for 2015-16. They argue that this was achieved largely from bonds. We returned 3.18% with an equity tilted portfolio...
Monday, July 25, 2016
Sold Out of Aurora

I finally sold out of Aurora Dividend Income Trust (22,389 shares). It hasn't been performing that well and the news around the management of the company doesn't sound good. I made a total of $1,385 profit since first buying into the fund in 2009, which is about half of the amount of the franking credits the holding has generated ($2,588). That together with all the cash distributions they paid out means I can book a $6,371 capital gains loss on closing the position. I gained a total 23% return on this investment, which is 3% a year. However, returns have been zero since I doubled the size of my position in 2013. I like franking credits, but I think there are better ways to earn them. I bought 9,719 shares of Platinum Capital instead. It's returned an average 9.2% p.a. over the same period. It's also marginable.
Monday, July 18, 2016
Investment Tax Credits
Revanche provides info on her progress in increasing dividend flow from stocks. I can't actually give you that exact information unless I ignored the dividend component of pay outs from managed (mutual) funds, because I haven't kept an exact record of that breakdown, as it isn't needed for tax purposes and doesn't help much for investment management purposes. What I do track is the tax credits associated with dividends. This is a particularly Australian phenomenon. Companies can pass on credit to shareholders for the Australian company tax they paid. These are called "imputation credits" or "franking credits". We can also claim a tax credit for foreign tax withheld on dividends etc. I call the total "investment tax credits". And this is what it has done since the 1997-98 tax year:

There was a big fall off during the Global Financial Crisis, but since then we have seen a steep rise. This year we reached just under AUD 9,000. These credits reduce our tax bill dollar for dollar. We are going to need to multiply this by nine though to wipe out our current tax bill :) It's at about AUD 79k before credits. The yield of tax credits is 1% of the liquid non-retirement assets we have. So, they'd have to reach AUD 8 million to eliminate our current tax bill. That's not going to happen, unfortunately.

Tuesday, July 12, 2016
Mid-year Forecast Update
At the beginning of the year I forecast that the best case scenario would see net worth rise to AUD 1.7 million or USD 1.2 million by the end of the year. At this point in the year the best case scenario is tracking at AUD 1.67 million and USD 1.25 million. This is because the Australian Dollar is looking more robust than it did and so I think the best case is that it ends the year at 75 US cents rather than 70. YTD we have only seen a 0.42% investment return (2.59% in USD terms), so we are tracking a bit below the most optimistic forecast from the beginning of the year.
I'm gradually putting together our tax returns as information comes in from fund managers etc. Moominmama should get a $2,700 or so refund at this point. I'm at around a few hundred dollars refund, which is likely to go negative as more info comes in.
I'm gradually putting together our tax returns as information comes in from fund managers etc. Moominmama should get a $2,700 or so refund at this point. I'm at around a few hundred dollars refund, which is likely to go negative as more info comes in.
Sunday, July 03, 2016
June 2016 Report
After hitting a new net worth high in Australian Dollar terms last month, net worth fell back a bit in this month's market turmoil. Here are our monthly accounts (in AUD):

Spending was very high at $12k but one of the two computers I bought was reimbursed by my employer, which is one reason why current other income (salary, refunds etc.) is also higher than in recent months. The other reason is that there were three biweekly salary payments this month. There was also an accident with a computer that required an expensive repair and Snork Maiden bought a treadmill. Minus the reimbursed expense, spending was $8.7k. Minus the other items I just mentioned it would have been $4.8k, which is in line with our typical spending.
After taking into account the mortgage payment of $5,188 - there were three mortgage payments this month (and which includes implicit interest saving due to our offset account - the actual mortgage payment was about $420 less than this) - which shows up as a transfer to the housing account, we dissaved $1.2k on the current account. We made $4.1k of retirement contributions (again three payments this month), and saved a net $3.0k in added housing equity. Net saving was, therefore, $5.8k across the board.
The Australian Dollar rose from USD 0.7241 to USD 0.7433. The ASX 200 fell 2.45%, the MSCI World Index 0.55%, and the S&P 500 rose 0.26%. We lost 3.30% in Australian Dollar terms and -0.74% in US Dollar terms. So we underperformed both Australian and international markets. The best performing investment (in total dollars not RoR) was Winton Global Alpha Fund with a gain of $2.5k. Not surprisingly, the worst performer was the Colonial First State Geared Share Fund, which lost $25k. All asset classes apart from commodities and real estate lost this month.
As a result of all this, net worth fell AUD 36k to $1.529 million but rose USD 3k to $US 1.136 million.
Two investments ended their life in the last couple of months. Legend International declared bankruptcy in May and the Everest Direct Investments Fund made its final distribution in June. The carrying value of each investment was less than $100 and so there isn't much impact on this month's accounts. But this means I can write off the losses on these investments in this year's taxes. The loss on Legend was almost USD 4,000. On EDIF about AUD 1,000. As I have a large carried over capital loss, of more than AUD 60k, the net effect will be to make the accumulated capital loss decline a little less. I think it still will be many years until I pay any capital gains tax.
Wednesday, June 01, 2016
May 2016 Report
This month we hit a new net worth high in Australian Dollar terms of of $1.565 million up $67k on last month. The previous high was in July 2015. Before the new house, the baby, and the negative performance that financial markets have had in the last year. This graph clearly shows the flat period we've been in since February 2015 and the clear break upwards this month:
 It also shows that retirement accounts contributed most to the gain. Even though Moominmama is no longer getting a salary her employer is making superannuation contributions. So that together with my super contributions and fund earnings all help. This month, as is often the case, the rate of return on our retirement accounts outstripped that on our non-retirement accounts. Stockmarkets did well this month and the US dollar rose strongly improving our Australian Dollar returns but damping returns in USD terms. In US Dollars net worth was $US 1.133 million, down $US 7k.
Here are our monthly accounts (in AUD):

Spending (not including the mortgage) was $4.9k, which almost the same as last month. We are now down to only my salary and so "current other income" came in at $8.6k. After taking into account the mortgage payment of $3,572 (which includes implicit interest saving due to our offset account - the actual mortgage payment was about $400 less than this), which shows up as a transfer to the housing account, we saved only $63 on the current account. We made $3.1k of retirement contributions, and saved a net $1.3k in added housing equity. Net saving was, therefore, $4.5k across the board. I increased the value of our house by $1k to $756k after a house in our development was listed for sale at $820k. The new value is based on the uplift that represents in percentage terms from the prices when the houses were new. There was an auction, which I attended, but no-one registered to bid, which is something I hadn't seen before. I don't know if I should be worried about that or it was just a random event.
The ASX 200 rose 3.09%, the MSCI World Index 0.21%, and the S&P 500 1.80%. The Australian Dollar fell from $US0.7616 to $US.0.7246 We gained 5.10% in Australian Dollar terms and -0.01% in US Dollar terms. So we out-performed Australian markets and underperformed international markets. The best performing investment (in total dollars not RoR) was again the Colonial First State Geared Share Fund, which gained $27.4k, followed by Oceania Capital Partners with $6.8k, Unisuper with $6.5k, and PSSAP with $5k. OCP's share price rose steeply following the buyout of Hosken Investments' interest by Hosken CEO Johnny Copelyn. The worst performing investment was Platinum Capital, which lost $0.8k. All asset classes apart from commodities gained this month with private equity and then U.S. stocks being the best performers.
The following investments are at all time profit highs for us: Unisuper, PSSAP, CFS Diversified Fund, IPE, TIAA Real Estate, BT Property Investments, Medibank, CFS Global Shares, Generation Global Shares, and 3i. In other words: Diversified funds, property, private equity, and non-US international shares are all doing very well.
Wednesday, May 04, 2016
April 2016 Report
Spending was a bit lower this month, financial markets had moderately positive performance, but our salary income has now gone down as Moominmama's maternity leave salary has now ended. In the new financial year she will get another 18 weeks of payments from the government at the minimum wage ($30k something per year). We asked for those to happen next financial year to reduce tax.
Here are our monthly accounts (in AUD):

Spending was $4.7k. The biggest single expenditure was the $639 quarterly body corporate (condo association) fee and after that health insurance of $340.
Moominmama actually got one last partial biweekly salary payment this month, so "current other income" came in at $10.3k and will fall further next month . After taking into account the mortgage payment of $3,567 (which includes implicit interest saving due to our offset account - the actual mortgage payment was about $400 less than this), which shows up as a transfer to the housing account, we saved $2.0k on the current account. We made $3.5k of retirement contributions, and saved a net $1.3k in added housing equity. Net saving was, therefore, $6.8k across the board.
The ASX 200 rose 3.37%, the MSCI World Index 1.54%, and the S&P 500 0.39%. The Australian Dollar fell from $US0.7676 to $US0.7616. We gained 1.96% in Australian Dollar terms and 1.09% in US Dollar terms. So we under-performed both Australian and international markets. The best performing investment (in total dollars not RoR) was again the Colonial First State Geared Share Fund, which gained $6.8k, followed by CFS Global Resources with $3.7k, and Unisuper with $3.5k.The worst performing investment was Cadence Capital, which lost $2.4k. All asset classes apart from hedge funds and commodities gained this month with U.S. stocks and then private equity being the best performers.
As a result of all this, net worth rose $29k including housing equity ($US13k) to $1.499 million ($US1.141 million).
Australian Federal Budget 2016
 The budget released yesterday actually turned out pretty well for me despite some of the leaked stories. In the end the income level at which the 30% superannuation contributions tax start was lowered from $300,000 to $250,000 rather than $180,000 and the cap on concessional (pre-tax) contributions for people over 50 will stay at $35,000 per year. The cap for under 50s is reduced from $30k to $25k. The biggest changes are a lifetime cap on non-concessional (post-tax) contributions of $500k rather than $180k per year. I might just contribute $500k just before retiring, but it's not going to change my plans. Also there is a $1.6 million cap on how much you can transfer into a tax free account after you retire from an accumulation fund. This number seems to be designed to be equal to roughly the maximum contributions allowed under the new rules over a lifetime. Effectively earnings in retirement on earnings in the accumulation phase above the rate of inflation would be taxed.... Currently, I have $385k in Australian super. If I work to age 65 and continue my current rate of contribution I would add $450k in concessional contributions. So, I could certainly add the $500k just before retiring, as long as investment returns are not too spectacular in the interim.
Other news in the budget is that the 37% tax bracket threshold will be raised to $87k p.a. instead of $80k. That would reduced my tax by $315. So, all in all, it was an OK budget.
P.S.
Now I just read that the concessional cap has been lowered to $25k for everyone, regardless of age. So, what I read yesterday was wrong. But this is from 1 July 2017. So, in the next tax year I can keep my current contributions rate and then after that I will have to cut them and I will have a $3,000 tax hike. Of course, if Labor come to power at the election on 2 July this year that might not happen...
There are a lot of changes, which mostly make super more complicated.
Thursday, April 21, 2016
Entering the Top Tax Bracket
Only 3% of Australian taxpayers are in the top tax bracket, which starts at $180,000 a year and has a marginal tax rate currently of 49%. And now I'm one of them, I think. IPE just declared a 5.75 cents a share dividend payable next month. I have 100,000 shares and so the dividend is $5,750. And it is a totally unfranked dividend. After this, I'm currently estimating my taxable income for the year at $182k and I'm now expecting to pay $3,000 extra tax at tax time. That also means I'm going to have to pay quarterly tax from now on.
I guess this is a good problem to have, but it feels kind of absurd that I'm now in the top tax bracket. Of course, when I first moved to Australia I wasn't that far from it because it kicked in at $50,000 a year in those days (1996) and my salary was a little higher than that. After "voluntary" super contributions of 7% and some deductions I was out of the zone.
Moominmama's reaction was that I should generate some business expenses to pull my income down. I could buy a nice big computer screen for home use, which I couldn't charge to my employer. It will be half price now I'm in the top tax bracket. I'm already almost maxing out my pre-tax super contributions. But spending money on stuff just to reduce tax is silly.
Wednesday, April 20, 2016
Superannuation Reform Again?
Changes to superannuation are a perennial topic. If the government does this - lower the threshold for the 30% super contributions tax to $180k income per year and cut the concessional cap to $20k p.a. - I figure I will have to pay almost $7,000 a year more in tax. My taxable income this year looks like being just below $180k but the threshold for the super surcharge adds things like employer super contributions and investment losses to the taxable income amount. It would make most sense to cut the non-concessional cap, which is currently $180k per year, dramatically, as that is the way that wealthy people can get really large amounts of money into the super system, which will be taxed at a zero rate once they retire. But, of course, there is no immediate revenue to be gained by cutting the non-concessional cap. To simplify the system the government could just get rid of the concessional/non-concessional distinction, stop taxing earnings and then have a simple US Roth style system. Much too logical, of course. Actually, the optimal solution, assuming that super will be taxed in some way is to go for the US 401(k)/403(b) approach where there is no tax on contributions or earnings and regular tax on payouts. This gives the the money the best opportunity to increase in value... well under some economic assumptions anyway.
Sunday, April 03, 2016
March 2016 Report
Low spending didn't continue into this month... Moominmama (formerly Snork Maiden) is out and about and Moomintroll is in tow. We went to Ikea and spent more than $2,000. Before that, it was a low spending month. Even though everything seems to be cheap in Ikea, it somehow adds up into big numbers :) Costco is also like that and just across the road from Ikea. Yes, we went there too.
Here are our monthly accounts (in AUD):

So, spending was $6,355. The biggest single expenditure was $2,281 at Ikea. Doctors' fees totaled $1245, but we got a total refund from Medicare of $655. The latter is counted as income. Health insurance is $308 a month, BTW. The Australian health care system is a strange mix of public and private care and payments...
We earned $14.2k in salary and other current payments including those Medicare refunds. After taking into account the mortgage payment of $3,541, which shows up as a transfer to the housing account, we saved $4.3k on the current account. We made $3.6k of retirement contributions, and saved a net $1.4k in added housing equity. Net saving was, therefore, $9.3k across the board.
Stock markets rose strongly this month. The ASX 200 rose 4.73%, the MSCI World Index 7.48%, and the S&P 500 6.78%. The Australian Dollar rose from $US0.7152 to $US0.7676. We gained 2.46% in Australian Dollar terms and 9.96% in US Dollar terms. So we under-performed the Australian market and outperformed international markets. The best performing investment (in total dollars not RoR) was the Colonial First State Geared Share Fund, which gained $25.8k, followed by Unisuper with $3.2k, and Medibank with $2.8k. I sold my Medibank holding during the month, but Moominmama is keeping hers. The worst performing investment was the Winton Global Alpha fund losing $3.2k. All asset classes apart from commodities gained this month with Australian and U.S. stocks leading the way.
As a result of all this, net worth rose $37k including housing equity ($US103k) to $1.470 million ($US1.128 million).
Wednesday, March 02, 2016
February 2016 Report
Yes, little Moomin arrived this month and we are now officially Moominpapa, Moominmama, and little Moomintroll. As a result, this turned out to be a fairly low spending month as much of the ante-natal spending came to a halt. Moomintroll is a very big baby (something like the 99th percentile) with a big head (he is a Moomin after all :)). As a result they needed to do a Caesarian operation to get him out of Moominmama. As she needs to recover, I've taken extra time off work (beyond the 2 weeks paternity leave we get officially) to help her.
Here are our monthly accounts (in AUD):

Spending was $5,191. The biggest single expenditure was $1,105 for annual car registration, which includes third party insurance.
We earned $13.8k in salary and other current payments. After taking into account the mortgage payment of $3,550, which shows up as a transfer to the housing account, we saved $5.1k on the current account. We made $3.5k of retirement contributions, and saved a net $1.3k in added housing equity. Net saving was, therefore, $9.9k across the board.
Stock markets fell moderately this month. The ASX 200 fell 1.76%, the MSCI World Index fell 0.63%, and the S&P 500 fell 0.13%. The Australian Dollar rose from $US0.7070 to $US0.7152. We lost 2.47% in Australian Dollar terms and 1.34% in US Dollar terms. So we under-performed both Australian and international markets. The best performing investment was, unexpectedly, the Colonial First State Global Resources Fund, which gained $2,057, followed by the Winton Global Alpha fund gaining $1.5k. Commodities was the asset class with the best returns this month, followed by real estate, and then U.S. stocks. All other asset classes lost money.
As a result of all this, net worth fell $19k including housing equity (-$US2k) to $1.433 million ($US1.025 million).
Wednesday, February 03, 2016
January 2016 Report
Here are our monthly accounts (in AUD):

Spending was down but still quite high at $7,770. The biggest single expenditure was an $1,898 payment to the obstetrician.
We earned $15.0k in salary and other current payments. After taking into account the mortgage payment of $3,570, which shows up as a transfer to the housing account, we saved $3.7k on the current account. We made $3.6k of retirement contributions, and saved a net $1.3k in added housing equity. Net saving was, therefore, $8.6k across the board.
Stock markets fell sharply this month. The ASX 200 fell 5.48%, the MSCI World Index fell 6.01%, but the S&P 500 fell 4.96%. The Australian Dollar fell to $US0.7070 from $US0.7285. We lost 4.43% in Australian Dollar terms and 7.25% in US Dollar terms. So we outperformed the Australian market and underperformed international markets, which is a common theme recently. The best performing investment was the Winton Global Alpha fund gaining $3.4k. Medibank gained $2.5k. The only asset class with positive returns this month was, not surprisingly, commodities.
As a result of all this, net worth fell $45k including housing equity (-$US64k) to $1.452 million ($US1.027 million).
Tuesday, January 12, 2016
Annual Report 2015: Graphs
So here is how the last year looks on a graph in the context of everything since 1996:
 The blue line is the sum of the other three. Medium term balance is liquid assets. We reduced these near the beginning of the year when we bought the house and the housing equity line takes off. Then mid-year I lowered the carrying value of our house in line with the local market. After buying the house, liquid assets have been pretty much flat as saving has been low and the financial markets performing weakly. The green line - retirement accounts - was also flat in this period. The net result is that we pretty much went sideways on the blue line too since early in the year.
This marks a clear break from the steep upward trajectory we've been on since late 2011. I got my current job in mid-2011 and then the financial markets performed quite well. At that point our spending wasn't that high yet.
 This graph provides a slightly different view, breaking things down according to savings and profits. I don't break down housing equity into the two components as it's not worth it yet... You can see here that current savings (blue line) have been pretty anemic since buying the house, though retirement contributions continue on their merry way. Profits have been flat on both retirement and current accounts. In the long run we have done much better with retirement than with current accounts.
The next graph shows actual monthly non-retirement savings since 1996 and a 12 month moving average:
I have truncated the axis at -$15k but we dissaved $53k in January and $118k in February as we bought the house. As you can see, monthly savings peaked at an average of $10k per month in 2012-13. From March to December this year we only averaged $1,700 per month. I hope saving will be higher than that this year, but it's not going to return to its previous level. First, we are paying off our mortgage, which doesn't count as current saving and, second, Snork Maiden will be on maternity leave. She will get her regular salary till 8 weeks after the expected birth date. Later she will receive the minimum wage for 18 weeks and otherwise not receive anything. I think other baby expenses will be like a "rounding error" by comparison.
What about investment performance? This graph compares our "accumulation index" or "total return index" to the market indices since the depths of the financial crisis stock market crash in March 2009:
 As you can see, our performance is very closely linked to the Australian stock market. For a few years we lagged behind the market, but more recently we have outperformed it and now have about the same gain as the ASX 200 since the GFC. In the meanwhile, international markets have performed more strongly, at least until the last few months.

This marks a clear break from the steep upward trajectory we've been on since late 2011. I got my current job in mid-2011 and then the financial markets performed quite well. At that point our spending wasn't that high yet.

The next graph shows actual monthly non-retirement savings since 1996 and a 12 month moving average:
I have truncated the axis at -$15k but we dissaved $53k in January and $118k in February as we bought the house. As you can see, monthly savings peaked at an average of $10k per month in 2012-13. From March to December this year we only averaged $1,700 per month. I hope saving will be higher than that this year, but it's not going to return to its previous level. First, we are paying off our mortgage, which doesn't count as current saving and, second, Snork Maiden will be on maternity leave. She will get her regular salary till 8 weeks after the expected birth date. Later she will receive the minimum wage for 18 weeks and otherwise not receive anything. I think other baby expenses will be like a "rounding error" by comparison.
What about investment performance? This graph compares our "accumulation index" or "total return index" to the market indices since the depths of the financial crisis stock market crash in March 2009:

Monday, January 11, 2016
2015 Accounts: US Dollar Edition

- Smaller numbers for earning and spending due to the difference in value of the two currencies.
- Negative investment income of -$US 32k due to foreign exchange loss of -$US 98k.
- As a result almost flat net worth for the year.
Sunday, January 10, 2016
2015 Annual Accounts

We earned $197k after tax in salary, business related refunds, medical payment refunds, tax refunds etc. We earned (including unrealised capital gains) $37k on non-retirement account investments. $10k of the latter was just due to the fall in the Australian Dollar. The investment number is pre-tax. Total after tax income was $233k. We spent $151k but only $92k of that was "core spending". So, I always regard business expenses that are refunded as non-core, but also some one-off things. The biggest of these was stamp duty for buying our house of $27.8k and then $13.5k of gardening. So, that is 2/3 of the non-core expenditure. Then there were moving and settlement costs.
$7.5k of the investment income was tax credits. These increased our after tax "other income" but are also counted as part of the pre-tax investment income. So, they have to deducted to get things to add up tot he change in net worth. Then there was $1k of excess contributions I made to superannuation (not by choice) that had to be withdrawn... Finally, we transferred $194k in down-payment, mortgage payments, and some building work to the housing account. The change in current net worth, was therefore -$119k. Looking at just saving from non-investment income, we saved $148k.
The retirement account is a bit simpler. We made $41k in after tax contributions and the value rose by an estimated additional $67k in pre tax returns. $7k was the estimated tax on that and so the increase in net worth was $100k. Taxes are just estimated because all we get to see is the after tax returns.
Finally the housing account. We spent $19.5k on mostly mortgage interest. We saved about $4k in mortgage interest by keeping money in our offset account. Actually that $4k was part of our "current investment return". So we have to deduct the notional spending here to balance the books. I estimate our house is worth $10k more than we paid for it based on a recent sale in our neighbourhood. So that is an investment gain. We transferred the $194k into our housing account. So housing equity rose $181k with $171k of it being transfer of savings from our current account.
In total, net worth rose $163k, of which $63k was savings from retirement contributions and saving from current earnings.
Tuesday, January 05, 2016
2015 Outcome and 2016 Forecast
Last year I forecast
that net worth would optimistically reach $A1.65 million and
pessimistically fall to $A1.15 million by the end of 2015. The US Dollar range
was $US1.33 million to $US800k. The result for this year turned
out at $A1.50 million (USD 1.09 million). We were in the upper part of the range for both currencies though we were flat in US Dollar terms.
The Australian stockmarket didn't perform that well again, the Australian Dollar fell to 73 US Cents and we spent an even higher amount including moving house and preparing for a baby. Therefore, the result was below the most optimistic projection. I'm actually surprised how well we did do given all that!
So, now is time to forecast for 2016. The optimistic projection is $A1.7 million or USD 1.2 million assuming the Australian Dollar only declines to 70 US Cents. This assumes that Snork Maiden doesn't return to work till 2017.
The most pessimistic scenario is that the stock market falls by 20%, the value of our house falls to $A700k, and the Australian Dollar falls to 60 US cents. In that case, I estimate our net worth would be $A1.25 million or USD 750k.
December 2015 Monthly Report
Here are our monthly accounts (in AUD):

We spent even more money than last month - $21k in total. And this doesn't include our mortgage or amounts I have accounted as investment in our property which totaled another $7.8k (see "transfer to housing". $13.5k of the spending was on gardening, which, fairly arbitrarily, I deemed didn't improve the value of our property and so was accounted for as spending. So, core, non-mortgage spending not counting this once-off number was $7.6k.
We earned $25.3k in salary and other current payments, which was high this month as it was a three paycheck month and I received a big business travel refund for travel I made several months ago. Because of the large transfer to the housing account we dissaved $3.7k on the current account. We made $4.2k of retirement contributions, and saved a net $5.7k in added housing equity. Net saving was, therefore, $6.2k across the board.
Stock markets were more volatile this month. The ASX 200 rose 2.73%, the MSCI World Index fell 1.76%, but the S&P 500 fell 1.58%. The Australian Dollar rose to $US0.7285 from $US0.7233. We gained 1.55% in Australian Dollar terms and 2.28% in US Dollar terms. So we underperformed the Australian market and outperformed international markets strongly. The best performing investment was the CFS Geared Share Fund, which gained $26.8k. Nothing else came close. Commodities did not do well with the Winton Global Alpha fund losing $1.2k.
As a result of all this, net worth rose $A24k including housing equity (+$US25k) to $1.498 million ($US1.092 million).
An annual report is coming soon.
Subscribe to:
Posts (Atom)