Wednesday, October 24, 2018
Hearts and Minds IPO Oversubscribed?
I just got an email with my allocation of shares in this IPO. It's 82% of what I requested and the settlement dates and first trading date have been brought forward. So looks like the IPO is oversubscribed and closing early.
Friday, October 19, 2018
Overfitted
When I started trying to backtest the model with my new program the performance was bad, worse than I expected and worse than backtests I'd done previously. Recent changes to the model seem to have overfit it to the recent data. Therefore, we can't rely on the model going forward. This will need thorough investigation and in the mean time I'll stop trading.
Wednesday, October 17, 2018
Hearts and Minds IPO
Another Australian IPO of a listed investment company (closed end fund). This one has a twist – there are no management fees and the directors have waived their fees too. Instead of receiving a fee, the managers will donate 1.5% of NAV each year to charity. The board of directors include local investing luminaries like Geoff Wilson and a long list of wealthy Australian families (such as the Lowy family) have agreed to make investments in the fund.
The fund is a long only fund investing in Australian and international stocks. Each year several Australian investment managers present at the Sohn Hearts and Minds conference their best investment picks for the coming year. 40% of the fund will be allocated to these picks. 60% will be allocated to "high conviction ideas" from a number of other "core" investment managers. In total the fund will invest in about 25 securities.
The picks from the last two conferences have done very well:
 One of the core investment managers is Regal, whose hedge funds have done extremely well.
In summary, I think this looks like being another good investment opportunity.
The fund is a long only fund investing in Australian and international stocks. Each year several Australian investment managers present at the Sohn Hearts and Minds conference their best investment picks for the coming year. 40% of the fund will be allocated to these picks. 60% will be allocated to "high conviction ideas" from a number of other "core" investment managers. In total the fund will invest in about 25 securities.
The picks from the last two conferences have done very well:
In summary, I think this looks like being another good investment opportunity.
Results for the S&P 500

Alpha 0.47948 Beta -0.22355 ror 0.46115 Sharpe 2.62376
Again these are annualized values. Annualized rate of return is 46% for this year.
P.S.
I've now written all the code including stops for NQ and ES. Stops only detract a little from performance for ES but quite a bit for NQ. This suggests that we should use wider initial stops, just to avoid catastrophe, rather than to get out of ordinary bad trades.
Tuesday, October 16, 2018
More Progress on Programming the Trading Model

5082 7637.43018 1.00000 0.00000 D buy. Stay long
5083 7490.00000 0.00000 0.00000 K sell. Go short
5084 7399.00977 0.00000 0.00000 K sell. Stay short
5085 7352.81982 0.00000 0.00000 K sell. Stay short
5086 7371.62012 0.00000 0.00000 K sell. Stay short
5087 7044.50000 0.00000 0.00000 D sell. Stay short
5088 6964.02978 0.00000 1.00000 R buy not confirmed by pdD D sell. Stay short
5089 7157.20996 1.00000 1.00000 R Buy outside BB confirmed by pdD
5090 7068.67041 1.00000 1.00000 R Buy outside BB confirmed by pdD
5091 NA 1.00000 1.00000 R Buy outside BB confirmed by pdD
These are the most recent decisions, including today's decision to stay long. The "NA" indicates that we don't yet know the index value for today...
It also produces some performance statistics:
Alpha 1.76456 Beta -0.21425 ror 1.68344 Sharpe 5.47108
That means 176% p.a. of alpha... This is based on compounding the daily alpha over the year. Beta to the market is slightly negative and so compound rate of return for the year is a little less than alpha. I don't expect that high rates of return in other years. Conditions are ideal this year and probably the model is a bit overfitted. One of the reasons for doing this programming is to make it easier to test the model on larger samples.
Next I will add some refinements like using futures prices instead of index prices for performance results. Oh yes, and adding stops!
P.S.
When I ran the algorithm on the S&P 500, I found at least one bug which also needs ironing out.
Firetrail Cancels IPO
I looked at the prospectus but decided not to invest. Apparently they got more than the minimum funds raised but claim that there aren't enough different shareholders...
Dear Moom,
After careful consideration Firetrail Absolute Return Limited (Company) (in consultation with Firetrail Investments Pty Limited (Firetrail)) has made the decision, in the best interest of investors, to withdraw the initial public offering for ordinary shares in the Company (Offer) which was scheduled to close this Friday, 19 October 2018.
The Company made the decision to withdraw the Offer (in consultation with Firetrail) as it was in the best interests of investors to do so given liquidity concerns, in particular the concentration of the shareholder base. Listed Investment Companies (LICs) that do not have a well-diversified shareholder base are generally at a higher risk of the share price trading at a discount to the company’s net tangible assets. As such, we believe it was in the best interests of shareholders to withdraw the Offer, despite raising in excess of the minimum investment amount.
Investors that would like to gain access to the strategy are still able to do so through the Firetrail Absolute Return Fund which is still open to investors and has delivered strongly during the recent market volatility over the past week. Since Monday 8 October 2018, the share market has fallen over -4%1. The Firetrail Absolute Return Fund has delivered a positive return of approximately +1.3% over the same period, highlighting the benefit of the strategy which aims to deliver positive absolute returns above the RBA Cash Rate, independent of movements in the underlying share market.
Please contact us if you would like more information on investing in the Fund.
Kind regards,
Firetrail Investments
Firetrail Absolute Return Limited withdraws listed investment company IPO offer
Tuesday 16 October 2018Dear Moom,
After careful consideration Firetrail Absolute Return Limited (Company) (in consultation with Firetrail Investments Pty Limited (Firetrail)) has made the decision, in the best interest of investors, to withdraw the initial public offering for ordinary shares in the Company (Offer) which was scheduled to close this Friday, 19 October 2018.
The Company made the decision to withdraw the Offer (in consultation with Firetrail) as it was in the best interests of investors to do so given liquidity concerns, in particular the concentration of the shareholder base. Listed Investment Companies (LICs) that do not have a well-diversified shareholder base are generally at a higher risk of the share price trading at a discount to the company’s net tangible assets. As such, we believe it was in the best interests of shareholders to withdraw the Offer, despite raising in excess of the minimum investment amount.
Investors that would like to gain access to the strategy are still able to do so through the Firetrail Absolute Return Fund which is still open to investors and has delivered strongly during the recent market volatility over the past week. Since Monday 8 October 2018, the share market has fallen over -4%1. The Firetrail Absolute Return Fund has delivered a positive return of approximately +1.3% over the same period, highlighting the benefit of the strategy which aims to deliver positive absolute returns above the RBA Cash Rate, independent of movements in the underlying share market.
Please contact us if you would like more information on investing in the Fund.
Kind regards,
Firetrail Investments
Sunday, October 14, 2018
NQ Equity Curve
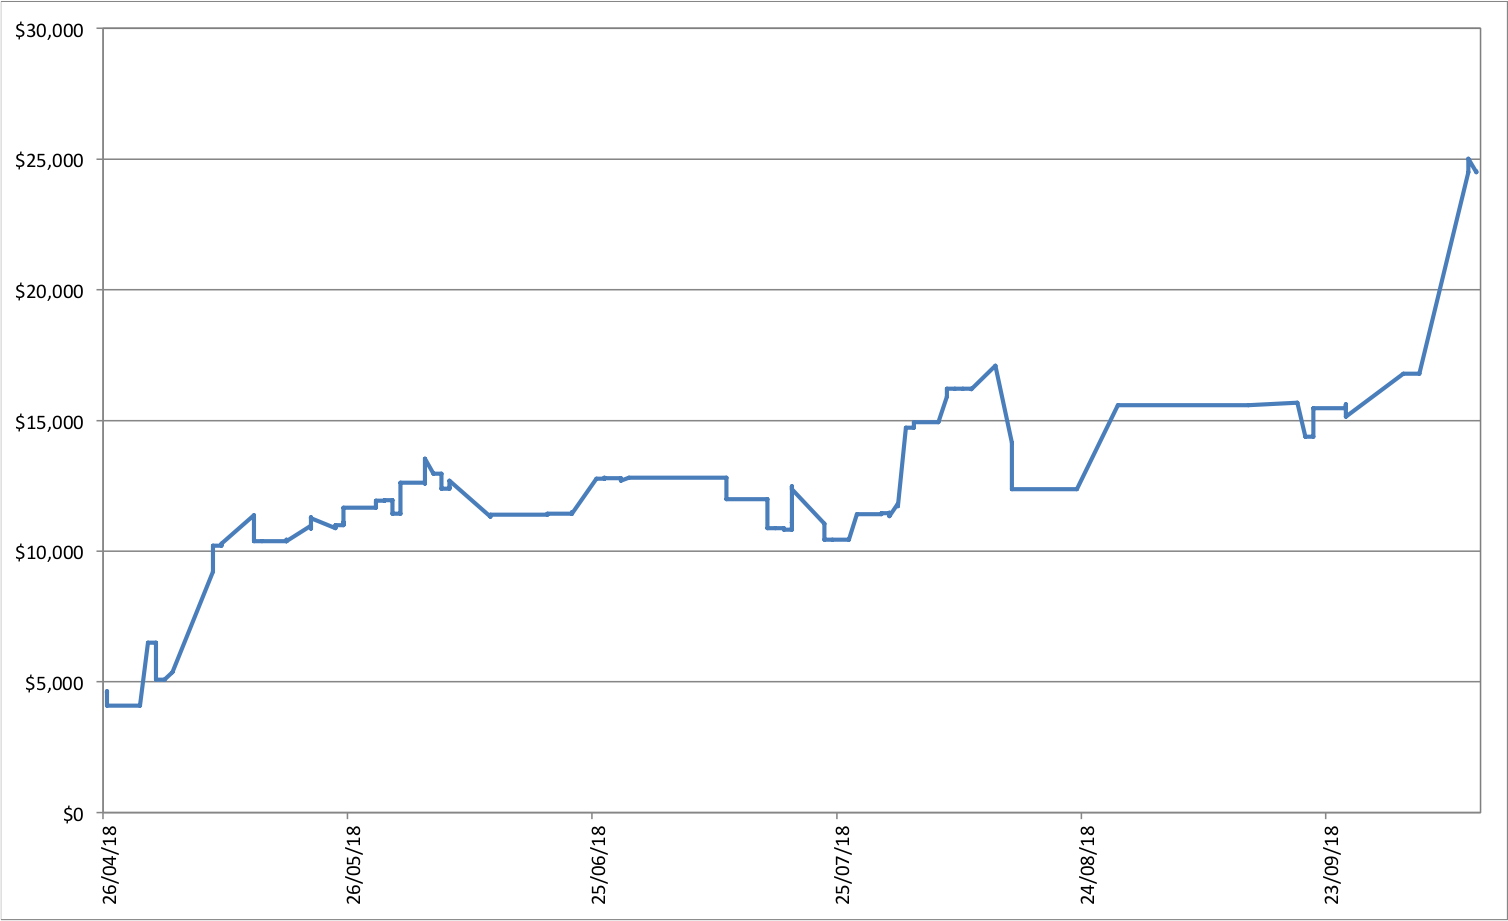
This is the equity curve trading NQ futures since the beginning of the trading experiment. It starts at about USD 4k because that was the cumulative profit for 2006-8. This isn't our total trading performance because I've also traded other things like ES futures and earned a little interest.
The little tick down at the end is the "bad trade", which wasn't so bad in the end, but that was mostly luck.
I've done a bit more programming and now the program produces a coherent list of trades, one for each day. But I've only written up part of the system yet, so you wouldn't want to actually trade them :) In fact, here is the fractional gain (i.e. 0.15 is 15% gain, not compounded) if you traded "the strategy" for this year:

In other words, it breaks even in the end, which is what you'd probably expect for a random set of trades. This kind of thing is now easy to produce, which is one of the main things this is all about.
To explain this curve, the model starts at long on 4th January and some of the code is written for what to do if you are long - it might tell you to switch to short, but not much code is written yet for what you should do if you are short. So there is little code to flip you back to long again. As a result the model is stuck on short for much of the time...
Saturday, October 13, 2018
Started to Code the Decision Tree
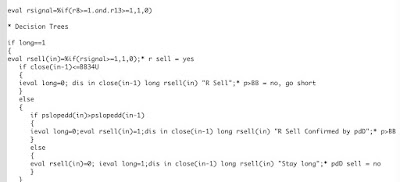
After a couple of hours of coding and debugging I got the first little bit of the model decision tree to work and spit out buy and sell decisions. The output looks like this:
4895 6584.58008 1 0.00000 Stay long
4896 6653.29004 0 1.00000 R Sell Confirmed by pdD
4897 6676.62988 0 1.00000 Go long
4898 6677.93994 0 0.00000 Stay short
4899 6662.66016 0 0.00000 Stay short
4900 6708.49023 0 0.00000 Stay short
As the decision tree is far from complete, only the first two orders – long and then short – make any sense. The first number is a code for the date, the second is the closing value of the NASDAQ 100 index on the previous day (so that it's easier for me to work out where I am than the obscure date codes). Then there are codes for buy and sell and then a verbal description of the decision and why it was taken.
Luckily, writing computer code is a core practical skill for professional economists (or you should have these skills if you don't!) we took programming courses as part of our first year undergrad study.
Should Have Done the Long Trade
Market went up strongly. Model is still long for Monday. But I'm still not in. I needed to take a break from trading. This is why I need an automated system.
Friday, October 12, 2018
Rescued the Bad Trade
I stayed up and closed at 7119.75 the bad trade where I went long at NQ = 7145. So in the end I only lost USD 500 on that trade and am still up more than USD 6k for the month. If I exactly followed the model, though, I would be up USD 13k! The model is now switching to long for Friday, but this trade is based on the adjustment I made for the 1987 crash (picture below from 1987) and doesn't have a lot of statistical support. So, this is a high risk trade and I think I will wait it out. Yeah, I'm not doing what the model says to do but at least I am not trading against it!

In other news, the Tribeca fund (TGF) starts trading on the ASX today . They only sold 63 million shares in the IPO out of a maximum of 120 million, which is a bit disappointing. Maybe, my thesis that it would trade above NAV will take a while to work out. My entry point into Pershing Square was really bad - lost around 4% already on it. I also did a trade yesterday to switch back AUD 20k from CFS Conservative Fund to CFS Geared Share Fund. ASX SPI futures are off 47 points but CME NQ futures bounced after the New York close and the model is switching to long, so hopefully my timing wasn't too bad.

In other news, the Tribeca fund (TGF) starts trading on the ASX today . They only sold 63 million shares in the IPO out of a maximum of 120 million, which is a bit disappointing. Maybe, my thesis that it would trade above NAV will take a while to work out. My entry point into Pershing Square was really bad - lost around 4% already on it. I also did a trade yesterday to switch back AUD 20k from CFS Conservative Fund to CFS Geared Share Fund. ASX SPI futures are off 47 points but CME NQ futures bounced after the New York close and the model is switching to long, so hopefully my timing wasn't too bad.
Thursday, October 11, 2018
Great at Analysis No Good at Trading
I'm great at analysis and no good at trading. Just like this guy. This is why I need a computer to trade for me. That will now be the top priority.
Australian Corporation Tax
As an Australian investor in public companies I didn't used to care too much how high the corporation tax was. This is because when a company pays tax and then pays a dividend, Australian investors get a "franking" credit for the tax paid by the company, so there is no double taxation. Foreign investors usually can't use these credits, hence the argument to partly level the playing field by bringing down the rate of the tax. If a company doesn't distribute profits and the share price increases and I sell my shares and pay capital gains tax, then there is double taxation. But the long-term capital gains tax is only half the normal income tax rate and so this isn't too bad (Labor want to reduce this discount too). Additionally, the price paid for listed shares takes into account that profits are taxed, which helps mitigate the impact of the tax on the rate of return that investors receive. Australian investors, though, are willing to pay more for Australian shares than international investors are, given their differential tax treatment.
Actually, I like getting franking credits, because after I deduct investment costs like margin interest they reduce the tax on my salary.
But as I think about setting up a private company, I increasingly like the idea of lowering the corporation tax. Profits that are re-invested in the business, rather than paid out as dividends, are greater if the tax rate is lower. Of course, this applies to listed companies too, and cutting the tax rate should raise the price of shares in a one time move. The more that we have existing investments rather than are buying new investments the more we should like increases in share prices... On the other hand, ot all the extra profits from lowering the tax rate will actually be realized. Market equilibrium should mean that after the rate of return increases, firms invest more, lowering the pre-tax rate of return. This mechanism is much like how stock market investors will buy shares raising the price and reducing the expected rate of return again. But lower taxes on investment are economically more efficient.
I Will Do What the Model Says to Do

Maybe today will finally knock my tendency to not follow the model out of me, but I kind of doubt it. I am getting better though. Today, I closed my short position early. That's not such a bad move. But then near the close I went long, because I thought the model was saying to go long tomorrow. But I had forgotten the correct way to read that rule and read it wrongly – I used today's value of the indicator instead of the forecast of it for tomorrow. The model in fact says to stay short into Thursday. The market continued to plummet and took away most of my gains for the day. Still, I am up for the month, for now.
I must fast-track model automation. First step is to convert the decision rules, which I now execute manually and record in an Excel spreadsheet into computer code (in my econometrics package) that can make decisions without errors. Then I need to get better at just doing the decisions at the right time while learning Python etc in order to build an automated system or getting someone else on board to do that. In the meantime, I will stick to trading a single contract to minimize risk.
Wednesday, October 10, 2018
New Investment: Pershing Square Holdings

I made a small (1% of net assets) investment in Pershing Square Holdings (PSH.L). This is a closed end fund trading on the London Stock Exchange that is managed by Pershing Square Capital Management, the fund founded and managed by William Ackman. Pershing Square funds did very well from 2004 to 2014, which is when they launched the closed end fund. They did very poorly in the next three years:

PSH lost 20.5%, 13.5%, and 4% in each of 2015, 2016, 2017. However, NAV has gained 15% or so year to date. The stock trades at a 27% discount to NAV. Given the past good performance, the return of good performance this year, and the substantial discount which the company is trying to reduce, I thought this was worth trying. Ackman and the firm are in the news for a $900 million investment in Starbucks, discussed here.
If you are wondering why a US hedge fund is listed in London, it's because it's not legal to offer hedge funds to retail investors in the US.
Thursday, October 04, 2018
Generation Global Share Fund Closed to New Investors
It turns out that the Generation Global Share Fund is closed to new investors and so I couldn't do the fund switch I tried to do yesterday. CFS's systems allowed me and the guy I phoned to select this option but then rejected the complete portfolio. So I recomputed the numbers and did the switch online now. New allocation is:
CFS Geared Share Fund: 7%
CFS Geared Growth Plus: 40%
CFS Conservative: 11%
Platinum International: 23%
CFS Developing Companies: 19%
Gearing in the Geared Growth Fund is lower than in the Geared Share Fund. Still it is quite aggressive and I will likely delever further at some stage.
CFS Geared Share Fund: 7%
CFS Geared Growth Plus: 40%
CFS Conservative: 11%
Platinum International: 23%
CFS Developing Companies: 19%
Gearing in the Geared Growth Fund is lower than in the Geared Share Fund. Still it is quite aggressive and I will likely delever further at some stage.
Moominmama Allocation
Following up from yesterday's post on delevering in my retail superannuation (retirement) account, here is the desired allocation compared to actual allocation in Moominmama's (formerly Snork Maiden - I mention this because I used to refer to my mother as Moominmama on the blog) Colonial First State managed funds account (in American: taxable mutual fund account). Desired allocation:
CFS Geared Share Fund: 19%
CFS Global Geared Share Fund: 9%
Platinum International: 27%
Generation Global Share: 13%
BT Property Investment: 13%
CFS Developing Companies: 19%
Actual:
CFS Geared Share Fund: 28.3%
CFS Global Geared Share Fund: 16.0%
Platinum International: 11.0%
Generation Global Share: 16.4%
BT Property Investment: 12.6%
CFS Developing Companies: 15.7%
The funds are in: geared (leveraged) Australian shares, geared global shares, global equity hedge fund, global shares, REITS, small cap Australian shares.
We are moving towards the desired allocation slowly by only adding each month to the underweight funds and by not reinvesting distributions. If things looked worse, maybe I would then actually switch funds, but then there will be a capital gains tax bill. Unlike the US, even at low income levels you have to pay capital gains tax (unless you earned less than AUD 18k a year and paid no income tax), though the long-term rate is half the normal income tax rate (for the moment).
This is how our asset allocation has evolved since the financial crisis:
 This doesn't include our house. The main trend is a reduction in allocation to Australian large cap srtocks since the recovery bounce from the crisis and an increase in other asset classes.
CFS Geared Share Fund: 19%
CFS Global Geared Share Fund: 9%
Platinum International: 27%
Generation Global Share: 13%
BT Property Investment: 13%
CFS Developing Companies: 19%
Actual:
CFS Geared Share Fund: 28.3%
CFS Global Geared Share Fund: 16.0%
Platinum International: 11.0%
Generation Global Share: 16.4%
BT Property Investment: 12.6%
CFS Developing Companies: 15.7%
The funds are in: geared (leveraged) Australian shares, geared global shares, global equity hedge fund, global shares, REITS, small cap Australian shares.
We are moving towards the desired allocation slowly by only adding each month to the underweight funds and by not reinvesting distributions. If things looked worse, maybe I would then actually switch funds, but then there will be a capital gains tax bill. Unlike the US, even at low income levels you have to pay capital gains tax (unless you earned less than AUD 18k a year and paid no income tax), though the long-term rate is half the normal income tax rate (for the moment).
This is how our asset allocation has evolved since the financial crisis:

Wednesday, October 03, 2018
Delevering
I just made a big switch in my Colonial First State superannuation account to reduce risk. Stock markets still look bullish but the Fed shows no sign of stopping raising interest rates, risking an inversion of the yield curve. They have been saying that this time is different and that an inverted yield curve doesn't mean that there will be a recession. But though the sample size is very small, it has been a good predictor in the past. We are not yet at yield curve inversion but it still could make sense to reduce risk. My CFS superannuation account has been invested very aggressively. At the end of September this was the allocation:
CFS Geared Share Fund: 48.9%
CFS Geared Growth Plus: 20.2%
CFS Conservative: 10.2%
Platinum International: 10.2%
CFS Developing Companies: 10.5%
So about 70% was in geared (leveraged) funds. Geared Share Fund is large cap Australian shares. Geared Growth is diversified. The new allocation, which is much closer to our new long-term allocation is:
CFS Geared Share Fund: 15%
CFS Geared Growth Plus: 18%
CFS Conservative: 4%
Platinum International: 23%
CFS Developing Companies: 20%
Generation Global Share: 20%
Both Platinum, which is a hedge fund (long and short global equities) and Generation performed well in the Great Recession. Doing this transaction in a superannuation account is tax free - capital gains tax of 10% is paid on unrealised gains on a continuous basis. There is just the cost of the entry/exit spreads.
I changed the allocation for new investments in Moominmama's CFS account, which is not a superannuation account to only buy the non-geared funds going forward. If things look more bearish, we may yet do a switch there too.
Tuesday, October 02, 2018
September 2018 Report
The Australian Dollar rose from USD 0.7201 to USD 0.7228. The MSCI World Index rose 0.48% and the S&P 500 rose 0.57%. The ASX 200 fell 1.04%. All these are total returns including dividends. We lost 0.63% in Australian Dollar terms and 0.26% in US Dollar terms. So, we outperformed the Australian market and underperformed international markets.
The best performing investment in dollar terms was NASDAQ futures gaining AUD 2.6k – and the worst the CFS Geared Share Fund losing AUD 10.7k. The best performing asset class was private equity, gaining 1.28% followed by commodities (this includes trading), gaining 1.22%. The worst performing asset class was Australian large cap, losing 1.57%.
The following is table of investment performance statistics computed over the last 60 months (extended from 36 months previously) of data:
 The first two rows gives the annual rate of return and Sharpe ratio for our investment performance in US dollars and Australian dollars. The other statistics are in comparison to the two indices. Based on beta, compared to the MSCI World Index we seem to be slightly geared, while compared to the Australian index we are less sensitive to market movements. We have a positive alpha compared to the Australian and a negative alpha compared to world markets. We capture more of the up movements and less of the down movements in the Australian market and the reverse in the international markets. The fall in the Australian Dollar over this period explains the poor performance compared to international benchmarks.
This month I made USD 2.5k trading futures. This is the second best result to date and ocurred as the NDX declined for the month. The table * compares my performance to the market and the model:
 This month was the sixth month of the futures trading experiment. The first month was the model development phase, and since then I have been trying to get disciplined at trading and further incrementally improving the model. I didn't trade in the first half of the month as I was traveling to Europe and Singapore and the model was short and based on relatively low volatility I thought the profit potential was low. This was a mistake as the model did very well. Then when I got back into trading we were in a corrective phase with the market trading sideways. I traded long NQ short ES for the last few days of the month. The model outperformed the market this month, though its return was not that high. The model is bearish and under-performs when the market is strong and outperforms when the market is weak. It got stopped out a couple of times, which is unusual. As a result the model made 4 trades in 4 days. The second time the model was stopped out, the market ended up on the day and so the stop was too tight. The first time, the stop reduced losses.
What I want to do next on the trading front is write the model's decision algorithm in computer code. At the moment I estimate the indicators I use with an econometric model but I then make decisions manually and record the details in an Excel spreadsheet. It is quite quick to do to make daily decisions in a single market but it is quite hard to do backtesting of different ideas. This will be much easier once we have the decision algorithm coded in the same program as the estimation model. Also, in the long run I plan to automate trading or at least automate data acquisition and decision making for multiple markets. Coding the model in the language of my econometrics program is a first step towards that. Once the model is written in one computer language, converting it to another shouldn't be hard.
I did our tax returns this month. I should get a big refund and Moominmama had to pay a little under AUD 1,000 in extra tax. Otherwise, I am waiting for the probate process to play out before undergoing a big round of financial restructuring.
We made a little bit of progress towards the new long-run asset allocation:
 Total leverage includes borrowing inside leveraged (geared) mutual (managed) funds. The allocation is according to total assets including the true exposure in leveraged funds.
We invest AUD 2k monthly in a set of managed funds, and there are also retirement contributions. Then there are distributions from funds and dividends. Major moves tbis month:
The best performing investment in dollar terms was NASDAQ futures gaining AUD 2.6k – and the worst the CFS Geared Share Fund losing AUD 10.7k. The best performing asset class was private equity, gaining 1.28% followed by commodities (this includes trading), gaining 1.22%. The worst performing asset class was Australian large cap, losing 1.57%.
The following is table of investment performance statistics computed over the last 60 months (extended from 36 months previously) of data:

This month I made USD 2.5k trading futures. This is the second best result to date and ocurred as the NDX declined for the month. The table * compares my performance to the market and the model:

What I want to do next on the trading front is write the model's decision algorithm in computer code. At the moment I estimate the indicators I use with an econometric model but I then make decisions manually and record the details in an Excel spreadsheet. It is quite quick to do to make daily decisions in a single market but it is quite hard to do backtesting of different ideas. This will be much easier once we have the decision algorithm coded in the same program as the estimation model. Also, in the long run I plan to automate trading or at least automate data acquisition and decision making for multiple markets. Coding the model in the language of my econometrics program is a first step towards that. Once the model is written in one computer language, converting it to another shouldn't be hard.
I did our tax returns this month. I should get a big refund and Moominmama had to pay a little under AUD 1,000 in extra tax. Otherwise, I am waiting for the probate process to play out before undergoing a big round of financial restructuring.
We made a little bit of progress towards the new long-run asset allocation:

We invest AUD 2k monthly in a set of managed funds, and there are also retirement contributions. Then there are distributions from funds and dividends. Major moves tbis month:
- I redeemed the Janus-Henderson Global Resources Fund, which reduced exposure to ROW stocks.
- I reduced cash and the margin loan in preparation for investing in the Tribeca IPO. As a result our allocation to hedge funds will increase substantially next month.
- I added to the Yellow Brick Road position which is now about 1% of net worth.
Subscribe to:
Posts (Atom)