Monday, July 31, 2006
What Type of Trader are You?
Everyone trades to some degree, even when they buy or sell a passively indexed investment. Some traders lose from trading and some gain. Find out which sort of trader you are.
Saturday, July 29, 2006
Going Short
The model is saying to be short on Monday. I have shorted QQQQ before the end of the day ($37.01). Could be early (the price already went to $37.10 and then fell back again), but eventually will be right I think. Based on the chart, this upcoming downmove could be signficant. The model though gives no information on future levels of the index, just the direction.
4:05pm Update:
I was a bit early going short but still up substantially for the day. Updated performance stats since 6/29/06:
Market Gain: -4.75%
Model Gain: 8.80%
Excess Return over Market: 14.22%
Account Gain: 14.90% (about $4000 on this account - not keeping track of gains in the Roth account but it is now up almost 40% on the contribution made earlier this year).
Excess Return over Market: 20.63%
Which is 145% of the model's gain. Using leverage and some intraday trades should result in a gain greater than the model and we are now seeing that. This kind of trading gain for a month is not unusual. What is hard is to not give the money back again. That is the next challenge.
If the index continues to rise on Monday and the full(5,5,3) stochastic goes over 80 (it is now at 75) I will close the short and go long as we will have entered the persistent overbought state. There is a risk of this based on my most forward looking indicator. I am short 2500 QQQQ shares in the trading account and long 5 $39 August puts in the Roth account. A one cent change in QQQQ therefore has a $30 impact on my net worth...
Friday, July 28, 2006
Bill Gross' Latest Commentary
More evidence that in Gross' opinion the recent bear market in bonds is over.
Limited Transactions on Online Savings Accounts
One downside of these high interest online savings accounts that I didn't know about till today. Received a letter from HSBC telling me that I had been doing too many transactions on my account and was violating Federal regulations. If you do this for three consecutive months they will close your account or change it to another account type. The limit is six transactions per month including transfers to your own accounts online. I had been trying to do as many transactions as possible using my savings account in order to maximize my interest income. I would move most of my pay into the account each time I received a pay check. So from now on I will only move money there that I think is really going into savings but I am not yet ready for whatever reason to move to its final "home".
Wednesday, July 26, 2006
Bernanke Financial Disclosure
Like PF blogs financial disclosures by public officials are always fascinating.
Tuesday, July 25, 2006
Balance Transfer
Just completed a balance transfer, paying off about $8500 on my Amazon credit card using a balance transfer from my HSBC credit card. The balance on the HSBC card is now $7000. My total credit card credit line is $19500. I like to keep plenty of the credit line free for emergency spending, even though from what I understand it doesn't have a long-term impact on your credit score. The new HSBC loan is at 2.99% and the old Amazon one was at 0%. I get lots of zero percent offers in the mail almost every day. I am not taking them since I learned that these do have a long term impact on your credit score. Why carry any balance? The loan helps fund my trading account. If the balance is below $25000 you can't make day trades and this money is free or very cheap. Hopefully, if and when I finally grow my trading account more I will probably pay off the credit card loan just because it is a hassle to think about and only amounts to about 2% of net worth at the moment and I like to keep life simple.
Elite Trader
I have been a member of Silicon Investor for 8 years but only just discovered a site called Elite Trader today. Read an interesting discussion of Jim Simons' hedge fund. Don't know how useful it is in general but thought I'd just pass it along for those interested in learning more about trading.
Today, finally things seem to be going to plan trading wise. Much more relaxing. At this point it is looking like the rally continues all week long though there could be a significant correction in it around Wednesday.
4pm update - since 30 June:
Model: +6.8%
NDX: -6.5%
Excess Return: 14.2%
Trading Account: +2.9%
Excess Return: 10.0%
Capture of Model Performance: 70%
Am happy to be back on the positive side :) This is the revised version of the model. My account perfomance is as it happened. Excess return measures the difference between an account invested in NDX and an account invested in the model from inception. Excess return increases only when the model is correctly short.
Sunday, July 23, 2006
Heads and Shoulders
No not a special deal on shampoo :) Everywhere you look across the stockmarkets there are head and shoulders formations or closely related chart patterns. One of the most prominent is on the Dow. The implication is a fall to around the low of August 2004. In Elliott Wave terms the move down from the top is an ABC (or WXY) pattern with the wave C ( or Y) down just getting started. I and Volkmar Hable both think there will, however, be a rally in the coming week, which on the NASDAQ and SPX indices will complete wave 2 of this C wave, an upmove which started some time on Tuesday.
Will the head and shoulders correction be the end of this current short-term bear market? It is impossible to say but I think there is a strong probability that it will be. Most bears are looking for a low in October or even 2007. What most people are looking for often doesn't happen. I'm now thinking that this year will turn out to be more like the mid-cycle slow downs in 1985 and 1995 rather than a full blown recession and the market might act more like 1987 (but without the dramatic crash) or 1998 - i.e. a short, sharp correction over a few months. This is partly based on trying to fit Elliott Wave patterns to various foreign stock indices. It's hard to believe that their rallies since 2002-3 are corrective in nature rather than bull market impulse waves. If the latter is true then the current correction is just wave 4 of an ongoing bull-market and the market should not go below the 2004 (e.g. FTSE, DAX) or 2005 (in Australia) highs in these indices.
Learning from your mistakes is one of the most important habits of successful investors. So I have been busy analysing where I sent wrong in the last few days. I've come up with at least one or two useful additional trading rules. Also it is clear that some times my technical analysis tools and model give trades with higher probabilities than others and the size of the trading position needs to be modified accordingly.
Saturday, July 22, 2006
Losing Streak
The model has now lost money for 5 days in a row :( This is the longest losing streak so far in the simulation I did for this year. On average the model only loses money for 5 or more days in a row one time each year. The longest losing streak in the last 10 years is 6 days.
Friday, July 21, 2006
Trading Performance Update
Since I have been using the model the NASDAQ 100 Index is down 7%, the model is up 3%, and my account is at... zero. Actually, this is not so bad - I beat the market by 7% and captured 70% of the model's excess return over the market. Over time, I hope my trades will capture more of the model's returns as I get used to using it. Of course, if you were in cash you also would make close to zero percent over this period. But if the market had instead gone up you wouldn't have beaten the market. Today the market corrected much of the recent rally. I am predicting a 4 day rally through Wednesday which might take the QQQQ's to $37.50 (optimistically). This evening the market is reacting well to the Microsoft earnings report and negatively to Google who beat their numbers but.... There were wild fluctuations in GOOG following the announcement. I think this is because Google has such a lot of numbers computed in non-GAAP ways as well as according to GAAP in its earnings report and traders get very confused.
Thursday, July 20, 2006
Croesus Again
A glimmer of hope of getting something back from the Croesus debacle. Trading was rough today as I was still short when the market rose in response to Bernanke's comments. The model now switches to a long recommendation as the stochastic rose above 20. In yesterday's post I labeled the beginning of this upward correction in the market wave iv. That will have to be relabeled wave 2. Wave 1 down is therefore complete. The outlook for the next month or so is still bearish, however.
Wednesday, July 19, 2006
Bearish Outlook
I went long and lost money and then went short and lost money... Of course if I followed my model and rules precisely I would have stayed short and ended up a little down on the day but not as bad as I was. I kept the short position.
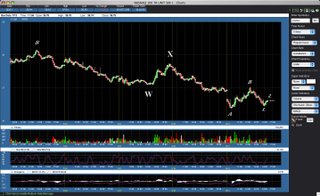
Here is my latest Elliott Wave interpretation of what is happening:
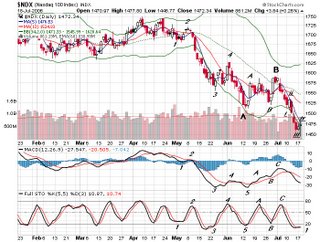
The chart implies that there will be another day or two before a modest upward correction. There will be two more stochastic cycles before we hit bottom though as there should be five waves in total in a wave C which we are now in. So this is very bearish. Will that be the end of the bear market? I don't know. Will update you when I have a more solid idea.
Yahoo reported this evening and its stock is getting totally trashed. This supports my interpretation and forecast.
Tuesday, July 18, 2006
All Bets Off
On Tuesday, Japan reversed the change in money supply to reduce money supply relative to last Thursday and plans a further reduction on Wednesday. Market isn't responding much to this morning's PPI figure. The CPI will be announced tomorrow. Lots of corporate earnings reports this week too. The stochastic oscillator is still below 20 - it increased a little yesterday - at this level the presumption is to still be short. But yesterday the oscillator increased a little and to remain constant today prices pretty much need to rise.... movement of the oscillator tends to be pretty smooth and so this suggest higher prices today. A very big rally is needed to get above 20 still - about 3.5%. So I am again going tentatively long this morning but not holding overnight positions until the trend is clear.
Monday, July 17, 2006
Bank of Japan Massively Increases Money Supply
The financial mass media does not discuss this major driver of the stock market very much if at all. More specialized sources are only recently beginning to understand the importance of changes in Japanese Money Supply on global asset prices. Fluctuations in the Japanese monetary base dwarf those in the money supply of any other country including the United States. It seems that Japanese monetary policy is far more important than the actions of the U.S. Federal Reserve. Before and during the May decline in global financial markets the Bank of Japan sharply reduced the money supply. Only when they began to increase it again did the collapse in the markets mitigate. Then starting on July 4th the BoJ again withdrew liquidity. On July 14 they increased the current account balance by an unprecedented 40% in one day! If history is a precedent this should trigger a strong rally in the market in coming weeks. The BoJ does, however, plan to reduce the increase, which was unplanned. How do you accidentally create $40billion in high powered money?
This morning the US Dollar is up strongly - this might indicate dollars being bought with those Yen? The Japanese market was closed Monday for a national holiday. I went long QQQQ at 35.88 around 8:15am this morning.
This morning the US Dollar is up strongly - this might indicate dollars being bought with those Yen? The Japanese market was closed Monday for a national holiday. I went long QQQQ at 35.88 around 8:15am this morning.
Saturday, July 15, 2006
A More Positive Post!
At mid-month things are looking a lot better than at the end of last month. Since the disastrous 29 June FOMC Day I have recouped my trading losses of that day and more by trading QQQQ. The market has fallen 8%, my model has added 5%, but my trading account has added 18%. This is due to trading on margin and buying and selling intraday - the model is based on closing (day-end) prices only. Don't believe the real estate gurus who tell you that only real estate allows leverage. Using leverage in the stock market is no more dangerous than in the real estate market if you know what you are doing... And if you don't know what you are doing it is just as dangerous in both (though I know how I could lose all your money for you in a day in the stock market, which isn't possible in the real estate market - it takes longer to lose all your money there - put all your money in an out of the money option the day before option expiry if you really want to lose it :)).
My Roth IRA account has reached a new high $10,860 from a total investment of $8000 a few months ago. So I am 28% of the way to the goal of making $10,000 in profits on my Roth IRA. Net worth is now only $3000 from my highest month-ending figure (though I reached maybe $328,000 at one point intra-month). I am $55,000 from reaching my end of year goal and so am behind where I should be at this point - $324,000. I am fairly confident now of achieving the goal though.
Recently my blog has discussed trading moves more and more and I hope that isn't too boring for those of you not interested in trading. By the way, it is dangerous to follow my moves blindly as maybe I won't have time to post when I change direction. Please just use these posts as additional opinions about market conditions. It is dangerous to try to follow anyone else's trading moves blindly!
Finally, nice to see a positive article about one of my more disappointing investments: Challenger Infrastructure Fund.
Ameritrade Sucks But I Love the Streamer
Today I placed an order to cover my QQQQ short at $35.80. This was 1 cent above the low price of the day. Just as I did so, Ameritrade's servers crashed - the order was not accepted and when I tried to log-in again, I couldn't even get the login page. From reports on the Yahoo website, all of Ameritrade's customers were affected. Eventually I did cover - I missed a couple of good opportunities after I got back on and finally closed out at $35.95. The difference is $375. I have seriously considered moving my account to Interactive Brokers in the past. But I really liked the Ameritrade interface and so decided not to. Also for orders of more than 1000 shares Ameritrade is cheaper. The big advantage of IB is that you can trade futures as well. I think I may now make the move and keep the Ameritrade account for the sake of the charts as well as keeping the Roth IRA there. I haven't gone long yet, but based on the model will likely do so on Monday.
Friday, July 14, 2006
Change of Plan
Went long at the open at 36.61 on the QQQQ. Stopped out at 36.45. Went to a long meeting (PhD dissertation defence - environmental research in China was the topic) and then came back and went short again at 36.71 with 3000 shares this time instead of the 2000 + 3 option contracts in the Roth the first time. The stochastic is below 20 which is the persistent oversold state and though other diagnostics from the model didn't suggest that we were persistently oversold, and looking at the S&P 500 index would hardly make you think so... I should probably have just stayed short. Anyway, I am up for the day at this point and that is what matters I guess. The market looks like going lower than today's low so far. The whole correction from 3 July looks now like a double zigzag in E-Wave terminology. This morning was the end of wave A of the second zigzag and now we are in the wave C of the second zigzag.

Thursday, July 13, 2006
Cover Shorts and Go Long
The model says to be long from tomorrow. So I sold my QQQQ put options and bought back the QQQQ stock I had sold short. The underlying QQQQ position was a bit more than 50% of my net worth. Today's gain alone was $2700. I plan to establish long positions in the morning. The market closed very close to its lows and the stochastic is in the persistently oversold range. So best to still be cautious about going long. I didn't have time to buy options in my Roth account either before the close. Intraday the price action played out in almost perfect Elliott Wave Theory fashion. SPX/SPY has a clear 9 waves down - an extended impulse. In the QQQQ/NDX that itself is the 5th wave from the July 3rd high.
Over the last month or so I have developed my new approach to trading through a couple of different versions. Trading using my new systematic model based approach is so different to using traditional "analog" approaches. I am fairly confident that I have discovered something very significant. Am trying "not to count my chickens before they hatch" but it is hard not to speculate about the future. I don't feel at all euphoric. That is probably a good thing.
Over the last month or so I have developed my new approach to trading through a couple of different versions. Trading using my new systematic model based approach is so different to using traditional "analog" approaches. I am fairly confident that I have discovered something very significant. Am trying "not to count my chickens before they hatch" but it is hard not to speculate about the future. I don't feel at all euphoric. That is probably a good thing.
Tuesday, July 11, 2006
Mutual Funds Improve
Interesting article about improving performance of mutual funds. I've posted a couple of times about how actively managed funds seem to do better than passively managed funds in weaker stock market conditions and vice versa. Last night I was checking out the performance of TIAA-CREF's variable annuities (these are basically mutual funds - not the standard variable annuities). Over a 10 year horizon their indexed stock fund has essentially performed the same as their actively managed Stock Fund. But in the last year the actively managed fund has strongly outperformed the indexed fund. Their Growth Fund however has totally underperformed over every time horizon. But interestingly their best fund of all is the TIAA Real Estate Fund which invests directly in real estate. It has outperformed the equity funds on every time horizon. Currently my TIAA-CREF account is invested in the Real Estate Fund and the Bond Fund.
Monday, July 10, 2006
Forecast Update
Currently my model is projecting Thursday as the turn around day in the market when a new uptrend will start. Of course this can change as we approach that date and new info updates the model. Am visiting in Burlington, Vermont for the last few days. beautiful weather. Went hiking to the top of the highest mountain in Vermont. We cheated and got a cable car to the top of the ski slopes. Then we hiked to the summit from there. After that though we hiked all the way back down to the valley bottom. Still sore :( Very steep and rocky descent involving lots of jumping down rocks and just the continual shock of taking my weight onto my legs in the descent. The ascent route involved a little rock climbing, some people were giving up and turning back but once you figured the route it wasn't too hard. It was rated DDD for very difficult on the map they gave out and there were lots of warning signs at the beginning of the trail to only try it if you were well prepared (we had no special gear was just wearing sneakers). From the top we could see right across the state from the Adirondacks in NY , Lake Champlain, and up and down the green mountains. May post pictures some time when we have them available.
Thursday, July 06, 2006
Trading Update
My trading model automatically stopped me out this morning when QQQQ reached 1.25% down. It then fell further and I went long for a daytrade. But I expect to go short before the close. The model is a bit ambiguous today on the forecast for tomorrow, but looking at a bunch of other stuff I have to side with the more negative view. Today's downmove was ostensibly started by the North Korean missile launch putting pressure on the Japanese market. Then some strong economic reports came out this morning in the US, raising interest rate fears again. The model didn't fail today despite prices falling - we can't predict prices and don't try to. The stochastic oscillator I am forecasting will end the day up, validating the forecast. The stop loss helped boost my returns above those of the market. Perhaps I should have reversed to short when the stop was hit. But you can't win them all.
Tuesday, July 04, 2006
June Report
June 30 is the end of the financial year in Australia and is when mutual funds make distributions including tax credits. Therefore, this month's figures may still need to be adjusted when all the information is in.* Net worth fell $15233 to $303249. Investment return was -4.61% for the month. The MSCI index was flat. Spending came in at $1949:
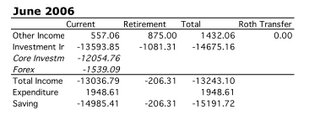
Non-investment income is low this month because of the strange schedule we get paid on. We receive June's pay at the end of May. The other income for June is some money from a research grant I got last year and wasn't paid this bit till this year and retirement contributions related to it and the combined May and June pay.
I report my numbers a bit differently to most other PF bloggers. Most people seem to list things according to accounts and note the change in the accounts each month. I think of investments as individual assets rather than accounts and I think of income in terms of whether I have direct access to that income - i.e. current income - or whether it is in a retirement account - retirement income. I am most concerned with raising my current assets and income rather than retirement income and assets. Mostly it is locked up till age 60. Though, as I've discussed in previous blogs, it is true that the US 403(b) portion (about $30k) can be withdrawn at marginal tax rates and penalties or perhaps without penalty as a 72t. The Roth contributions ($8k) can be withdrawn any time without tax or penalty, so perhaps I should list them as current assets. Roth profits can be withdrawn tax free for a first time home purchase... But the Australian superannuation account is the bulk of my retirement assets and is very hard to access before age 60. My goal is to reach a level where I can live off investments and trading way before that age. So essentially the money is useless to me.
Unlike most PF bloggers, I am not only concerned with the change in net worth but also in the rate of return on investment. Is net worth changing due to spending/saving behavior or due to investment gains or losses?
I also split out the effects due to changes in exchange rates on the current assets. A loss in terms of USD means there was some gain in terms of AUD. Therefore, this loss is not as critical as a loss in the actual base value of assets which I call core investment income.
*P.S. 13 July - adding in tax credits on mutual fund distributions in Australia the return for this month improved to -4.54%...
Monday, July 03, 2006
Buffett and Gates
EI just posted my take on Buffett's donation in response to a poster on the Silicon Investor website:
"Why are you so suspicious? Gates got to be the richest person on Earth. So once you've done that what's the point in accumulating more billions (by selling MSFT stock and investing in other stuff). So you move on to plan two: Create the world's largest charitable foundation. Yes you do get a massive tax deduction so you never pay tax on your income for the rest of your life. Best of both worlds!
Buffett is more interesting. He stopped short of overtaking Gates - he realizes though that in dollar numbers he will never reach in his lifetime the level that Gates reached when MSFT stock was at its peak. The next move is more interesting - he has exchanged the option of making the Buffett Foundation bigger than the Gates one for outsourcing the job and not having to run a foundation - just sit on the board - so he can keep doing what he wants which is running Berkshire.
There is no point I think in giving billions (rather than millions) to your children unless you want them to retain control of your firm. In Gates case he was a minority shareholder anyway - though the biggest. So this wasn't going to be an option. In Buffett's case this ain't going to happen. His three children dropped out of college and aren't interested. They will now have plenty of charity to manage.
OTOH in Australia where there are no inheritance taxes you don't see this happening. Recently the wealthiest Australian resident, Kerry Packer, died. His son was already an executive in the family and public firms. He is now CEO and the shares primarily passed to him, so he is now the wealthiest Australian. Murdoch seems to have struggled with this. Though he is a US citizen now and even transferred the News Corp listing to NY. Will be interesting to see what the eventual outcome is there. Currently the inheritance will be divided among his various children. The News share structure is complex like Berkshires with voting and non-voting shares."
Sunday, July 02, 2006
Learning to Trade
Picking stocks isn't easy and neither is learning to trade. This is why most people are better off buying ETFs or mutual funds, dollar cost averaging and some of the other strategies I have suggested.
When I first started trading I tended to lose money. I would make money for a while and then lose more than I had made. This stage was the "tuition stage". This term is often used by traders.
Recently I have only lost as much as I have made. We could call this the "internship stage" :) Working for free.
Hopefully the next stage when I am trading according to the model will finally be the regular job stage. At least a side job at first.
Why bother? I have learnt a lot through this process. I think there is a high probability that I now start to make serious money from it. Unless my model breaks down and stops working that is. That's what happened to the guys at LTCM. The key to survival is to never take the kind of risks that they did in terms of leverage.
Will report detailed financial results for June soon. What I can say now is: I stayed above $300k in net worth. I lost around 4-5%. The MSCI index was flat for the month. Last month I was up when the MSCI was down. As a result I have about matched the index over these two months. In Australian Dollar terms the loss is about 1% less than in US Dollar terms.
Saturday, July 01, 2006
End of June, Finally :)
A calm day after yesterday. Glad this month is over. I lost money but think I have developed a tool that will make me a lot of money in future. So actually, maybe, it was a good month.
These are the average monthly returns of the MSCI All Country World Gross Equity Index over the last ten years:
January 0.20%
February 0.04%
March 1.02%
April 1.60%
May 0.17%
June 0.94%
July -0.66%
August -2.06%
Septembe-1.51%
October 2.20%
November 3.22%
December 2.34%
And here are mine:
January 1.13%
February-1.48%
March 0.97%
April 0.11%
May -0.42%
June 0.55%
July -0.11%
August 0.41%
Septembe-2.31%
October 3.95%
November 2.85%
December 1.65%
I don't tend to do well in summer but do beat the market in July and August. I do very well in October too. At this point July is looking likely to be negative if I end up writing off Croesus Mining (around 2.5% of net worth). Will be nice to end up with a positive investment return.
Subscribe to:
Posts (Atom)