Showing posts with label Economics. Show all posts

Friday, October 21, 2022

2019-20 Australian Income and Wealth Distribution


I didn't notice when the Australian Bureau of Statistics released the 2019-20 data on Australian household income and wealth distribution. I previously reported on the 2015-16 and 2017-18 data.

Mean gross household income was $121k per year in 2019-20 (all $ are Australian Dollars). The median was $93k. These are not adjusted for household size. ABS provides data adjusted for household size in terms of the income a single person would need to achieve the economic well-being of the average household. To adjust these to the required income of a household with 2 adults and 2 children requires multiplying by 2.1. I seriously doubt that adding a child only increases costs by 0.3 of the first adult! 

Mean gross household income in the ACT was $150k and the median $124k.

To be in the top 10% of households requires a gross income of at least $235k. To get information on the breakdown inside the top 10% you have to use their data on the number of households within each of different bands of weekly income. 4.7% of households have an annual income above $312k and another 3% between $260k and $312k. Our gross income was $264k (taxable income), so we just fall within this group and, therefore, in the top 7.7%.

Mean household net worth was $1.04 million and the median was $579k. To be in the top 10% you needed a net worth of $2.26 million. We were at $4.44 million at the end of June 2020. To be in the top 3.9% you needed a net worth of $4 million. So I estimate we were at the edge of the top 3.3%. I guess it makes sense given my age that we higher in the wealth distribution than in the income distribution.

1.2% of households had a net worth above $7 million and 0.6% above $10 million.

There is a lot more data on breakdown of assets etc. which I might report on another time.

To be in the US top 1% by net worth required USD 11 million ($17.75 million) in the same period. A top 1% US household income is around USD 600k and above.

Monday, July 22, 2019

New Macro Trade


I've started another long-term macro trade by buying a treasury note futures spread. The spread is short one ten year treasury note futures contract and long two two year treasury futures contracts. You can execute this with one trade using the TUT ticker. The face value of a two year contract is $200,000 and for a ten year contract, $100,000, so actually the trade is long four times as many two year notes as it is short ten year notes. The idea is that this spread will gain value as the yield curve steepens, which following a yield curve inversion, it already seems to be doing. The curve would steepen mainly because the Federal Reserve would cut short term interest rates. So, if they don't cut much the trade will lose. The more they cut the more likely it is to make money.

My other macro trade is gold. Though that is also a bit more like an investment as we plan to allocate to gold in the long term and I am using the IAU ETF for tax and psychological reasons. I've increased my position at this point to 4.89% of assets. The net treasuries position is nominally $302k, which is much bigger than that.

I've also been thinking about how to improve my new day-trading strategy. I think that I will add exit stops to each order I place. This means, for example, if we go long initially in a "headfake"and then the market falls and the sell stop order is triggered, rather than getting out of the market it will initiate a short position. That would have been a profitable trade in the S&P 500 futures on 16th and 19th of July. The resulting short gained more than the stopped out long lost. Also, I am thinking to keep half of the position as a turtle style trend following position rather than an actual daytrade. The difference to the medium term turtle trading is that the stop is moved each day based on action in the first part of the day rather than action over the last few days.

So I now have three time frames of trades. I am hoping that this diversification, while requiring entering more orders, actually results in me being less anxious about the trades and so actually spending less time looking at the market. We will see.

Monday, July 15, 2019

Trading Bitcoin Futures over the Weekend or Not

Because recently Bitcoin rallied strongly over weekends, I decided to close any Bitcoin futures short position at the end of trading on Friday. That means that this weekend I closed my short on Friday at the worst possible point and missed a more than 1000 points decline over the weekend. However, I've resolved not to get into this trade now and just wait for the next long trade.

Not including this weekend's action the average return over the weekend in the last 15 months when my model was short was -0.2%, i.e. a loss. But this is a small loss and is statistically insignificant. The t-statistic to test that this mean is different to zero is -0.31 (p = 0.74). On the other hand, the average return over the weekend when long was 1.5%. And this return is highly statistically significant. The t-statistic is 2.33 (p = 0.026).

This explains why I was reluctant to be short over the weekend but not to be long over the weekend. On the other hand, the expected loss isn't much, so avoiding trading over the weekend when short is due to risk aversion. Especially as I can place an effective stop in our Plus 500 CFD account. If we go long there and are short futures we are effectively out of the market. But it's expensive to do so due to their spread and overnight financing charges, and they only allow me to trade a maximum of 6 Bitcoin. On the other hand, I am only shorting one futures contract (5 Bitcoin) at a time at the moment.

So, how did this weekend affect these results? The gain to being short over the weekend was 9.5%. The mean weekend short return is now 0.07% with a t-statistic of 0.11 (p = 0.91). So, that is even closer to zero. Someone who is risk averse would still stay out of the market as the expected return is insignificantly different to zero.

To deal with the frustration, I am just telling myself that there will be a better opportunity to go long the further the price falls :) In the longer term, I think I would be less concerned about this if I diversify trading to multiple markets.

Friday, July 12, 2019

Distribution of Income and Wealth in Australia in 2017-18


The latest survey results have been released by ABS. To be in the top 1% in Australia you need to have a household net worth of about AUD 7.5 million (USD 5.25 million). We're in the top 4% according to the data. The mean household has a net worth of AUD 1.022 million and the median AUD 559k.

We're also in roughly the top 4% by household income if we'd earned 2018-19 income in 2017-18... Median household earns AUD 1,700 per week (AUD 88k per year) and mean 2,242 (AUD 117k). Of course, households with children average a lot more than this as the data include pensioners, students, singles etc. These data don't let you compute the income of the top 1% directly.

Saturday, March 23, 2019

Leave Liability


Here in Australia, employers nowadays seem to be very concerned about people not taking their annual leave entitlements. If your balance gets above a certain amount you are likely to get a message from HR telling you take vacation days before some deadline. I got one of these recently and promptly ignored it. It's not that I haven't taken some breaks. Maybe formally though I was only on leave for a couple of weeks this financial year. I think they might just put me on forced vacation from 1 July which is OK with me (see below why)...

I supervise one other academic. I was told to make a plan with him to reduce his leave liability. He has ended up scheduling a bunch of mini-vacations when he plans to work anyway.

My wife also got a request from her employer to schedule a lot of leave before 1 July. She contacted HR and told them that she couldn't take leave as she has a lot of work to get done. She only works 3 days a week. Their solution? She should switch to full time and take leave on the days she wouldn't be working! This is a win-win solution :)

It might be an even bigger win for us. Moominmama will be going on maternity leave from the end of May. Yes, we are going to have a second child. She plans to be on leave for at least a year.

I think this means that the 18 (?) weeks of maternity pay from her employer will be paid at the full time rate. Also, last time, they made employer superannuation contributions (15.4% of base salary) for the whole year. These too look like they'll be at the full time rate now.

This seems really crazy from the employer's perspective. I don't understand why employers are so concerned about having this "leave liability" on their balance sheet. At her employer apparently you can cash out the leave instead of taking time off. So that is a real liability. My employer allows only allows it in cases of "financial hardship". There is an "annual leave loading" of 17.5% extra pay for the vacation days. The surplus is paid out on termination. But if you do take leave now, it is paid out now and elementary economics say that the employer should want to get it paid out later rather than earlier! It's the employee who is missing out on getting the money earlier. That said, I should take more leave earlier :)

Monday, January 21, 2019

Likely Political and Economic Scenario for Australia

A couple of days ago I posted a list of all 12 of Labor's proposed tax increases. How likely is it that these will actually be enacted? Labor is unlikely to gain control of the Senate. So, they will need the support of minor parties and independents to push through their program. A quite likely scenario is that there will be a recession in 2020 and the minor parties will be very resistant to raising taxes in those conditions, especially on housing. Or Labor will decide to postpone some of the proposals in reaction to a recession. Then Labor is likely to not be re-elected in 3 years if unemployment is rising etc. So, at this point I would put even odds on most of this agenda being enacted.


Tuesday, December 25, 2018

What's Your Forecast for the Stock Market?

My brother asked me what my forecast for the stock market was. Here is what I wrote to him:

"Well, I’ve been surprised how weak it has been recently, particularly in December, which you may have heard is so far the worst December in US stock markets since 1931. December is a seasonally strong month as is January. The US economy has been strong though house prices have been falling in many places, presumably due to the Fed raising interest rates and this seems to have been the main reason why the market is down. House prices have been falling in Sydney and Melbourne without any increase in interest rates here. Some indicators though show that the global economy could already be in recession, but I don’t know how reliable that is. The reason I was a bit surprised was it has been very predictable that before recessions the yield curve would invert (short term interest rates higher than long term). This hasn’t happened yet in the US. However, the Fed is signalling that they are going to raise interest rates by another 0.5% in 2019 which would reach an inversion probably. Stock markets tend to be leading indicators and so looks like this time it is more leading than usual. The US economic expansion is the 2nd longest in history and so presumably would come to an end some time soon (Australia hasn’t had a recession since the early 90s though…). Now we can say that the bull market ended as stocks have fallen 20%. If we look at the last two recessions and stock market crashes in the US, the stock market bottomed near the end or after the actual recession – in March 2003 and 2009. At that point the Fed will have slashed interest rates dramatically and unemployment will be high. OTOH in the 1990s the US market bottomed in October 1990, which was when the recession was only just getting underway. The Gulf War turned that around.


I did reduce my exposure to the stock market in early October, but not by enough. So, I’d probably use rallies in the market to reduce exposure more at this point. I was planning to use trading as a hedge, but I stopped trading soon after that as backtests weren’t good and I got ill and didn’t have time to work on it.

Of course, I could be completely wrong about all of this. In the last cycle I got out too early and got back in too early. Probably this time I’ll be late :)

I’m not planning on buying Australian Dollars in a hurry either, even though the current price is quite good. I’ll buy them gradually."

Saturday, October 13, 2018

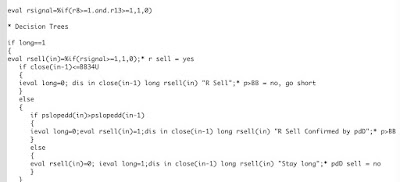
Started to Code the Decision Tree


After a couple of hours of coding and debugging I got the first little bit of the model decision tree to work and spit out buy and sell decisions. The output looks like this:

4895    6584.58008 1       0.00000 Stay long
4896    6653.29004 0       1.00000 R Sell Confirmed by pdD
4897    6676.62988 0       1.00000 Go long
4898    6677.93994 0       0.00000 Stay short
4899    6662.66016 0       0.00000 Stay short
4900    6708.49023 0       0.00000 Stay short

As the decision tree is far from complete, only the first two orders – long and then short – make any sense. The first number is a code for the date, the second is the closing value of the NASDAQ 100 index on the previous day (so that it's easier for me to work out where I am than the obscure date codes). Then there are codes for buy and sell and then a verbal description of the decision and why it was taken.

Luckily, writing computer code is a core practical skill for professional economists (or you should have these skills if you don't!) we took programming courses as part of our first year undergrad study.


Thursday, October 11, 2018

Australian Corporation Tax

The Australian government has lowered the rate of corporation tax on small businesses and planned to lower the rate on larger businesses too. The latter was blocked by the Senate. The main reason put forward for reducing the tax seems to be increasing international competitiveness, though this is less important for small businesses that mainly don't have international investment in them. Today, the news is that the government wants to bring forward by several years the reduction to 25% for small businesses as a pre-election vote winner. Labor, by contrast, opposes this cut (they withdrew their policy to repeal the previous cut) and wants to raise all sorts of taxes on investment.

As an Australian investor in public companies I didn't used to care too much how high the corporation tax was. This is because when a company pays tax and then pays a dividend, Australian investors get a "franking" credit for the tax paid by the company, so there is no double taxation. Foreign investors usually can't use these credits, hence the argument to partly level the playing field  by bringing down the rate of the tax. If a company doesn't distribute profits and the share price increases and I sell my shares and pay capital gains tax, then there is double taxation. But the long-term capital gains tax is only half the normal income tax rate and so this isn't too bad (Labor want to reduce this discount too). Additionally, the price paid for listed shares takes into account that profits are taxed, which helps mitigate the impact of the tax on the rate of return that investors receive. Australian investors, though, are willing to pay more for Australian shares than international investors are, given their differential tax treatment.

Actually, I like getting franking credits, because after I deduct investment costs like margin interest they reduce the tax on my salary.

But as I think about setting up a private company, I increasingly like the idea of lowering the corporation tax. Profits that are re-invested in the business, rather than paid out as dividends, are greater if the tax rate is lower. Of course, this applies to listed companies too, and cutting the tax rate should raise the price of shares in a one time move. The more that we have existing investments rather than are buying new investments the more we should like increases in share prices... On the other hand, ot all the extra profits from lowering the tax rate will actually be realized. Market equilibrium should mean that after the rate of return increases, firms invest more, lowering the pre-tax rate of return. This mechanism is much like how stock market investors will buy shares raising the price and reducing the expected rate of return again. But lower taxes on investment are economically more efficient.


Monday, September 17, 2018

How Many Households in Australia are Rich?

Every couple of years the Australian Bureau of Statistics surveys the distribution of household wealth in Australia. The most recent data is from the 2015-16 survey. It doesn't provide a lot of detail though. The downloadable data provides the averages for quintiles and the level at the top of each decile. They report that net worth at the 90th percentile is $1.979 million.

We can get more information by using the reported mean and the Gini coefficients and assuming that the data follow a log-normal distribution. You can get details of the necessary calculation here - use Wolfram Alpha to get the inverse of the erf function.

The distribution fits well for the 30th (ABS: $232k, lognormal: $240k) to 90th percentiles (ABS: $1.979 mil, lognormal: $2.1 mil). Below the 30th percentile the lognormal predicts too much wealth, while right at the top it would predict at most one billionaire in Australia. But I think we could use it up to the 99th percentile without too much error. The top 5% starts at $3.26 million, 4% at $3.7 mil, 3% at $4.3 mil, 2% at $5.3 mil, and 1% at $7.4 mil. All these numbers will be a bit higher now, of course. The most recent figure for mean household net worth is over $1 million rather than $929k here.

The ATO regards anyone controlling more than $5 million as wealthy, so that is the top 2 to 2.5% (with current mean net worth). To be a wholesale investor you need individually $2.5 million of net assets. So assuming a couple have $5 million, that also is the top 2.5%. So, the top 2.5% in Australia are considered "rich". That is roughly 250,000 households.

P.S.
In 2015-16 we were at the 16th percentile.

Friday, April 06, 2018

Types of Trading

There are lots of types of trading. Some of the important strategies are the following:

1. Market-making: A market maker profits from the bid-ask spread in the market, selling at the ask and buying at the bid. This is very apparent in options markets where there is usually a big bid-ask spread. They can hedge their "delta" risk by buying or shorting the underlying security - for example for futures options they can buy and sell futures contracts. For individual stocks - if they are trading a diversified basket they can again hedge using futures contracts (or ETFs). It is possible for individual investors to make markets in small and illiquid stocks - ie. selling at the ask and buying at the bid, but it is a very slow process waiting for people to trade with you.

2. Arbitrage: This exploits pricing anomalies, for example between futures contracts and ETFs for the same underlying index. Short one and buy the other. Occasionally, there are big arbitrage opportunities such as the famous Palm case.

3. Mean reversion: These are generalizations of arbitrage. For example, buying closed end funds (listed investment company in Australian) when they are selling below net asset value and shorting them when they are above. I've done this quite a lot with Platinum Capital (PMC.AX - just selling when above NAV - but actually there is a CFD you could use to short the stock). This is arbitrage between the value of the portfolio and the price of the fund. Statistical arbitrage is a market-neutral mean reversion trade where stocks that have risen in value are shorted and those that have fallen are bought. It was pioneered by Ed Thorp.

4. Selling option premium: This relies on the time decay of options. Most options expire worthless and risk aversion means that buyers should pay in net to reduce their risk. So option sellers should on average win. Again, delta risk could be hedged away in theory. The simplest case is covered calls where the trader buys a stock and sell a call - though actual delta hedging is a lot more complex than that.

5. Information trading: Here the trader knows information that they think will move the security. For example, recently I bought shares in IPE because Mercantile did. I assumed correctly that their analysis must have shown that the underlying portfolio was worth more than the stock price. This is a kind of mean reversion/arbitrage of course and is could also be seen as investing. Even after the company released news of the sale of Threatmetrix to Elsevier, the price didn't immediately move to the new higher NAV.

6. News trading: Here the information is not yet known but a trade is placed to take advantage of it. For example, if I know that Apple Computer will release their earnings but I don't have a hypothesis of which way it will move the stock, I could buy both calls and put options in the hope that a big move will make one increase by more than the other decreases. This seems pretty close to gambling - option prices should take into account the size of likely moves, so you are gambling that the move will be bigger than the market thinks.

7. Trend following/momentum trading: This is what most people think of as trading. The trader tries to take advantage of market momentum. This is the approach taken by many managed futures funds. Much online trading advice is based on this.

8. Hedging: These traders trade to hedge their investment or business positions. For example, an airline buying oil futures contracts to guarantee their future price of oil or an option buyer hedging an investment portfolio. The latter might also sell options to fund the hedging puts.

What have I missed? This paper has an interesting discussion of types of traders.


Wednesday, March 28, 2018

Safe Withdrawal Rates

Interesting simulations of safe withdrawal rates over longer time horizons by ERN. The lowest withdrawal rate simulated is 3% p.a. Ed Thorp states that 2% is actually the safe capital preserving withdrawal rate. Our current spending is about 2.75% of estimated total net worth including the inherited money. But I expect our spending to continue to increase faster than inflation for a long time to come.

Saturday, February 24, 2018

Long Term Investing Trends

The Australian Dollar tends to be high relative to the American Dollar during economic booms and low during economic crises. The recent low point in 2015-16 is related to a fall in commodity prices and slowdown in the World economy, especially in China. I think China probably slowed down by much more than the government admitted. During 2015 US stock markets went sideways or declined. The Australian market started 2015 optimistically but then had a steep fall:


There is now a lot of talk of renewed growth in the World Economy. On the other hand, US interest rates are rising as the Federal Reserve tries to reduce its balance sheet and with the Fed not buying US government bonds, but the US Treasury trying to issue even more after Trump's tax cut, the Treasury will need to offer higher interest rates, which makes government bonds an unattractive investment as rising yields implying falling prices for existing bonds. That is likely to both have negative effects on growth in the short run and make Australian Dollars less attractive in terms of interest yields. So, I'm a bit skeptical about the Australian Dollar rising strongly from here.

The US stock market is also very highly valued based on corporate earnings over the previous 10 years (Shiller's measure of stock market valuation, CAPE):

Historically, that has meant negative returns in the US market going forward. On the other hand, it is possible that something has changed and the risk premium for stocks has declined so that the stock market won't return to PE's as low as in past bear markets. It's unlikely that inflation would get as high as it did in the 1970s, which both raised the required rate of return and compressed growth profit. CAPE in Australia was 18.4 at the end of January, which is much more reasonable.

The best indicator of an oncoming recession is the yield curve. If short-run interest rates are higher than long-run interest rates, usually a recession follows. There is no sign of that at the moment in the US:


Wednesday, April 20, 2016

Superannuation Reform Again?

Changes to superannuation are a perennial topic. If the government does this - lower the threshold for the 30% super contributions tax to $180k income per year and cut the concessional cap to $20k p.a. - I figure I will have to pay almost $7,000 a year more in tax. My taxable income this year looks like being just below $180k but the threshold for the super surcharge adds things like employer super contributions and investment losses to the taxable income amount. It would make most sense to cut the non-concessional cap, which is currently $180k per year, dramatically, as that is the way that wealthy people can get really large amounts of money into the super system, which will be taxed at a zero rate once they retire. But, of course, there is no immediate revenue to be gained by cutting the non-concessional cap. To simplify the system the government could just get rid of the concessional/non-concessional distinction, stop taxing earnings and then have a simple US Roth style system. Much too logical, of course. Actually, the optimal solution, assuming that super will be taxed in some way is to go for the US 401(k)/403(b) approach where there is no tax on contributions or earnings and regular tax on payouts. This gives the the money the best opportunity to increase in value... well under some economic assumptions anyway.

Sunday, March 08, 2015

How Much Could We Save by Renting Our House out for a Year?

Bigchrisb commented on my recent post that we could save money by renting our new house out rather than going to live in it immediately. This is because the stamp duty paid to buy new properties is in this territory immediately tax deductible for investors. In Australia no costs of owner occupiers are tax deductible. So, I've calculated roughly what I think the financial gain from renting our house out for a year would be and come up with $18k:

The main deductions are the stamp duty, mortgage interest and depreciation. The first two we are going to pay ourselves anyway and so aren't actually additional costs while the latter is probably not a real cost, or we are going to suffer it anyway. Next there are property management fees, which might help in getting a tenant fast etc. and the difference between land tax on investors and rates on owner occupiers. There are real extra costs.

Assuming we could rent the house for one year at $650 a week we would earn $33800 in rent. So, the net income is -$34k and the tax saved at 40% is $13.5k. On the other hand we make $33.8k we would otherwise not have, but pay $25.8k in rent on our existing apartment that we would not have to pay if we lived in the new house as well as $3.7k in extra actual costs. So the net financial gain is $17.8k.

Let me know if you think I got something major wrong.

So, if we don't do this, economists would say that our revealed preference shows that the utility of living in our new house a year earlier and avoiding dealing with the hassles of being a landlord are worth at least $17.8k to us. For me, $17.8k is about 1.2% of net worth and so it's not enough to make a difference. It's not a lot more than our after tax salaries for one month. I asked Snork Maiden how big the number would have to be before she would be willing to do it and she said $50k. I know that if it was $100k I probably would do it :)

Friday, January 16, 2015

Paid Deposit

I delivered the 5% deposit check for the house to the lawyer this morning and she expects the deal will be locked in today or Monday. Then we sign the mortgage loan documents at the bank and the countdown to "settlement" starts. I had been planning to do a proper economic accounting for the house, but it is getting very complicated and I think I might take a really simple option instead. This would treat principal payments like today's deposit and the capital component of mortgage payments as saving and everything else as just consumption spending. And I won't try to compute a rate of return for this asset. Any gain in value above the amount saved into the asset will be a gain in net worth but won't be included in reports on our investment performance.

Saturday, November 24, 2012

Income per Capita in Australian States

According to this nominal income per capita in Western Australia is double that in the US and in the ACT double that in the UK. This shows the overvaluation of the Australian Dollar but also the high incomes in these states. I find the numbers hard to believe though. Nominal gross income per capita has doubled in the last decade but only increased by 50% in the decade before. These also imply that academic salaries have fallen back a lot relative to averages in the last 15 years. Snork Maiden's salary (not counting superannuation (retirement) contributions is less than average gross income per capita now. My salary at the same rank was about 50% above it back in 1996 when I first worked in Australia. It's hard to believe that a professional salary is less than income per capita (which includes children, retirees etc in the denominator), but that is what the ABS claims.

Saturday, April 28, 2012

Government Wimps Out and Makes Super More Complicated

So the government will increase the superannuation contributions tax to 30% but only for people who earn more than $300k per year. This is said to reduce the budget deficit by $1 billion. But if there are only 128,000 people earning more than $300k per year the total is:

128,000*$25,000*.15 = $480 million

To get to $1 billion you either have to assume that they are all over 50 with less than $500k in super in their accounts, or use 30% by mistake in the calculation. So everyone from $180k to $300k per year in income will get a 30% concession and those of us earning between $80k and $180k will get a 23% concession. But those earning more than $300k only a 15% concession. Of course, this doesn't make a lot of sense and makes super more complex. It would make much more sense to abolish the concessional tax on contributions and if that is too severe an increase in tax also cut the rate on superannuation earnings a little. This would make the system much simpler by getting rid of the distinction between concessional and non-concessional contributions, salary sacrificing etc. Of course, Labor is still hoping that public servants and maybe some others earning between $80k and $300k a year will still vote for them. So they haven't raised their tax.

Saturday, November 12, 2011

Of Course Compulsory Super is a Cost to Employees...

A reader asks the Sydney Morning Herald:

"Q The money that an employer ''compulsorily contributes'' to my super * comes from where? Is it my money contributed on my behalf by the employer, or is it the employer's money, begrudgingly contributed to my super because the government orders it?"

and the answer:

"A The contribution is a cost to employers and, although contributed on behalf of the employee, is not a cost to them unless they are employed under a salary-packaging arrangement."

While this might be legally correct it is absolutely not correct from an economic point of view. It reminds me of the claims back in 2000 from the government that the GST (=value added tax) wasn't a tax on business but just a tax collected by businesses from consumers for the government. If employers didn't have to make 9% contributions to super they would pay workers higher nominal wages by the same amount (presuming that workers value super and extra salary the same and so labor supply was unaffected which wouldn't be quite true). It is very much forced saving by workers. That doesn't mean there is anything wrong with it. It is a kind of behavioral economics policy - forcing people to save in their own interest because they wouldn't do enough of it otherwise.

* Super(annuation) is the retirement account system in Australia. Employers must by law contribute a minimum 9% of the stated salary on top of the salary actually paid to a superannuation account. This will be rising to 12% if current legislation is passed.

Friday, November 04, 2011

Australia is the Richest Country in the World by Far

When measured in terms of median wealth per individual in US Dollars at $220,000. Switzerland is richest in terms of mean wealth per individual. Both facts are in the Credit Suisse Wealth Report.

(HT: Enoughwealth)