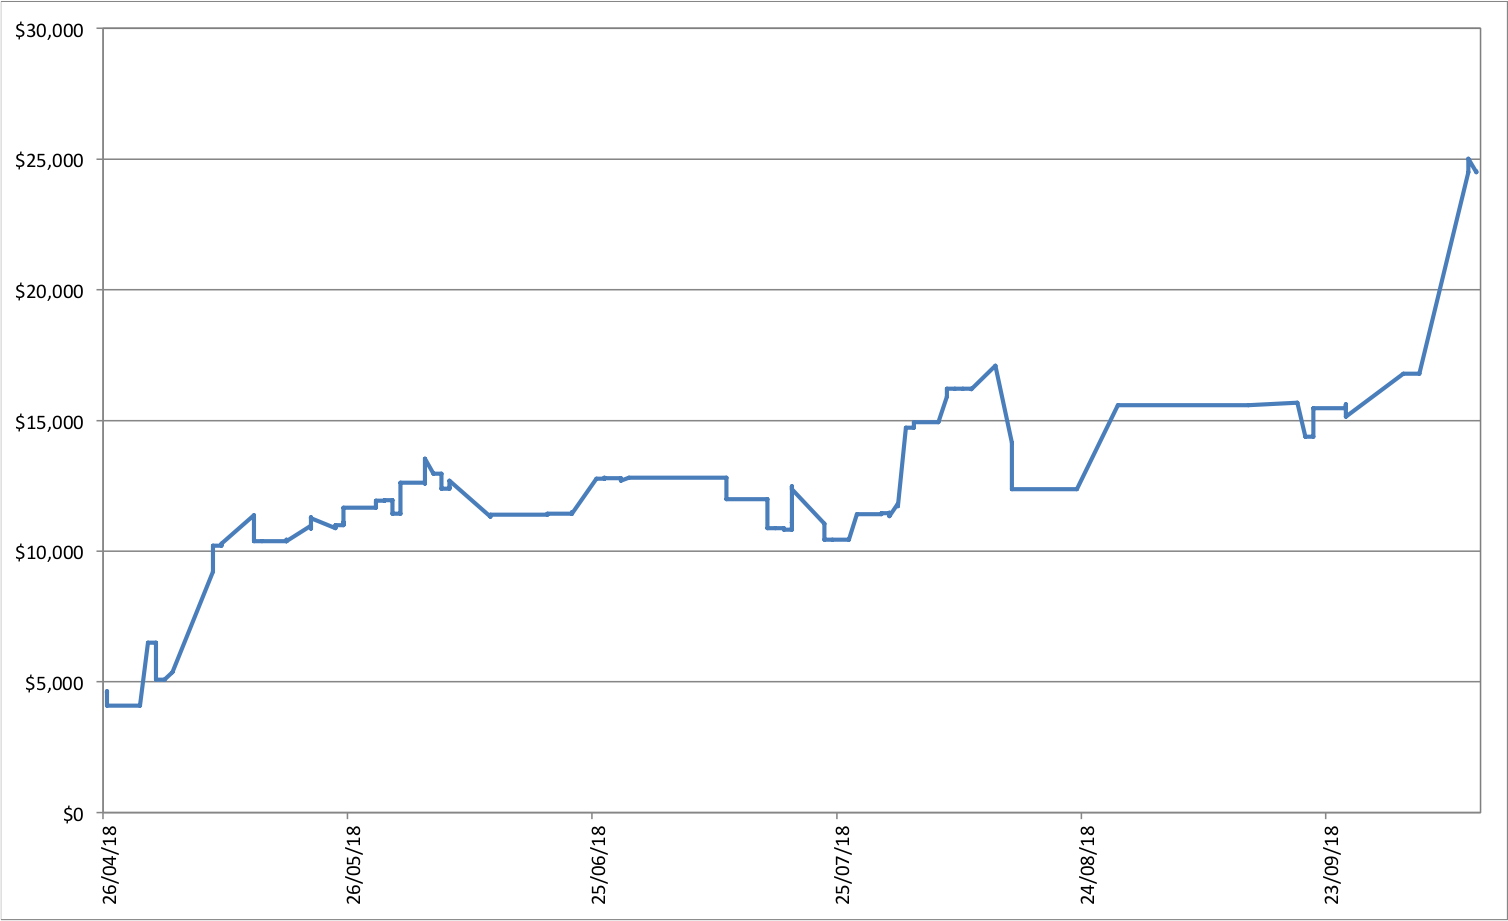
This is the equity curve trading NQ futures since the beginning of the trading experiment. It starts at about USD 4k because that was the cumulative profit for 2006-8. This isn't our total trading performance because I've also traded other things like ES futures and earned a little interest.
The little tick down at the end is the "bad trade", which wasn't so bad in the end, but that was mostly luck.
I've done a bit more programming and now the program produces a coherent list of trades, one for each day. But I've only written up part of the system yet, so you wouldn't want to actually trade them :) In fact, here is the fractional gain (i.e. 0.15 is 15% gain, not compounded) if you traded "the strategy" for this year:

In other words, it breaks even in the end, which is what you'd probably expect for a random set of trades. This kind of thing is now easy to produce, which is one of the main things this is all about.
To explain this curve, the model starts at long on 4th January and some of the code is written for what to do if you are long - it might tell you to switch to short, but not much code is written yet for what you should do if you are short. So there is little code to flip you back to long again. As a result the model is stuck on short for much of the time...
No comments:
Post a Comment