Showing posts with label Annual Reports. Show all posts

Monday, June 14, 2021

Investments Review: Part 5, Private Equity

The private equity category includes both venture capital, buyout funds, and SPACs, which acquire private companies to take them public.

WAM Alternatives (WMA.AX). Share of net worth: 4.32%. IRR: 16.9%. About a quarter of this fund is allocated to venture capital (one quarter is in real estate and half in real assets, mainly water rights). This fund was started by the failed Bluesky group and has now been taken over by Wilson Asset Management. The fund has traded deep below NAV. It has closed some of the gap but is still below NAV. I'm holding the fund mainly in the hope that eventually it trades at a premium to NAV and for exposure to real assets like water rights. The underlying performance is not that good. In 2020 it lost 3 cents per share in NAV to $1.08 per share while paying out 4 cents in dividends. This year, so far it's gained 6 cents per share, which I guess is OK.

Aura Venture Fund I. Share of net worth: 3.05%. IRR: 20.0%. This is an early stage venture capital fund run by Australian/Singaporean company Aura. It invests in Australian start ups. This fund actually has a negative tax rate – fund earnings are tax free and you get a 10% tax offset on your investment contributions. This is part of the Australian government's policy to encourage start-up companies. None of its investees has failed, though some are now valued below the fund's initial investment price. Some have done really well. Shippit is the star. Some investees have already been exited or are on the way there. The latest is Superestate, which is a residential real estate super fund acquired by Raiz. Superestate has been struggling due to the incompetence of the ATO. The fund is receiving shares in Raiz, which is listed on the ASX, which value the company below the carrying value. Hopefully, Raiz will do well and the shares will gain in value.

Pengana Private Equity (PE1.AX). Share of net worth: 2.40%. IRR: 15.3%. This fund invests in mostly North American private equity (but also in Europe) via funds managed by its partner Grosvenor Capital Management. There are a LOT of fees in this structure, but when I attended the pre-IPO presentation I was persuaded that there was still upside for investors. Initially the share price performed very well and I made money trading the stock. But then the firm issued more shares and the price has settled at NAV. It has struggled to make headway due to the rise in the Australian Dollar negating the gains on the underlying funds. So, the IRR mostly reflects my earlier trading.

3i (III.L). Share of net worth: 2.06%. IRR: 13.8%. This is my oldest private equity investment. I first invested in 2008, during the GFC. By investing in this company, you invest in the business itself, but also in its investments. The firm invests its own capital as well as managing outside funds. When I first invested, the firm invested in venture and buyout. It has pivoted to invest in buyout and infrastructure. It also manages far less outside money than it did. I haven't really been following the company in detail recently until I had to write this report. The proprietary capital is mostly invested in private equity. The fund invests mostly in Europe (but also in North America).

Aura Venture Fund II. Share of net worth: 1.40%. IRR: n.a. Based on the success of Aura VF I, I invested 2.5 times as much money in their next fund. It has not yet made any investments. The initial investment is 25% of the total. So, this would be about 5% of our current net worth when fully invested (not counting any returns on top of that).

Pershing Square Tontine Holdings (PSTH). Share of net worth: 1.35%. IRR: n.a. My newest investment. Pershing announced that they are going to acquire a 10% stake in Universal Music (UMG), which Vivendi is taking public in the next couple of months. But that will leave cash in PSTH and Ackman has a convoluted plan for keeping the company going as a private equity company, acquiring private companies and taking them public. Investors didn't like the UMG deal, but I think it is worth being in on the potential upside of future deals.

Tuesday, June 08, 2021

Investments Review: Part 4, Hedge Funds

Regal Funds (RF1.AX). Share of net worth: 5.63%. IRR: 45.7%. This is a multi-strategy hedge fund listed on the ASX that has performed very well since the COVID crash:

It has a beta of one to the stock market but has added a lot of alpha. The downside is that it has a trust structure and, therefore, pays out all profits in the form that they were earned in. So, it is not very tax-effective. We have now moved our holding to our SMSF. The stated focus is on Australian stocks, but they hold a lot of foreign stocks too.

Tribeca Global Natural Resources (TGF.AX). Share of net worth: 5.57%. IRR: 19.2%. This a global resource sector focused hedge fund listed on the ASX. From launch the price collapsed from $2.50 to under $1. They also lost a lot of money on a large loan to a US based coal mining company. They now have revised the investment guidelines to prevent a recurrence. The NAV is now above the IPO price and the stock price is almost there. We have gained a lot by buying when the price was depressed as well as in after-tax terms by selling when the price was depressed to take a tax loss.

Pershing Square Holdings (PSH.L). Share of net worth: 5.33%. IRR: 39.8%. This fund is listed on the London stock exchange but managed by Bill Ackman, a famous US hedge fund manager. The fund is very focused. They invest in around 10 large cap mostly US stocks at any one time. It is mostly a long fund. But they gained during the COVID crash by putting on a credit -ased hedge. Almost perfect market timing. The history of Pershing Square Holdings has been a bit erratic but since we invested it has been very good. The fund is still trading a lot below net asset value. Pershing Square Tontine Holdings has been in the news recently following its deal to buy 10% of Universal Music. I'm still not clear what will be the pay-off for PSH.L holders from this deal. Both PSTH and PSH fell on the news.

Cadence Capital (CDM.AX). Share of net worth: 3.80%. IRR: 10.2%. This is a long-biased long-short fund that mostly invests in Australian stocks. I invested in this fund when it had been performing well. Then, soon enough, it started to perform badly. Since the COVID crash it has done well. They also invested in a private investment in DeepGreen Minerals, which will be taken public by a SPAC for a huge gain on Cadence's investment price. I am thinking to trim my exposure to this fund once the price has built in the value of the DeepGreen Investment. There is no reason to hold both this and the Cadence Opportunities Fund, and this is also the worst performing of the hedge funds that I have held for at least a few years.

Cadence Opportunities Fund. Share of net worth: 2.76%. IRR: 41.6%. This fund was launched recently by the managers of Cadence Capital. This fund has performed extremely well. It is a long-biased long-short fund that trades more actively than CDM.AX. It was supposed to be listed on the ASX but the IPO failed and it became a private company. At the time I didn't invest. That was a bad decision. When a second opportunity to invest came up, I took it. Our IRR so far shows that was a good move.

Platinum Capital (PMC.AX). Share of net worth: 2.67%. IRR: 13.0%. I first invested in Platinum Capital back in 2001. Over time, we also held various unlisted versions of the fund. I have gained by trading the fund depending on whether the share price was above or below NAV. The fund's best performance was during the dot.com crash when I first invested in it. Most of the time since then it has underperformed the market but has also had lower volatility. In the last year, value investing has come back into favor and the fund has again been outperforming the market.

APSEC. Share of net worth: 2.07%. IRR: -7.5%. This is an unlisted Australian stocks focused hedge fund. They did very well in the COVID crash:

So, I invested in them, and then they haven't done so well since then.

Contango Income Generator (CIE.AX). Share of net worth: 1.41%. IRR: -11.9%. This is a very new investment, so the IRR likely is pretty meaningless. This listed fund recently changed strategy to a global equity long short portfolio managed by WCM Investment Management. This is supposed to be their track record:

This was the result of an activist campaign by Wilson Asset Management. It is supposed to be hedged into the Australian Dollar.

In summary, a bit more than half of our hedge fund exposure is to the Australian Dollar but there is definitely quite a lot more international than Australian equity exposure.


Saturday, May 29, 2021

Investments Review: Part 3, Small Cap Australian Equities

CFS Developing Companies. Share of net worth: 2.14%. IRR: 12.86%. This is one of my oldest investments. I originally invested in May 1997. However, I sold out again in 1998 and bought back in in 2001. Until recently, when I closed my CFS superannuation account, we had a larger position. It's performance relative to CFS's "custom benchmark" has been erratic. It has strongly outperformed over 10 years but underperformed over horizons up to 5 years. Still it gained 80% in the year up to March 2021 but that was less than the benchmark's 104% gain. However, I don't see any reason to change this investment, unless someone knows a better small cap Australian fund. Wilson Microcap (WMI.AX) is such a fund but trading at a big premium to NAV.

WAM Strategic Value. Share of net worth: 2.04%. IRR: Too new. We have applied for shares in this listed investment company that is in the process of IPO-ing and is managed by Wilson Asset Management. The fund's goal is mostly to invest in undervalued closed-end funds in Australia with the aim to closing the gap. It doesn't qualify as a hedge fund as far as I am concerned because it won't go short or use puts etc. As most of these funds are small caps, I'm categorizing it as a small cap investment.

CFS Future Leaders. Share of net worth: 1.00%. IRR: 10.37%. This is the oldest investment I still have. I originally invested in December 1996. This fund invests in somewhat larger companies than Developing Companies does. It has not performed as strongly in the long run. Like Developing Companies, it outperformed its benchmark over 10 years, though not as strongly, and has underperformed in recent years. I'm inclined to roll this into Developing Companies, despite nostalgia.

Domacom (DCL.AX). Share of net worth: 0.73%. IRR: -3.04%. This is a company rather than a fund and its business is fractional property investment. The company has developed a series of innovative products but has struggled to increase funds under management and so continues to make large losses. My thesis for investing was that they would likely get acquired by a larger financial player who could put a lot more funds into their products. Really it is surprising that this is a listed company rather than a venture capital sponsored investment. Now the company has "voluntarily suspended" its shares because ASIC is investigating its merger/takeover of a company called AustAgri that has made all kinds of wild claims the most solid of which was it was buying Cedar Meats in Melbourne. Why they would want to become a Domacom managed fund, paying management fees to Domacom was not clear. In return they were supposed to receive Domacom shares. Whatever the outcome of this is I don't think this will be a complete loss, because again I think they could sell the platform. I don't have any choice but to hold at the moment.

Sunday, May 16, 2021

Investments Review: Part 2, Long-only Large Cap Equities

For the second part of the investments review, I am looking at our long-only large cap equities funds. Usually, I would divide these into Australian large cap, U.S., and rest of world equities, but Hearts and Minds spans all of these and Generation the last two. The funds all have strong IRRs. Note that the IRR of an investment depends both on its underlying performance and our trading and timing.

Hearts and Minds (HM1.AX). Share of net worth: 4.13%. IRR: 27.52%. This fund invests across Australia and global markets by picking the best ideas of a set of fund managers. 35% of the portfolio is allocated according to the stocks pitched at the annual Sohn Hearts and Minds Conference. 65% is allocated according to the best ideas of six core fund managers: Caledonia Investments, Cooper Investors, Magellan Financial Group, Paradice Investment Management, Regal Funds Management, and TDM Growth Partners. Instead of charging management fees, the fund contributes 1.5% of NAV to charity every year. Since inception, this fund has performed very well. On the other hand, it has been weaker this year as the conference stocks this time are mostly high growth stocks, which are now falling out of favor:

The China Fund (CHN). Share of net worth: 1.77%. IRR: 16.00%. This is a closed-end fund investing in Chinese stocks. There have been changes of manager over time and the latest manager seems to be doing well:

The reason to hold this fund is to tilt towards exposure to emerging markets. I think our diversified funds have a relatively low exposure to emerging markets, though it's impossible to get that information for most of them. OTOH, one of our "hedge funds", Platinum Capital has a 17% allocation to China and Hong Kong and 2% to India. So, this seems a good fund to get that exposure through. But is almost one third of our allocation to "rest of the world stocks" too much?

Generation Global Fund. Share of net worth: 1.60%. IRR: 16.50%. This fund is hosted on the Colonial First State platform and is closed to new investors. We are automatically adding AUD 400 to this fund every month. The question is whether to raise that or stop contributing to funds outside of super altogether. The fund is managed by Generation Investment Management, who are an ESG fund manager. Compared to the MSCI World Index it has a beta of 1.11 and annual alpha of 3.2% over the last five years. So, this is a good long-only fund.

Fortescue Metals (FMG.AX). Share of net worth: 1.60%. IRR: Too new. I very recently switched out of Treasury Wines and into this stock, which so far has been a very bad move. I guess I just like to do some trading with a small part of the portfolio. I am hoping this will pay nice franked dividends and that I at least won't lose capital value in the long term.

Colonial First State Imputation Fund. Share of net worth: 0.99%. IRR: 18.00%. This fund invests in large cap Australian stocks with strong "franked" dividends. There is little logic to hold both this fund and Argo Investments... Argo has a much lower management fee. On the other hand, this fund has outperformed the benchmark on many time scales despite the high management fee (0.96%):

So, if we retain this account, then I think this fund makes sense as one of the investments.

Berkshire Hathaway (BRK/B).  Share of net worth: 0.87%. IRR: 9.80%. My thesis for investing in Berkshire is here. Berkshire is providing more exposure to the US market in the SMSF.

Argo Investments (ARG.AX). Share of net worth: 0.79%. IRR: 23.03%. This is a closed end fund (listed investment company) investing in mainly large cap Australian shares. The expense ratio is only 0.15%! Timing has boosted our IRR for this fund... The fund has outperformed the benchmark recently and over 20 years, but not over the interim time frames:

So, maybe this isn't such a good idea? I recently invested again in this fund to get more exposure to the Australian market after rolling over my Colonial First State superannuation fund into the SMSF. Note that the share price performed poorly recently as the premium to NTA fell, after which we purchased the fund.


Saturday, May 15, 2021

Investments Review: Part 1, Diversified Funds

After noting that we had at a conservative count, 40 different investments, I thought it'd be a good idea to do a review of all of them to see what makes sense and what doesn't. Maybe my readers will learn about some interesting investments too. Or about what not to invest in. Each post will look at one type of investment starting with diversified funds. Shares of net worth don't include our house in net worth.

Unisuper Balanced Fund. Share of net worth: 10.02%. IRR: 10.64%. This is my employer superannuation fund. I think in theory we could have contributions made to another fund instead but then they would only pay the 9.5% (of salary p.a.) superannuation guarantee instead of 17%! What I do have an option to do is to switch to other investment options within Unisuper. I also think I could rollover the investment into another fund such as our SMSF. The balanced fund is diversified across Australian stocks (33%), international equities (27%), bonds (30%), property (5%), and infrastructure and private equity (5%). It is one of the better performing balanced super funds in Australia. I used to invest more aggressively by investing in the growth option instead. Unless our SMSF outperforms strongly, I'm inclined to leave this as it is.

PSS(AP) Balanced Fund. Share of net worth: 9.16%. IRR: 9.41%. This is Moominmama's employer superanniation fund. It's not quite as well-performing as Unisuper. They only offer four investment options now. There used to be more. They provide even less information about their investments than Unisuper do. Generally, it's amazing how little information most Australian fund managers provide compared to U.S. fund managers. The fund is allocated across equities (56%), bonds (18%), hedge funds (15%), and real assets (11%). I think there is a similar condition on fund choice.

Colonial First State Diversified Fund. Share of net worth: 3.12%. IRR: 10.31%. I contribute automatically AUD 500 into this fund each month. Before rolling over my CFS superannuation account into our SMSF we had a lot of superannuation invested in this fund too. There isn't really a strong justification for holding this fund, especially given the 20% of net worth that we have invested in the two superannuation funds above. Selling would mean a capital gains tax bill, but I'm really not sure why I am continuing to put money into the fund. The CGT bill would actually not be that big as the distributions have been taxed all along the way. The fund is allocated 30% to Australia shares, 20% to global shares, 30% to bonds, 5% to property securities, 5% to infrastructure securities, and 10% to "real return". It has returned 7.78% p.a. in the last ten years to March, which is less than our portfolio return.

CREF Social Choice. Share of net worth: 1.66%. IRR: 13.33%. This fund is 40% U.S. stocks, 20% rest of the world stocks, and 40% bonds with an ESG overlay. I use this as the core fund in my former U.S. employer retirement fund (403b account). Apparently, my market timing since 2002 when I first invested in this fund has paid off to boost the IRR. I have been both more aggressive and more conservative in the allocation in this account. It has returned 8.33% in the last ten years and outpaced the relevant Morningstar benchmarks. The question is whether to be more aggressive in this account and shift to the Global Equities option instead.

Ruffer Investment Company (RICA.L). Share of net worth: 0.97%. IRR: Too new. This is an extremely new investment that plays more of the role of a hedge fund in the portfolio. But as it doesn't use shorting or charge a performance fee I've classified it as a diversified fund. The allocation is 9% U.S. stocks, 31% rest of the world equities, 39% bonds (mostly index linked), 8% gold, and 13% in what they describe as "illiquid strategies" and options. The illiquid strategies seem to be hedge funds specialising in mitigating tail risk. I'm counting this part of the fund towards our hedge fund allocation.

Saturday, January 09, 2021

Contributions of Individual Investments 2020


As promised, here are the contributions of each of 62 investments to our annual investment return. Of course, these numbers (in Australian Dollars) depend on the size of each investment and I don't make any attempt to work out or compile the annual rate of return on all these investments (I do compute it for some). 

Compared to last year, gold again is a top contributor and Hearts and Minds and Pershing Square Holdings are gain near the top. Cadence Capital had a turn around this year for the positive and Platinum Capital for the negative. The large super funds did OK but last year they were the two top contributors.

There were two big disasters this year. Winton Global ALpha had a terrible performance losing 18% and Virgin Australia bonds were almost totally wiped out in the airline's bankruptcy.

The total number of investments was smaller this year as we gradually ran off our individual bond holdings and traded much less.


Tuesday, January 05, 2021

Annual Report 2020

Overview 
The main financial themes of this year for us was continuing to invest the money we inherited in late 2018 and surprisingly strong investment returns for the year after the sharp fall in markets in March due to the COVID-19 pandemic. In my academic career I was also surprisingly productive in the second half of the year following the struggle of dealing with closed schools and our move to online teaching in the first half of the year. We spent less for the year overall because of a reduction in spending during the lockdown and no travel. Our house fell in value, which was against the trend in the Australian housing market.

 
All $ signs in this report indicate Australian Dollars. As I did last year, I'll do a separate report on individual investments.

Investment Returns 
In Australian Dollar terms we gained 11.9% for the year and in USD terms we gained 23.2% because the Australian Dollar gained 10%. The MSCI gained 16.8%  in USD terms and the ASX 200 only 2.6% in AUD terms. The HFRI hedge fund index gained 8.9% in USD terms. Our target portfolio is expected to gain 6.8%. So, we beat all benchmarks this year.
 
This chart compares our portfolio to the benchmarks in Australian Dollar terms over the year:

 
We tracked the MSCI World Index very closely till May. After that we started to diverge. I posted equivalent Australian Dollar returns in the December monthly report. Here are annualized returns over various standard periods:


US Dollar returns are not very good over longer periods, but they still beat the HFRI, especially over the 3-5 year horizon. Here are the investment returns (currency neutral) and contributions of each asset class in 2020:
 
The contributions to return sum to the total portfolio return. Hedge funds and private equity had the highest returns and hedge funds by far the largest contribution to total return. Gold had the third highest return and the second highest contribution to total return. The rate of return on bonds is surprisingly good actually given the almost total loss of our Virgin Australia investment.

Investment Allocation
The main changes in allocation over the year was that we ran down our bonds allocation while increasing hedge funds, private equity, and gold mostly:
We started investing in art, which for the moment is grouped together with real estate.

Accounts
Here are our annual accounts in Australian Dollars:


There are lots of quirks in the way I compute the accounts, which have gradually evolved over time. There is an explanation at the end of this post. 

We earned $128k after tax in salary, business related refunds, medical payment refunds, tax refunds etc. This was down 13% on 2019 because Moominmama worked less and we had large tax bills due to investment income (investment income is reported pre-tax). We earned (pre-tax including unrealized capital gains) $370k on non-retirement account investments. The latter number was up on from last year. The former number continued its decline. The investment numbers suffered from the rise in the Australian Dollar ($67k in "forex" loss). Total current income was $498k. Not including mortgage interest we spent $121k. Total spending was down 18% on 2019 due to reclassifying mortgage interest as an investment cost since we paid off and redrew the mortgage and reduced spending due to the pandemic. Not counting mortgage interest, spending was down 9%.

$10k of the current pre-tax investment income was tax credits – we don't actually get that money so we need to deduct it to get to the change in net worth. We transferred $45k into retirement accounts from existing savings in "non-concessional (after tax) contributions. I list $2.4k of "inheritance". This is mostly due to adding the value of a painting I inherited, which I already had but hadn't included in net worth. The only other "things" included in our net worth are our car, a gold coin, and our house.

 
The change in current net worth, was therefore $324k. Looking at just saving from non-investment income, we dissaved $37k. So, before the transfer to retirement accounts we saved about $8k from salaries etc.

The retirement account is a bit simpler. We made $44k in pre-tax contributions (after the 15% contribution tax) and made an estimated $65k in pre-tax returns, which was strongly down on 2019. $8k in "tax credits" is an adjustment needed to get from the number I calculate as a pre-tax return to the after tax number. Taxes on returns are just estimated because all we get to see are the after tax returns. I do this exercise to make retirement and non-retirement returns comparable. Net worth of retirement accounts increased by $146k.

Finally, the housing account. I estimate that our house lost $34k in value. As our mortgage is now included in the current investment account there are no other entries in the housing account now.
 
Total investment gains were $401k, up 8% on 2019.

Total net worth increased by $436k,  which was up 12% on last year. $51k of this was from saving from non-investment sources, up 7% on last year. Thanks to employer superannuation contributions this was 30% of our total after tax non-investment income. Including investment gains our savings rate was 78% of our comprehensive after-tax income.


How Does This Compare to My Projection for This Year?
At the beginning of the year, I projected a gain in net worth of $425k, which turned out to be almost exactly correct. The baseline projection in my spreadsheet for 2021 is for a very high 19% rate of return, a 6% increase in spending, and flat other income, leading to an $800k increase in net worth to around $5.7 million. A more sensible projection would be for another $400k increase to around $5.3 million. Of course, anything could happen.
 
Notes to the Accounts
Current account includes everything that is not related to retirement accounts and housing account income and spending. Then the other two are fairly self-explanatory. However, property taxes etc. are included in the current account. Since we notionally converted the mortgage to an investment loan, mortgage interest is counted in current investment costs. So, the only item in the housing account now is increases or decreases in the value of our house. This simplified the accounts a lot but I still keep a lot of cells that might again be used in the future.
 
Current other income is reported after tax, while investment income is reported pre-tax. Net tax on investment income then gets subtracted from current income as our annual tax refund or extra payment gets included there. Retirement investment income gets reported pre-tax too while retirement contributions are after tax. For retirement accounts, "tax credits" is the imputed tax on investment earnings which is used to compute pre-tax earnings from the actual received amounts. For non-retirement accounts, "tax credits" are actual franking credits received on Australian dividends and the tax withheld on foreign investment income. Both of these are included in the pre-tax earning but are not actually received month to month as cash.... 
 
For current accounts "core expenditure" takes out business expenses that will be refunded by our employers and some one-off expenditures. This year, there are none of those one-off expenditures. "Saving" is the difference between "other income" net of transfers to other columns and spending in that column, while "change in net worth" also includes the investment income.

Friday, January 01, 2021

2020 Performance of Interactive Brokers Accounts

Inspired by Financial Samurai's post, here are the track records of our two Interactive Brokers accounts over 2020.

Moominpapa (in USD and compared to the S&P500):

This is the kind of result we are trying to achieve with our investment strategy and why we don't just invest in index funds. The only ETF we invest in is IAU - a gold ETF.

Moominmama (in AUD):


On the IB platform, I can only compare this inappropriately to US Dollar indices. By comparison, the ASX200 gained only 1.27% for the year. At the end of March it was down 23% for the year and so probably fell about as much as this portfolio did at the worst point a few days earlier. This is a pleasing result, though less downside would be nice, but then this is just a relatively small part of our total portfolio.


Sunday, December 06, 2020

Breakdown into Taxes, Spending, and Saving

Following up on yesterday's post on our spending over time in different categories, I made another pretty graph, this time of the breakdown of income into taxes, spending, and saving. Everything is in Australian Dollars:


Total income is our gross income on our tax returns plus superannuation contributions that are not on our tax returns. This means that it includes taxable investment income. As a result, current saving looks quite big, but saving from our salaries is much smaller than this, nearer to AUD 20k per year. Superannuation contributions include employer and salary sacrifice contributions and not "non-concessional contributions", which I treat as transfers from current savings totaling AUD 180k during this period.

Mortgage principal payments were low last year when I paid off and redrew the mortgage. Even though in my investment performance reports I now include mortgage interest as an investment cost, for the purposes of these posts on spending I include it in housing costs to make our numbers more comparable to other people's. Investment costs are mostly margin interest as well as other fees. Taxes include income and property tax.

Saturday, December 05, 2020

Spending Over the Last Four Years

The chart shows our spending over the last four Australian tax years. The 2020-21 figures are an estimate based on the first five months of the year:

This year's spending is predicted to be lower than last due partly to COVID-19 and a lack of major house maintenance expenditure this year. Travel and cash spending have gone from significant items in 2017-18 to almost nothing or nothing this year. I deliberately reduced cash spending when I started this tracking of our spending in order to make tracking easier. The category that seems to have increased the most is childcare and education, which is not surprising as we went from one child in daycare only a few days a week to two children for more days of the week. The childcare subsidies we got have also been reduced. 

Also of interest are restaurants, which are the tiny sliver above supermarkets, which also declined a lot this year for obvious reasons (I think I got food delivered from a restaurant maybe a couple of times ever in my life). In 2017-18, restaurants were very low because I would usually pay with cash then. Really, restaurant spending was much higher than shown in the first two years. Last year it was AUD 3k and this year is estimated to be AUD 1k. Travel only includes flights and accommodation.

Sunday, July 05, 2020

2019-2020 Spending

Here is our spending for the Australian financial year 2019-2020. The shaded areas are sub-categories of the main categories above them. The table also shows the spending shares in the previous financial year and the change in share. These numbers include some spending that we don't include in our usual monthly reports to make the report more comparable to others you might see online. This includes mortgage interest and life insurance. Health insurance and medical expenses are net of reimbursements by the health insurer and the government. All numbers are in Australian Dollars.

Monthly spending increased from $10.7k to $12k (USD 8,250). This is more than my after-tax salary... Housing was again the largest spending category but supermarkets overtook health as the second largest. Spending on mail order and childcare and education are now both ahead of health. The shares of health and housing fell the most due to reduced mortgage interest and medical spending. Our second child was born 26 June 2019 and expenditure around that was mostly incurred in the previous financial year but we got some reimbursements in this financial year. Mortgage interest was down because we had a lot of money in our offset account leading up to the "mortgage inversion" and because the loan is just getting smaller and interest rates are falling.

I spent a lot more on taxis and Uber (I don't have a driving licence). A lot of this was because in the early months of Moominmama's maternity leave I took Moomin to daycare at her workplace before going on to my work. But also, I am getting less patient with the time it takes to get around on public transport when I have increased childcare duties. When it's convenient I get a bus, when it's not I get an Uber or taxi.

Childcare expenditure rose because we now have two children and because we got a lot less subsidy as our income rose. On the other hand, after the pandemic started we got free childcare, so this category will rise even more next year, probably. Mail order spending was up 86% on last year. This is partly because after Moominmama went on maternity leave she did a lot more mail order. But department store (all non-supermarket goods retail) and supermarket spending were also up. Across the three categories, spending was up 47%. Cash spending fell further to just $1,600, though some of the supermarket spending includes cash withdrawals by Moominmama.

I'm also tracking income, tax, and savings in the same spreadsheet. But these numbers are all still really uncertain until we are ready to submit our tax returns in a few months time. Very roughly, half our income goes to spending, a quarter to tax, and a quarter to saving.


Thursday, January 09, 2020

Contributions of Individual Investments 2019

Here are the contributions of each of 86 individual investments or trading vehicles in the 2019 calendar year (Australian Dollars):


Of course, these deoend on how much we have invested in each one and the superannuation funds that head the list are our biggest investments.

Annual Report 2019

Investment Returns
In Australian Dollar terms we gained 12.61% for the year and in USD terms we gained 12.16%. This is a lot less than stock markets gained, but I now prefer to compare our performance to the average hedge fund, which gained 10.35% in USD terms. The MSCI gained 27.3%  in USD terms and the ASX 200, 25.6% in AUD terms. These are the US Dollar returns month by month compared to the MSCI and HFRI indices:


We followed HFRI very tightly until September, when, apparently because of an increase in the volatility of the Australian Dollar, our performance became more volatile than the hedge fund index.
I posted equivalent Australian Dollar returns in the December monthly report. The next chart shows long term returns in Australian Dollar terms compared to the MSCI, ASX200, and the target portfolio:


In recent years, we've followed the target portfolio quite closely. Here are annualized returns over various standard periods:

US Dollar returns are not very good over longer periods, but they still beat the HFRI, especially over the 3-5 year horizon.

Investment Allocation
The main change in allocation over the year was that we converted cash into bonds and gold and then began to run down the bond allocation mostly in favor of hedge funds:


Also, at the beginning of the year, I was still a part owner of my mother's apartment, which was then sold.

Accounts
Here are our annual accounts in Australian Dollars:


There are lots of quirks in the way I compute the accounts, which have gradually evolved over time. There is an explanation at the end of this post.

We earned $152k after tax in salary, business related refunds, medical payment refunds, tax refunds etc. We earned (pre-tax including unrealized capital gains) $251k on non-retirement account investments. The latter number was up strongly from last year. The former number continued its decline. The investment numbers benefited from the fall in the Australian Dollar ($40k in "forex" gain). Total current income was $403k. Not including mortgage interest we spent $133k. Total actual spending including mortgage interest was $147k, which was up 12.3% on last year.

$9k of the current pre-tax investment income was tax credits – we don't actually get that money so we need to deduct it to get to the change in net worth. We transferred $135k into retirement accounts from existing savings in "non-concessional (after tax) contributions. Near the end of the year we paid off the mortgage. Including mortgage payments during the year, that meant a total $520k transferred to our housing account.


The change in current net worth, was therefore -$394k. Looking at just saving from non-investment income, we dissaved $636k. Both these are crazy numbers...

The retirement account is a bit simpler. We made $46k in pre-tax contributions (after the 15% contribution tax) and made an estimated $204k in pre-tax returns. $23k in "tax credits" is an adjustment needed to get from the number I calculate as a pre-tax return to the after tax number. Taxes on returns are just estimated because all we get to see are the after tax returns. I do this exercise to make retirement and non-retirement returns comparable. Net worth of retirement accounts increased by $362k.

Finally, the housing account. I estimate that our house gained $24k in value. We spent $15k on mortgage interest. We would have paid $17k in mortgage interest if we didn't have an offset account. After counting the transfer of $520k into the housing account housing equity increased $527k of which $504k was due to paying off principal on our mortgage.

Total net worth increased by $495k, $48k of which was saving from non-investment sources. These numbers are steeply down from last year. The net worth increase last year mostly came from the inheritance.

Though our saving is down sharply on last year, we still saved in total 24% of our after tax non-investment income. Of course, this is less than last year's 33% and 2017's 54%! Including investment income our savings rate was 77%. This is based on our income calculated here at a ridiculously high $643k.

How Does This Compare to My Projection for This Year?
At the beginning of the year, I projected a gain in net worth of only $60k based on an 0% return on investments and a 6% increase in spending. As you can see, spending rose 12% and return on investments was also about 12%. As a result net worth increased by $495k. So, this was a big forecasting fail, as was last year's projection.

So, it's probably a mistake to try to make a projection for 2020 :) The baseline projection in my spreadsheet is for a 12% rate of return, a 6% increase in spending, and flat other income, leading to a $425k increase in net worth. I expect that forecast will fail big time again.

Notes to the Accounts
Current account is all non-retirement accounts and housing account income and spending. Then the other two are fairly self-explanatory. But housing spending only includes mortgage interest. Property taxes etc. are included in the current account. There is not a lot of logic to this except the "transfer to housing" is measured using the transfer from our checking account to our mortgage account. Current other income is reported after tax, while investment income is reported pre-tax. Net tax on investment income then gets subtracted from current income as our annual tax refund or extra payment gets included there. Retirement investment income gets reported pre-tax too while retirement contributions are after tax. For retirement accounts, "tax credits" is the imputed tax on investment earnings which is used to compute pre-tax earnings from the actual received amounts. For non-retirement accounts, "tax credits" are actual franking credits received on Australian dividends and the tax withheld on foreign investment income. Both of these are included in the pre-tax earning but are not actually received month to month as cash.... Finally, "core expenditure" for housing is the actual mortgage interest we paid. "Expenditure" adds back how much interest we saved by keeping money in our offset account. We include that saved interest in the current account as the earnings of that pile of cash. That virtual earning needs to be spent somewhere to balance the accounts... It is also included in the "transfer to housing". Our actual mortgage payments were less than the number reported by the $2k in saved interest. For current accounts "core expenditure" takes out business expenses that will be refunded by our employers and some one-off expenditures. This year, there are none of those one-off expenditures. "Saving" is the difference between "other income" net of transfers to other columns and spending in that column, while "change in net worth" also includes the investment income.

Thursday, October 10, 2019

2018-19 Income and Spending Breakdown

After doing our tax returns I can now report the breakdown of income and spending for the 2018-19 financial year, following up on the breakdown for 2017-18:


On the right there is a breakdown of some of the larger categories into sub-categories. Unlike some bloggers I can't say what we spend on food, or clothes etc. I just know how much we spend at different sorts of retail outlets.

One of the biggest changes from last year is the reduction in cash spending from 13% to 3.5% as we started to use credit and debit cards more to track our spending better. Restaurants is up as former cash spending was converted to spending using cards. Other major changes are:
  • An increase in health spending from 7% to 16% due mainly to costs of pregnancy/childbirth. 
  • A major increase in housing spending from 16% to 26% as we undertook renovation work and paid more mortgage interest due to having less money in our offset account.
  • A major reduction in travel from 14% to 3% as we only went on a trip to Sydney this year instead of to Europe and Japan.
These trends all continued in the first quarter of this financial year, just completed.

Income was up strongly on the previous year, mainly due to futures trading. As a result, taxes were also up strongly to over AUD 100k. OTOH total spending and saving also rose strongly. Note that "current saving" here is much higher than my usual definition of saving, which only includes saving from salaries and similar income. Here, total income includes investment income and so saving is correspondingly higher.

Wednesday, January 30, 2019

Understanding Increase in Spending Better

I wanted to understand why spending in the 2018 calendar year was up 28% on 2017. The first step was computing a spending breakdown for the 2017-18 financial year. The period is different and the definitions of income and spending are different than in my usual accounts to make it more comparable with other income and spending breakdowns on the web. I now computed the spending breakdown for the second half of 2018 and we can compare monthly spending in this period to that in 2017-18:


Spending was up by 7.5%. So not as dramatic a growth rate. The biggest difference between the two periods, is that in the first period we spent a lot on travel and in the second on health. In fact, the travel spending was mainly in the second half of 2017-18 - i.e. in the first half of 2018. So, 2018 had high spending because of both travel and health spending being up strongly on 2017. The way I usually compute spending and income is to include any refunds for medical spending as income rather than reducing spending by the amount of the refund, which I am doing here. So, that pushed up spending even more. I'm glad I now understand why our spending increased so much.

Another major change is that cash spending was down in the second half of 2018. That was because I had access to the statement for my Qantas Cash card – only the last 13 months is online. In the previous period, I treated all spending on the card as cash spending.

Going forward, I expect medical expenses to be lower this half year and travel expenses to be much lower than in the first half of 2018. Given that, 2019 calendar year spending might be lower than 2018 spending.

Saturday, January 26, 2019

Spending Breakdown

After a discussion with friends at lunch yesterday and some blogposts I read recently, I decided to try to find out what we are spending on. I haven't done this in more than two decades I think. I looked at the 2017-18 financial year so that I can also easily include official income and tax figures in the total. It's all in Australian Dollars of course:


Income is gross income from our tax returns plus employer superannuation contributions which which don't enter taxable income. Income includes salaries and investment income etc.

Next we deduct taxes. As franking credits – tax credits for corporation tax paid by Australian companies are included in taxable income, they need to be deducted as we don't actually get the cash.  Then there is 15% tax on superannuation (retirement) contributions. In total tax is 26% of gross income. Next I deduct some financial costs that are deducted from gross income to get to taxable income. There are more of these deductions actually, but some I have included in our spending.

Of the AUD 216k of net income half was spent and half saved.

The big spending items are mortgage interest, supermarkets etc, cash spending, mail order, childcare etc, and travel (flights, accomodation etc). Cash spending includes both spending actual cash and spending using our Qantas cash cards. I haven't gone into the accounts for the latter, though maybe I should. Some of the other spending categories very low compared to the actual amount spent on these because a lot of the spending is in cash. Possibly the most important of these is restaurants. Yes, there is a lot of fuzziness in these numbers because we don't budget and spend a lot in cash.

Am happy to get feedback on how we can save money, though I'm not really into "frugality" for it's own sake. Or maybe you would just like to compare the differences with other posted spending breakdowns.

P.S.
Qantas only provide online statements for the last 13 months. So, I can't now do a breakdown of those accounts for 2017-18. Maybe next year.

Saturday, January 12, 2019

Annual Report 2018

Investment Returns
In Australian Dollar terms we gained 2.3% for the year while the MSCI gained 0.9% and the ASX200 lost 1.1% (all pre-tax including dividends). In USD terms we lost 7.7%, while the MSCI lost 8.9% and the S&P500 lost 4.4%. So we beat Australian and international markets but not the US market. In the longer term perspective, our returns and market returns were closely aligned this year:

Australian Dollar Returns


Here are returns over various standard periods (not annualized):


We have done well compared to the ASX 200 over the last 5 years. Not as great over 10 years. In USD terms we have done well compared to the MSCI over the last three years and underperformed over longer time periods.

Investment Allocation
The main change in allocation over the year is the large increase in cash and real estate when we received the inheritance:

I also reduced my allocation to Australian large cap stocks around the same time, in early October. Earlier in the year, the allocation to cash falls as we increased trading and invested more in the Winton Global Alpha Fund (commodities) and subscribed to some IPOs. Private equity also increased with investment in Aura and IPE and then decreased with the takeover of IPE.

Accounts
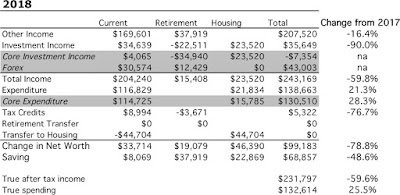
I stopped reporting monthly accounts this year, but I've still been computing them. Here are our annual accounts in Australian Dollars without including the inheritance:

Annual Accounts

There are lots of quirks in the way I compute the accounts, which have gradually evolved over time. Here is an explanation:

Current account is all non-retirement accounts and housing account income and spending. Then the other two are fairly self-explanatory. But housing spending only includes mortgage interest. Property taxes etc. are included in the current account. There is not a lot of logic to this except the "transfer to housing" is measured using the transfer from our checking account to our mortgage account. Current other income is reported after tax, while investment income is reported pre-tax. Net tax on investment income then gets subtracted from current income as our annual tax refund or extra payment gets included there. Retirement investment income gets reported pre-tax too while retirement contributions are after tax. For retirement accounts, "tax credits" is the imputed tax on investment earnings which is used to compute pre-tax earnings from the actual received amounts. For non-retirement accounts, "tax credits" are actual franking credits received on Australian dividends and the tax withheld on foreign investment income. Both of these are included in the pre-tax earning but are not actually received month to month as cash.... Finally, "core expenditure" for housing is the actual mortgage interest we paid. "Expenditure" adds back how much interest we saved by keeping money in our offset account. We include that saved interest in the current account as the earnings of that pile of cash. That virtual earning needs to be spent somewhere to balance the accounts... It is also included in the "transfer to housing". Our actual mortgage payments were less than the number reported by the $6k in saved interest. For current accounts "core expenditure" takes out business expenses that will be refunded by our employers and some one-off expenditures. This year, I think there are none of those one-off expenditures. "Saving" is the difference between "other income" net of transfers to other columns and spending in that column, while "change in net worth" also includes the investment income.

We earned $170k after tax in salary, business related refunds, medical payment refunds, tax refunds etc. We earned (pre-tax including unrealised capital gains) $35k on non-retirement account investments. Both of those numbers were down strongly from last year. I stepped down from an admin role that paid extra salary and earned less in consulting etc. The investment numbers would have been worse without trading and the fall in the Australian Dollar ($31k in "forex" gain). Total current after tax income was $204k. Not including mortgage interest we spent $117k – Total actual spending including mortgage interest was $133k.

$9k of the current pre-tax investment income was tax credits – we don't actually get that money so we need to deduct it. Finally, we transferred $45k in mortgage payments (and virtual saved interest) to the housing account. The change in current net worth, was therefore $34k. Looking at just saving from non-investment income, we saved $8k. Both these numbers are down steeply from last year.

The retirement account is a bit simpler. We made $38k in contributions (after the 15% contribution tax) and the value fell by an estimated $23k in pre tax returns. $4k in "tax credits" is an adjustment needed to get from the number I calculate as a pre-tax return to the after tax number. Taxe on returns are just estimated because all we get to see is the after tax returns. I do this exercise to make retirement and non-retirement returns comparable. Net worth of retirement accounts increased by $19k.

Finally, the housing account. We spent $16k on mortgage interest. We would have paid $24k in mortgage interest if we didn't have an offset account. I estimate our house is worth $24k more than I did last year based on recent sales in our neighbourhood. After counting the transfer of $45k into the housing account housing equity increased $46k of which $23k was due to paying off principal on our mortgage.

Total net worth increased by $99k, $69k of which was saving from non-investment sources. Comparing 2018's accounts with 2017's, we saved 49% less and net worth increased by 79% less. Total after tax income was almost $230k, down 60% on last year. This number feels a lot more "reasonable" than last year.

Though our saving is down sharply on last year, we still saved in total 33% of our after tax non-investment income. Of course, this is less than last year's 50%. Including investment income our savings rate was 43%.

Here are the same accounts expressed in US Dollars:


How Does This Compare to My Projection for This Year?
At the beginning of the year, I projected a gain in net worth of $250k based on an 8% return on investments and a 6% increase in spending. As you can see, spending rose 25% and return on investments was only 2%. As a result net worth increased by only $99k.

Looking to 2019, I think we will be lucky if our investment return is 0%, as I am quite bearish about the world economy and stockmarket. If I pencil in a 6% rise in spending, then we would only increase net worth by $60k.


Wednesday, January 09, 2019

Target Portfoilo Performance December 2018

In AUD terms the target portfolio lost 1.85% in December, gaining 0.3% for 2018 as a whole. The MSCI gained 0.9% for the year and I gained 2.3%. The graph shows the returns for the each month in 2018 for the target portfolio, the MSCI World Index in AUD terms, and the target portfolio:


The target has lower volatility but is more correlated to the MSCI than I was. So the target portfolio wouldn't have provided very useful diversification in 2018.

Saturday, January 06, 2018

Annual Report 2017: Graphs

So here is how the last year looks on a graph in the context of everything since 1996:


The blue line is the sum of the other three lines. Medium term balance is liquid assets, the green line is retirement accounts. Both of these and housing equity increased. Markets performed well this year and we saved more.


This graph provides a slightly different view, breaking things down according to savings and profits. I don't break down housing equity into the two components as it's not worth it yet...

Though we are making savings outside of retirement accounts and housing equity - the blue line is rising - the slope is shallower than before we bought a house and had a baby but steeper than last year. So, a lot of this year's increase came from profits. In the long run we have done much better with retirement than with current accounts in terms of profits. Half of our retirement accounts are now made up of profits and half from contributions.

The next graph shows actual monthly non-retirement savings since 1996 and a 12 month moving average:


I have truncated the axis at -$15k - we dissaved $53k in January and $118k in February 2015 as we bought the house. After the big transfer of savings to buy the house, savings recovered, but to a lower level than in recent years. In the past year they have edged back up again to an average of $5k per month, though they are very volatile.

Friday, January 05, 2018

Housing Saving

A new chart - monthly housing saving:

It's mostly mortgage principal payments. Initially, we made our downpayment in two payments over two months. I've truncated the scale at $10,000 - saving in January 2015 was $37k and in February 2015 $115k. The main interesting thing on the graph is the upward trend over time. This reflects the increasing money in our offset account and the resulting lower interest payments. As a result, the part of our mortgage payments that's reducing the principal increases over time. The periodic spikes are the three mortgage payment months - we make a mortgage payment every two weeks. The red line is a 12 month moving average.