Showing posts sorted by date for query turtle. Sort by relevance Show all posts

Saturday, June 08, 2024

Cambria Funds Launches a New Managed Futures ETF: How Will it Perform?

Cambria Funds have launched a new managed futures ETF – MFUT – managed by Chesapeake - Jerry Parker's (one of the turtle traders) firm. I compared the historic performance of the Chesapeake Diversified Plus managed futures program to the Winton Global Alpha Fund since 1996:


Clearly, Winton has outperformed Chesapeake and with substantially less volatility. The average return of Chesapeake has been 11.6% p.a., while Winton achieved 15.0%. Chesapeake's information ratio (Sharpe ratio with a zero percent hurdle) was only 0.44, while Winton's was 0.96.

It seems that Chesapeake's volatility decreased after about 2012. So let's focus on the period since then. Since the beginning of 2012 Chesapeake has outperformed Winton with an average annual return of 8.8% vs. 7.3%. However, Winton was still less volatile with an information ratio of 0.77 vs. Chesapeake's 0.52.

The full period, the correlation between the monthly returns of the two funds was only 0.44. Since 2012 it was 0.54. So, there it would seem there is a potential diversification case for investing in both funds. However the information ratio of an equal weight combination of the two funds is lower than that of Winton alone. This is true for both the full period and the post 2011 period. So, based on this, I won't be investing in MFUT.

Tuesday, March 02, 2021

February 2021 Report

The month ended quite turbulently, but stock markets were still up for the month. The Australian Dollar rose from USD 0.7663 to USD 0.7737. The MSCI World Index rose 2.35%, the S&P 500 by 2.76%, and the ASX 200 rose 1.65%. All these are total returns including dividends. We gained 1.65% in Australian Dollar terms or 2.68% in US Dollar terms. The target portfolio is expected to have gained only 0.23% in Australian Dollar terms and the HFRI hedge fund index is expected to gain 1.05% in US Dollar terms. So, we outperformed or matched all our benchmarks. The S&P 500 isn't a benchmark.

Here is a report on the performance of investments by asset class (currency neutral terms): 
 
Hedge funds added the most to performance and gold detracted the most. Things that worked well this month:
  • Tribeca Global Resources (TGF.AX), Regal Funds (RF1.AX), and Hearts and Minds (HM1.AX) were the top three performers gaining AUD 20k, 18k, and 11k, respectively. In other notable gains, we gained AUD 5k in Treasury Wine (now a 2% of net worth position) and Winton Global Alpha gained for a change, up AUD 3k.
What really didn't work:
  • Gold was the worst performer, giving back AUD 30k of gains.
The investment performance statistics for the last five years are:
The first two rows are our unadjusted performance numbers in US and Australian Dollar terms. The following four lines compare performance against each of the three indices. We have the desired asymmetric capture for all three indices now and positive alpha compared to all of them.

We moved further towards our long-run asset allocation. Real assets (real estate and art) are the asset class that is furthest from their target allocation (7.2% of total assets too little) followed by bonds (2.9% too much):


On a regular basis, we invest AUD 2k monthly in a set of managed funds, and there are also retirement contributions. Other moves this month:

  • I sold my USD 25k of Virgin Australia bonds for 8.125 cents on the dollar. With Australian borders closed longer than we would have expected at the beginning of the year, I guess the company's financial situation will be worse than they expected when they told us we would likely get 9 cents.
  • Prospect Capital called its baby bonds (PBB) early, resulting in another USD 25k reduction in our bond exposure.
  • I started systematically daytrading ASX200 CFDs and futures....  I made a little money, just under AUD 600. I also started trading soybean futures using my version of the turtle model. This system doesn't trade that often. It made one trade which was stopped out for a loss.
  • Two days before the earnings release, I sold 2000 of our Treasury Wine shares (TWE.AX) as I was anticipating some turbulence. The next day the price fell sharply and I bought them back almost a dollar lower. By the end of the day the price recovered. On the earnings day not much happened. Then the day after earnings the stock price rose 17% on a broker upgrade and a positive article in the Fin Review. After that there was more turbulence and I adjusted the positions a little
  • I invested USD 10k in another painting at Masterworks. I now have USD 60k invested in 6 paintings.

Saturday, September 28, 2019

ASX200 Futures

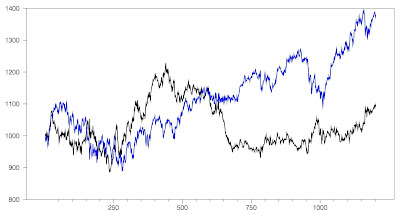
I put together a dataset for the ASX 200 futures for the past 5 years - Barchart have this data. Every possible "Turtle" strategy I tested lost money. So, we're definitely not going to trade this! I tested breakouts from 1 to 40 day periods and they all have similar poor performance. Position sizing to always trade the same percentage risk made things much worse.

Here is a 2,2 strategy without position sizing assuming no slippage – The best case scenario:


The blue line is the continuous futures contract price I constructed and black is the equity line of the strategy. This actually makes a slight gain over the 1200 trading days. But including reasonable slippage, it will turn into a loss. A 2,2 strategy means that you buy or sell breakouts from the previous two days highs or lows and exit those positions on breakouts from the same number of trading days in the opposite direction.

I have now put on a small (10 ounce) Palladium trade using CFDs. I'll probably test trading oil next.

Monday, July 22, 2019

New Macro Trade


I've started another long-term macro trade by buying a treasury note futures spread. The spread is short one ten year treasury note futures contract and long two two year treasury futures contracts. You can execute this with one trade using the TUT ticker. The face value of a two year contract is $200,000 and for a ten year contract, $100,000, so actually the trade is long four times as many two year notes as it is short ten year notes. The idea is that this spread will gain value as the yield curve steepens, which following a yield curve inversion, it already seems to be doing. The curve would steepen mainly because the Federal Reserve would cut short term interest rates. So, if they don't cut much the trade will lose. The more they cut the more likely it is to make money.

My other macro trade is gold. Though that is also a bit more like an investment as we plan to allocate to gold in the long term and I am using the IAU ETF for tax and psychological reasons. I've increased my position at this point to 4.89% of assets. The net treasuries position is nominally $302k, which is much bigger than that.

I've also been thinking about how to improve my new day-trading strategy. I think that I will add exit stops to each order I place. This means, for example, if we go long initially in a "headfake"and then the market falls and the sell stop order is triggered, rather than getting out of the market it will initiate a short position. That would have been a profitable trade in the S&P 500 futures on 16th and 19th of July. The resulting short gained more than the stopped out long lost. Also, I am thinking to keep half of the position as a turtle style trend following position rather than an actual daytrade. The difference to the medium term turtle trading is that the stop is moved each day based on action in the first part of the day rather than action over the last few days.

So I now have three time frames of trades. I am hoping that this diversification, while requiring entering more orders, actually results in me being less anxious about the trades and so actually spending less time looking at the market. We will see.

Thursday, July 18, 2019

Systematic Day Trading


I figured out a way to adapt the turtle trading method to systematic day-trading. I plan to apply it to markets which tend to move strongly after the release of US economic news at 8:30am Eastern Time on many days and which have elevated volume when US cash markets are open. The idea is to put buy and sell orders in for these markets at around 8:00am (currently 10pm here in Australia) based on the movement of the futures markets over the day up to that point. If there is a breakout of that range you go long or short automatically. Then you close the positions at the end of the trading day. This is a day trading method where you don't look at the market all day.

I don't have access to historic hourly data at the moment but I have backtested the idea for a couple of months by looking at charts for the NASDAQ 100 futures. It seems that the approach wins more times than it loses, though average wins and losses are about equal in size. Once the market starts moving in a given direction intraday it tends to keep moving in that direction. It looks like it would work well for stocks, bonds, gold, Australian Dollars... It doesn't look like it would work for oil, soybeans etc. These commodities typically expand their trading range in both directions when the market gets more active. As a result trades would tend to get stopped out.

I'll start trading it using the new micro-futures that are a 10th of the size of the e-mini NASDAQ and S&P contracts as well as with CFDs for gold (trading 10 ounces say) and Australian Dollars (starting with AUD 10k) and see how we go.

Tuesday, April 23, 2019

Update on Trading Research

I came to the conclusion that none of the trading tools I developed are reliable. They can match market behavior for a while and make money, but then the relationship breaks down. In the long run there is no relationship between any of these indicators and returns.

I wrote a back-testing program for Turtle type trend-following models. This allows me to optimize the time periods to use to maximize profits. There is the potential for over-fitting and unstable relationships here too. The answer I think is to regularly re-optimize as the market changes. This re-optimization is easy to do. Given that a wide range of values is profitable in the exercise I did, I don't think there would be a sudden failure. We will see.

In the backtest there were 78 trades with a 48% win rate. But wins were on average 3.45 times larger than losses. The annualized Sharpe ratio is 2.2. Here there is a negative correlation between the initial risk taken (amount of money lost if the stop is triggered) and profits. That means it makes sense to bet bigger when the risk is lower:


I am now trading Bitcoin futures with the optimized algorithm (Long Bitcoin since yesterday). Next step is to see if there are other futures I could trade. Stock index futures aren't more profitable than just going long the index.

Sunday, July 15, 2018

Position Size

One of the main ideas in traditional momentum trading wisdom is that as volatility increases your position size should decrease. This is one of the key ideas in the Turtle Trading System, for example. If you have no idea what will happen, then higher volatility likely will result in higher losses as well as higher gains.

But if you do have some ability to predict the future, that trading signal might be stronger when volatility is higher and weaker when volatility is lower. Then you will have more losing trades when volatility is low and a higher proportion of winning trades when volatility is high. This seems to be the case with my system. Higher volatility means higher risk but also a higher probability of being right. In this case, position size maybe should be constant regardless of volatility.

P.S. 22 July

I calculated the Sharpe ratio for constant position size and for strategies that reduce position size as volatility increases and and increase position size as volatility increases. The constant position size strategy has the highest Sharpe ratio confirming my intuition. The strategy with a negative correlation between position size and volatility has the lowest Sharpe ratio. The strategy with a positive correlation is in between. So, for the moment I will stick with constant position sizing.

Turtle Trading


I have been reading the Complete Turtle Trader, trying to get some inspiration. Back in the early 1980s, futures trader Richard Dennis hired a bunch of relative novices (some actually had trading experience) and taught them a trend-following method of trading. He then got them to trade some of his assets using the methods. The idea was to see if trading could be taught. During the next few years, many of them generated extraordinary returns, as documented in the book. Then the experiment ended after Dennis suffered major losses and shut his fund.

Some of the "turtles" went on to run their own investment firms. The star pupil seems to be Jerry Parker who founded Chesapeake Capital. However, subsequent performance has not really been that good.* The fund has underperformed the S&P 500 and has had about twice as much volatility. Taxes would be much higher on Chesapeake's strategy than on buying and holding the index. Why does voltatility matter? Because I could have used leverage to invest in the S&P 500, increasing volatility to the level of the Chesapeake Capital fund, but increasing returns far beyond its returns.

This doesn't encourage me to adopt a long-term trend following strategy. The assumption of this kind of model is that the future is entirely unpredictable... Eckhardt is cited in the book as saying that random entry into a trade is just as good as long as you follow exit rules. That's true about most momentum trading strategies I think.

It's notable that none of these turtle related firms are very big in terms of assets under management.

* The "LV" fund performed better but still underperformed the S&P 500 on a risk adjusted basis. Salem Abraham's – described as a "second-generation turtle" in the book – fund has gone nowhere in the last ten years.