
Monday, January 27, 2020
Why Not Just Invest in Stock Index Funds?
Financial Independence recently asked in the comments why I don't just invest in a portfolio of stock index funds. I answered that I am more interested in protecting against the downside now than getting richer. But basically I think you can do better than that. This is the simulated performance of our target portfolio against the MSCI All Country World Index and ASX200 in Australian Dollar terms:
 Notice what happened during the 2000-2002 Tech Wreck and 2007-2009 Global Financial Crisis? The target portfolio more or less flatlined, while Australian shares dropped 40% in 2007-9 and the MSCI fell around 20% in AUD terms. Over this whole period the portfolio also outperformed the MSCI index, though not in recent years.
Thursday, January 09, 2020
Contributions of Individual Investments 2019
Here are the contributions of each of 86 individual investments or trading vehicles in the 2019 calendar year (Australian Dollars):

Of course, these deoend on how much we have invested in each one and the superannuation funds that head the list are our biggest investments.

Of course, these deoend on how much we have invested in each one and the superannuation funds that head the list are our biggest investments.
Annual Report 2019
Investment Returns
In Australian Dollar terms we gained 12.61% for the year and in USD terms we gained 12.16%. This is a lot less than stock markets gained, but I now prefer to compare our performance to the average hedge fund, which gained 10.35% in USD terms. The MSCI gained 27.3% in USD terms and the ASX 200, 25.6% in AUD terms. These are the US Dollar returns month by month compared to the MSCI and HFRI indices:
We followed HFRI very tightly until September, when, apparently because of an increase in the volatility of the Australian Dollar, our performance became more volatile than the hedge fund index.
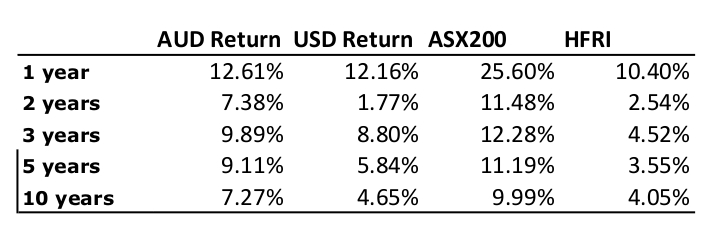
I posted equivalent Australian Dollar returns in the December monthly report. The next chart shows long term returns in Australian Dollar terms compared to the MSCI, ASX200, and the target portfolio:

Investment Allocation
The main change in allocation over the year was that we converted cash into bonds and gold and then began to run down the bond allocation mostly in favor of hedge funds:

Also, at the beginning of the year, I was still a part owner of my mother's apartment, which was then sold.
Accounts
Here are our annual accounts in Australian Dollars:

There are lots of quirks in the way I compute the accounts, which have gradually evolved over time. There is an explanation at the end of this post.
We earned $152k after tax in salary, business related refunds, medical payment refunds, tax refunds etc. We earned (pre-tax including unrealized capital gains) $251k on non-retirement account investments. The latter number was up strongly from last year. The former number continued its decline. The investment numbers benefited from the fall in the Australian Dollar ($40k in "forex" gain). Total current income was $403k. Not including mortgage interest we spent $133k. Total actual spending including mortgage interest was $147k, which was up 12.3% on last year.
$9k of the current pre-tax investment income was tax credits – we don't actually get that money so we need to deduct it to get to the change in net worth. We transferred $135k into retirement accounts from existing savings in "non-concessional (after tax) contributions. Near the end of the year we paid off the mortgage. Including mortgage payments during the year, that meant a total $520k transferred to our housing account.
The change in current net worth, was therefore -$394k. Looking at just saving from non-investment income, we dissaved $636k. Both these are crazy numbers...
The retirement account is a bit simpler. We made $46k in pre-tax contributions (after the 15% contribution tax) and made an estimated $204k in pre-tax returns. $23k in "tax credits" is an adjustment needed to get from the number I calculate as a pre-tax return to the after tax number. Taxes on returns are just estimated because all we get to see are the after tax returns. I do this exercise to make retirement and non-retirement returns comparable. Net worth of retirement accounts increased by $362k.
Finally, the housing account. I estimate that our house gained $24k in value. We spent $15k on mortgage interest. We would have paid $17k in mortgage interest if we didn't have an offset account. After counting the transfer of $520k into the housing account housing equity increased $527k of which $504k was due to paying off principal on our mortgage.
Total net worth increased by $495k, $48k of which was saving from non-investment sources. These numbers are steeply down from last year. The net worth increase last year mostly came from the inheritance.
Though our saving is down sharply on last year, we still saved in total 24% of our after tax non-investment income. Of course, this is less than last year's 33% and 2017's 54%! Including investment income our savings rate was 77%. This is based on our income calculated here at a ridiculously high $643k.
How Does This Compare to My Projection for This Year?
At the beginning of the year, I projected a gain in net worth of only $60k based on an 0% return on investments and a 6% increase in spending. As you can see, spending rose 12% and return on investments was also about 12%. As a result net worth increased by $495k. So, this was a big forecasting fail, as was last year's projection.
So, it's probably a mistake to try to make a projection for 2020 :) The baseline projection in my spreadsheet is for a 12% rate of return, a 6% increase in spending, and flat other income, leading to a $425k increase in net worth. I expect that forecast will fail big time again.
Notes to the Accounts
Current account is all
non-retirement accounts and housing account income and spending. Then
the other two are fairly self-explanatory. But housing spending only
includes mortgage interest. Property taxes etc. are included in the
current account. There is not a lot of logic to this except the
"transfer to housing" is measured using the transfer from our checking
account to our mortgage account. Current other income is reported after
tax, while investment income is reported pre-tax. Net tax on investment
income then gets subtracted from current income as our annual tax refund
or extra payment gets included there. Retirement investment income gets
reported pre-tax too while retirement contributions are after tax. For
retirement accounts, "tax credits" is the imputed tax on investment
earnings which is used to compute pre-tax earnings from the actual
received amounts. For non-retirement accounts, "tax credits" are actual franking credits
received on Australian dividends and the tax withheld on foreign
investment income. Both of these are included in the pre-tax earning but
are not actually received month to month as cash.... Finally, "core
expenditure" for housing is the actual mortgage interest we paid.
"Expenditure" adds back how much interest we saved by keeping money in
our offset account.
We include that saved interest in the current account as the earnings
of that pile of cash. That virtual earning needs to be spent somewhere
to balance the accounts... It is also included in the "transfer to
housing". Our actual mortgage payments were less than the number
reported by the $2k in saved interest. For current accounts "core
expenditure" takes out business expenses that will be refunded by our
employers and some one-off expenditures. This year, there are
none of those one-off expenditures. "Saving" is the difference
between "other income" net of transfers to other columns and spending in
that column, while "change in net worth" also includes the investment
income.
Thursday, January 02, 2020
December 2019 Report
This month I decided to stop short-term trading again. I think you can make money doing what I was doing, but trading at a size that makes a real difference generates too much anxiety for me. I didn't hear from HSBC on refinancing our mortgage. I sent them one email. Will need to chase them more in January.
The Australian stockmarket fell a bit in December and the Australian Dollar rose, but overseas markets rose. The Australian Dollar rose from USD 0.6764. to USD 0.7023. The MSCI World Index rose 3.56% and the S&P 500 3.02%. On the other hand, the ASX 200 lost 2.08%. All these are total returns including dividends. We gained 0.28% in Australian Dollar terms and 4.11% in US Dollar terms due to the rise in the Australian Dollar. The target portfolio is expected to have lost 0.82% in Australian Dollar terms and the HFRI hedge fund index is expected to have gained 1.07% in US Dollar terms. So, we out-performed all our benchmarks, which is rather unusual. Updating the monthly AUD returns chart:

MSCI is negative here in December because of the rise in the Australian Dollar. We haven't lost money on a monthly basis in Australian Dollar terms since November 2018... The Australian stockmarket fell a bit in December and the Australian Dollar rose, but overseas markets rose. The Australian Dollar rose from USD 0.6764. to USD 0.7023. The MSCI World Index rose 3.56% and the S&P 500 3.02%. On the other hand, the ASX 200 lost 2.08%. All these are total returns including dividends. We gained 0.28% in Australian Dollar terms and 4.11% in US Dollar terms due to the rise in the Australian Dollar. The target portfolio is expected to have lost 0.82% in Australian Dollar terms and the HFRI hedge fund index is expected to have gained 1.07% in US Dollar terms. So, we out-performed all our benchmarks, which is rather unusual. Updating the monthly AUD returns chart:

Here is a report on the performance of investments by asset class (futures includes managed futures and futures trading):

Things that worked well this month:
- Hedge funds Platinum Capital/International Fund and Tribeca did very well. Tribeca (TGF.AX) is no longer our worst ever investment in dollar terms, though it is still hugely drawn down.
- Gold did well, almost reaching this year's highs again.
- Bitcoin lost heavily and we stopped trading it.

This is what the target portfolio would look like:

On a regular basis, we invest AUD 2k monthly in a set of managed funds, and there are also retirement contributions. Other moves this month:
- USD15k of Ford bonds were called and we didn't buy any new bonds.
- We bought AUD 40k by selling US Dollars.
- We traded very badly...
- We bought 500 shares of a Commonwealth Bank hybrid (CBAPI).
Sunday, December 29, 2019
New Target Portfolio Allocation
Following up on my post on the best portfolios for Australia, this post will lay out the new target portfolio allocation. The basic idea is to reduce the allocation to managed futures from 25% in my previous target portfolio to 10%. This is because I plan to do little active trading going forward and futures funds have had lacklustre performance for several years. Maybe they will come back, but we should see them more as a potential hedge than as a main asset class at this point I think.
At the top level the portfolio is 60% in stocks and 40% in other assets. The other assets are allocated equally between bonds, futures, gold, and real estate. The stocks allocation is roughly equally divided between Australian and international stocks. 10% of the portfolio is allocated to private equity and 50% to public. Then the public allocation is divided between long only and hedge fund strategies. Within the long only Australian allocation, 1/3 is devoted to small cap stocks. The full allocation is:
10% Australian large cap
5% Australian small cap
12.5% International stocks
10.75% Australian oriented hedge funds
10.75% International oriented hedge funds
10% Private equity
10% Bonds
10% Real estate
10% Gold
10% Managed futures
1% Cash
We will also usually use some leverage or gearing. 1% in cash seems sufficient given the ability to borrow.
The Best Portfolio for Australia
The portfolio charts website, I wrote about before, now lets you do analysis using Australian assets, inflation etc! It turns out that the best portfolio for Australia isn't the same as the best for the US... The following table shows the average and standard deviation of real returns, the maximum drawdown, and the safe and permanent withdrawal rates (preserves capital) for a 30 year retirement horizon:
 This is based on data since 1970. Based on the permanent withdrawal rate the Ivy Portfolio developed by Meb Faber is best. The 100% Aussie stocks portfolio (TSM) has a slightly higher return, but the lowest permanent withdrawal rate. So, I think Aussie investors should start to think about portfolio design from something similar to the Ivy Portfolio. It's no surprise that I have been a fan of Meb Faber and endowment style portfolios...
Using ETFs, this portfolio recommends putting 20% into each of Australian stocks, international stocks, intermediate term bonds, commodities, and REITs.
Using the build your own portfolio tool you can see what tweaking this beginning portfolio can do. For example, replacing half the commodities allocation with gold and half the bond allocation with extra international stocks, increases the return to 6.1% and the SWR and PWR to 5.2% and 4.4% with almost no increase in drawdowns.
Going to 60% stocks divided equally between Australia and the rest of the world and 10% in each of bonds, gold, commodities, and REITs, is actually quite similar in return profile to the Ivy Portfolio. The key thing is to hedge Australian stocks with international and real assets. This latter portfolio is probably going to tbe basis of my own new target portfolio.

Thursday, December 12, 2019
Pulling the Plug on Short-Term Trading

I've decided to stop short-term trading. In recent months it hasn't made any money, it takes up a lot of time, and it gives me a lot of anxiety. Even though I am doing systematic trading I find myself looking at the market a lot and worrying about my positions. I can't seem to stop it. And my current position sizes are quite small. After a sleepless night, I've had enough. I already cancelled my orders that were waiting to execute. I will keep the existing Bitcoin and palladium positions until they exit naturally
Going forward, I will need to think about our overall financial plan again. Trend following funds aren't doing well in recent years, so we won't want to allocate that much to them compared to the current target allocation to "futures". What should we invest in instead? Should I still plan to set up an SMSF? I delayed that while I waited to see if trading was going to be a big part of it.
I've been here a couple of times before.
Friday, December 06, 2019
Trading Update
Well, that didn't last long. In November's report I said I would raise the risk allocation to palladium and soybeans. I just got stopped out of palladium futures though the contract is ending the day more or less where it began. I actually made a little money on the trade, but I'm not willing to take so much risk. So, I'm going to go back to trading palladium CFDs with a smaller amount of risk. I'll cut soybeans back to USD 2,500 risk as well. Yesterday, Bitcoin had a double stop out. First the long position was closed for a loss and a short opened and then the short was stopped out intraday. After all that, the contract ended near where it started:

I'm seriously thinking again of giving up on trading. Yes, you can make money doing this and I am now disciplined enough to always do the trades the algorithm says to do. But in practice there is still quite a lot of anxiety and mood swings. If I keep trading so small that I only make say a thousand dollars a month at it, it's not really worth the hassle. But if I make it big enough to make a difference I will have too much anxiety. That's the dilemma at this point. So far this financial year I am just losing money. I've given back all of last month's profit in the first week of this month.

I'm seriously thinking again of giving up on trading. Yes, you can make money doing this and I am now disciplined enough to always do the trades the algorithm says to do. But in practice there is still quite a lot of anxiety and mood swings. If I keep trading so small that I only make say a thousand dollars a month at it, it's not really worth the hassle. But if I make it big enough to make a difference I will have too much anxiety. That's the dilemma at this point. So far this financial year I am just losing money. I've given back all of last month's profit in the first week of this month.
Monday, December 02, 2019
November 2019 Report
A less frenetic month financially but somehow I didn't get to make any blogposts since October's monthly report. We started on refinancing our mortgage at a lower interest rate, but the transaction is not yet complete.
The Australian Dollar fell from USD 0.6894 to USD 0.6764. The MSCI World Index rose 2.48% and the S&P 500 3.63%. The ASX 200 gained 3.51%. All these are total returns including dividends. We gained 2.17% in Australian Dollar terms but only 0.25% in US Dollar terms. The target portfolio is expected to have gained 1.53% in Australian Dollar terms and the HFRI hedge fund index is expected to have gained 0.75% in US Dollar terms. So, we out-performed our target portfolio but lagged other benchmarks. Updating the monthly AUD returns chart:

The Australian Dollar fell from USD 0.6894 to USD 0.6764. The MSCI World Index rose 2.48% and the S&P 500 3.63%. The ASX 200 gained 3.51%. All these are total returns including dividends. We gained 2.17% in Australian Dollar terms but only 0.25% in US Dollar terms. The target portfolio is expected to have gained 1.53% in Australian Dollar terms and the HFRI hedge fund index is expected to have gained 0.75% in US Dollar terms. So, we out-performed our target portfolio but lagged other benchmarks. Updating the monthly AUD returns chart:

Here is a report on the performance of investments by asset class (futures includes managed futures and futures trading):

Stocks and real estate did well while hedge funds, private equity, and gold did poorly. The largest positive contribution to the rate of return came from large cap Australian stocks and the greatest detractor was gold. The returns reported here are in currency neutral terms.
Things that worked well this month:
- The Unisuper superannuation fund gained more than any other investment in dollar terms.
- Soybeans and Bitcoin were the next best performers.
- Crude oil and gold lost heavily.
- Regal Funds (RF1.AX) fell sharply after it was reported that the firm was under investigation by the regulator, ASIC.
Using a narrower definition including only futures and CFDs we made 3.55% on capital used in trading or USD 6.5k. Including ETFs we lost just 0.01% or AUD 46. Using the narrow definition, we are catching up to last year's returns. This graph shows cumulative trading gains using the narrower definition year to date:

I think I should increase the risk allocations to soybeans and palladium to USD 5,000 each from USD 2,500 and AUD 1,250 currently. These would be roughly the allocations suggested by the portfolio optimization given current allocations to Bitcoin and oil (USD 3,670 and 2,500). Risk allocation is the maximum potential loss on a single trade.
We moved further towards our new long-run asset allocation.

On a regular basis, we invest AUD 2k monthly in a set of managed funds, and there are also retirement contributions. Other moves this month:
- I rebought 100,000 shares of Domacom (DCL.AX).
- I bought 10,000 shares of Regal Funds (RF1.AX) after the price fell sharply following an ASIC investigation of the firm.
- USD 100k of bonds (Virgin Australia & Viacom) matured. I bought USD 25k of Dell, 16k of Nustar, and 25k of Tupperware bonds. So our direct exposure to corporate bonds fell by USD 34k.
- I transferred AUD 45k to my Colonial First State superannuation account, investing in the Conservative Fund.
- I bought around AUD 43k and GBP 7k, selling US dollars.
- I bought 750 shares of 3i.
Saturday, November 30, 2019
Performance of Optimal Portfolio

The graph shows the monthly profits from idealized trading of an optimal portfolio of Bitcoin, palladium, crude oil, and soybeans futures. The risk budget is the maximum loss possible in one day under ideal conditions.
My results this year somewhat track these. My trading hasn't always been ideal, I have been developing my methods, and my portfolio doesn't have the optimal weights yet. Midyear there were strong returns available and I also did well. Then, in the last four months returns were lower or negative and I also lost money. November was again a good month though not as good as April-June.
Next month I am looking to move closer to the optimal weights and increase the risk budget so that the average return would in theory be around the same amount as my salary, which is one of the goals I have set.
Monday, November 25, 2019
PAYG Installments
I received a letter from the Australian Tax Office that I need to pay quarterly estimated tax payments. However, if the total estimated tax is less than AUD 8,000 you can pay the installments annually. If you self-prepare your tax this means apparently that you don't actually need to pay any installments. So, I selected that option online.
On the other hand, I think Moominmama is going to need to make quarterly payments.
On the other hand, I think Moominmama is going to need to make quarterly payments.
Saturday, November 02, 2019
October 2019 Report
This month we "inverted" our mortgage, paying off the mortgage and then redrawing it for investment purposes. As a result the mortgage interest should now be tax deductible. I carried out quite a lot of trades and money shuffling to carry this out.
The Australian stockmarket fell a bit in October and the Australian Dollar rose, but overseas markets rose. The Australian Dollar rose from USD 0.6752 to USD 0.6894. The MSCI World Index rose 2.76% and the S&P 500 2.17%. The ASX 200 fell 0.35%. All these are total returns including dividends. We lost 0.20% in Australian Dollar terms but gained 1.90% in US Dollar terms. The target portfolio lost 1.03% in Australian Dollar terms and the HFRI hedge fund index is expected to have gained 0.83% in US Dollar terms. So, we out-performed our target portfolio, the HFRI, and the ASX, while underperforming compared to the MSCI World Index and the S&P 500 (a bit). Updating the monthly AUD returns chart:

Hmmm... It is looking like my performance is an average of the MSCI and the target portfolio in recent months.The Australian stockmarket fell a bit in October and the Australian Dollar rose, but overseas markets rose. The Australian Dollar rose from USD 0.6752 to USD 0.6894. The MSCI World Index rose 2.76% and the S&P 500 2.17%. The ASX 200 fell 0.35%. All these are total returns including dividends. We lost 0.20% in Australian Dollar terms but gained 1.90% in US Dollar terms. The target portfolio lost 1.03% in Australian Dollar terms and the HFRI hedge fund index is expected to have gained 0.83% in US Dollar terms. So, we out-performed our target portfolio, the HFRI, and the ASX, while underperforming compared to the MSCI World Index and the S&P 500 (a bit). Updating the monthly AUD returns chart:

Here is a report on the performance of investments by asset class (futures includes managed futures and futures trading):

Things that worked well this month:
- Pengana Private Equity and Bluesky Alternatives did very well, gaining AUD 8.7k and AUD 10k, respectively. Hearts and Minds gained AUD 5.3k.
- Gold gained (AUD 7.3k).
- Winton Global Alpha lost significantly, reversing recent gains.
- Pershing Square, Cadence Capital, and Tribeca Natural Resources all lost money.

We moved further towards our new long-run asset allocation.


On a regular basis, we invest AUD 2k monthly in a set of managed funds, and there are also retirement contributions. Other moves this month:
- USD 21K of Kraft-Heinz bonds were called early and we didn't buy any new bonds So, our direct bond holdings declined by USD 21k.
- We traded at a small loss, as discussed above.
- I sold 100k of Domacom (DCL.AX), 40k of Tribeca Global Natural Resources (TGF.AX), and 79k of Cadence Capital (CDM.AX) shares to harvest tax losses and obtain cash for the mortgage inversion. I subsequently bought back 40k of Tribeca and 80k of Cadence. I now have the funds which are marginable and/or are likely to pay large franking credits in my account and the non-marginable funds, which mostly also are likely to pay out fewer franking credits in Snork Maiden's account. As franking credits are applied to the tax bill it doesn't actually matter which account they are in, but I like to see my larger tax bill cut more :) I have a margin account with Commonwealth Securities, while Interactive Brokers don't offer margin loans to Australian customers.
- I bought 20k shares of Hearts and Minds (HM1.AX) before the upcoming annual Sohn Conference. The fund is currently winding down the investments in the stocks recommended at the last conference and will invest in new recommendations following this year's conference. The share price is very close to NAV and I think following the conference there could be a boost in price. The fund has done very well since inception.
- I went to Regal Fund's presentation here and was impressed and bought 20k more shares of RF1.AX.
- I sold 50k of Pengana Private Equity (PE1.AX) shares because the price seemed unsustainably high but then bought back 50k at lower prices. This is not looking like a good move given the tax implications
- We bought AUD 40k of Australian Dollars.
- We moved around AUD 1/4 million to our offset account and paid off the mortgage. We then redrew AUD 1/2 million and sent it to my CommSec account and Moominmama's Interactive Brokers account. This reduced my margin loan a lot and increased the cash in her account a lot. The latter is deemed to be "futures" in the pie chart above. Cash in our offset account fell to AUD 40k.
Passed-in at Auction

There was an auction today for the house next door to us. It is almost identical though it is in better condition inside (our house will probably need AUD10-20k of refurbishment to put on the market I reckon). It doesn't have as good views/surroundings. The highest bid was AUD 690k from a bidder in another state on the phone and it passed in. Unless there was a post-auction negotiation, I guess we will see it on the market next week at a fixed price. Next week we should also hear from HSBC on how much their valuer values our house at.
P.S. 7 November
This house is now for sale at $829,500. In the meantime, the bank's valuer valued our house at $850,000. I guess they want to sell fast.
Wednesday, October 30, 2019
Mortgage Refinancing: Reality Check
I met today with a "Premier Relationship Manager" at HSBC. We are going ahead with the mortgage refinancing. They will send a valuer to value our house tomorrow...
So, she first checked whether I could service the loan based on the data I submitted. Based on just my salary of AUD 176k per year and our spending and a AUD 500k loan the answer was no. Given my salary is supposedly in the top 5% or higher, our house value is only a bit above the median price for houses here, and lots of people drive luxury cars etc. and we don't, you'd think this wouldn't be a problem. She said our spending was "very high". Either government income data is too low (but the banks ask for tax returns), or people somehow hide spending from the banks (but the banks ask for bank statements), or what? It's hard to reconcile what I see with the data.


Our net worth is in the top 300,000 or so of households and my income in the top 400,000 of taxpayers according to this official data.
By the way, five plus years ago, when we were looking to buy a house, the banks were willing to lend us much more money. Lending standards really have tightened.
Monday, October 28, 2019
Capitalise
Capitalise is an automated trading platform that uses commands written in near natural English at a very high level. I heard about it when Interactive Brokers told us that we now have access to it. At the moment the service is free. You can put in commands where buy/sell levels and stops depend on functions of past prices and also various technical indicators. There is no need to learn a formal programming language like Python or understand any of the intricacies of actually executing strategies. They are based in Israel.
This would be great for me except at the moment it doesn't allow position sizing based on functions of prices. You have to give it a numerical position size. I chatted with Arica on their platform and she said that they might develop that functionality in the future. For now I can handle updating my orders each morning (Australian time) as I am only systematically trading in 3 markets (Bitcoin, palladium, and oil). Maybe they will have this functionality by the time I can't handle trading manually anymore and I won't need to learn Python etc or collaborate with someone who does know that stuff.
This would be great for me except at the moment it doesn't allow position sizing based on functions of prices. You have to give it a numerical position size. I chatted with Arica on their platform and she said that they might develop that functionality in the future. For now I can handle updating my orders each morning (Australian time) as I am only systematically trading in 3 markets (Bitcoin, palladium, and oil). Maybe they will have this functionality by the time I can't handle trading manually anymore and I won't need to learn Python etc or collaborate with someone who does know that stuff.
Sunday, October 27, 2019
Mortgage Inversion Complete, What Next?
I completed the transfer of money into our brokerage accounts from the "mortgage inversion". That completes a major step in our financial restructuring since the inheritance. We've completed the first two steps on this list. I am thinking of refinancing our mortgage to get a lower interest rate now I don't care about having an offset account with my main bank. But how to go about this? Should I go to a mortgage broker or just contact a bank, like HSBC, who are offering a low rate?


Subscribe to:
Posts (Atom)