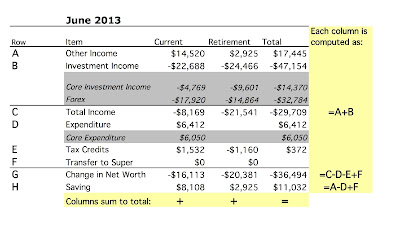
So, I just finished doing Snork Maiden's tax return for this tax year:
The tax year runs from 1st July to 30th June in Australia. The good news is that she should get a tax refund this year. This is because we now got private health insurance. Income is again up by about 10%. Investment income is up by a lot more than salary as are tax credits derived from investment income. The figures ignore employer and employee contributions to superannuation (retirement account) which amount to a lot of extra income.
Here are the reports on Snork Maiden's taxes for all previous years:
2012-13
2011-12
2010-11
2009-10
2008-9
2007-8
Saturday, September 27, 2014
Supplementary Section Instructions Only Available as html?!
Apparently you can't even download a pdf of the supplementary tax return instructions. Instead you have to go through all these webpages.... There is a pdf of the main instructions (and hard copies at ATO offices) but not of the supplementary instructions. Why? If someone knows where they are please let me know!
Tuesday, September 23, 2014
Ordered Another Valuation
I asked the bank to order a valuation on another house. This one is going to cost more than the previous one that we didn't end up buying. But there will be very little work needed to be done if we buy it, so we can afford to pay more. I think the house is a little on the large size, but Snork Maiden disagrees. It's in a different neighborhood a few kilometers further from the center (near this other one we bidded on last year). Despite finding that valuations aren't much use, I think this time we can use it as a basis for talking to the bank guy about raising the maximum amount we can borrow. I am now thinking to put 20% down (up from previously thinking 10%) after rerunning the numbers on a larger downpayment versus paying mortgage insurance, which you have to pay if you put down less than 10%. So, I am also ramping up the size of the Moominhouse buying fund. It's currently at $182k with a target of $250k (up from $150k).
P.S. 4pm
The valuation came in at $950k with a range of $920-$980k. We had guessed about $1 million. Anyway, so now we are going to discuss with the bank how much we can really borrow.
P.S. 4pm
The valuation came in at $950k with a range of $920-$980k. We had guessed about $1 million. Anyway, so now we are going to discuss with the bank how much we can really borrow.
Saturday, September 06, 2014
Get Your Credit Score
You can now get your credit score for free in Australia, something that has long been taken for granted in the US. My score was 998 which is in the excellent band, which ranges from 833 to 1200.
Tuesday, September 02, 2014
Moominvalley Monthly Report August 2014
The Australian Dollar rose a little this month to 93.43 US cents. The MSCI World Index rose 2.25%, the S&P 500 rose 4.00%, but the ASX200 rose only 0.62%. Our Australian Dollar performance was close to the latter gaining 0.58% (1.05% in US Dollar terms). All asset classes apart from private equity gained with Australian small cap and US stocks doing best. By the way, you can get an up to date asset allocation here.
Net worth rose $A19k to $1.266 million or $US22k to $US1.183 million. The monthly accounts (in AUD) follow:
This month there is a new column and row to take into account housing investment activities separately from spending or other investing. So costs incurred in the housing hunt will be accounted for here. We seem to be out of the race for the house I bidded on this weekend, but the search continues.
Current non-investment income (salary etc.) was above normal at $15.7k due to some extra payments. Spending was $4.7k which is lower than average. We managed as a result to save $10.6k from non-investment income. We gained $6.9k on investments.
Saturday, August 30, 2014
Auction Day
So today was the auction day for the house we were interested in buying. At this point we haven't bought it...
So we got a valuation that cost us $330 and they produced a value of $770k. But when we were meeting with the mortgage guy at the bank he said that the bank could do a valuation for $50 and if we go ahead with the purchase the fee will be waived as they do this as part of the loan approval process anyway. So we got that valuation too. The median of that appraisal was $800k with a range of $760k to $840k. So I went into the auction with an limit of around $860k in mind. The highest I got to bid was $850k and then the next bid was $865k. The auctioneer was not accepting smaller increments. As we were still below the reserve price I then decided not to push the price higher on the gamble that the owner wouldn't accept this higher bidder's offer and the house will return to market with a listed price. It turns out that the owner's reserve price was $970k but they are willing to go down to $950k but the other bidder would only go up to $870k. So, I expect the house will either be listed now at $950k or taken off the market and the owner will try again at the beginning of 2015 just before the current tenancy concludes.
Saturday, August 16, 2014
Independent Valuers
So, we are thinking of getting a valuation on the house. The price of this service varies widely. These local guys charge $330. Herron Todd White - "the largest valuer in Australia" - charges $660. Is this a case where it makes sense to go with the cheaper service or is there some extra quality or service that is worth paying double for?
Monday, August 11, 2014
Gearing Up for Housebuying Again
So, this weekend we went to see several houses in different parts of the city. We are following up in more detail on the one in the picture. The location is convenient to public transport with a position on top of a hill looking out over trees to a mountain - you could almost be out in the bush, apart from the traffic noise at the back of the house. It is the most expensive block in this suburb though it has been subdivided in two in what is called here a dual occupancy. The remaining block is still just over 1000 square metres. The house looks best from the street side, as in the picture. Inside is another story and there may be some structural issues with foundations at the back. The house has been rented presumably to students at my university for the last 20 years. Current rent is $570 a week. But that is only one of the two apartments the property is divided into. The apartment is rented till early next year though the second apartment is unoccupied. I think the price has to be over $700k as the land value is at least $550k. Auction is at the end of the month.
I have a previous history with this house. Fifteen years ago my girlfriend lived there, though we weren't together very long and I didn't visit that many times as a result. It was strange to come back again now. Looks like they didn't do any renovation in all that time apart from redesigning the front garden.
Snork Maiden talked to a colleague to see if they can recommend a builder to assess the potential renovation. Turns out the people who live in the second house on the block are friends of her colleague whose children go to the same school as his children.
Saturday, August 02, 2014
Monthly Spending
The graph shows our monthly spending each month since moving to Australia. I've taken out some business related expenditures that get refunded - so this is the same as the core expenditure I report in my monthly reports. You can see that the first year we were frugal and expenditure stuck around or just under the $A4,000 per month level. After that there are lots of spikes associated with travel and other larger expenditures and gradually the average has moved up to about $A6,000 a month currently. Note that $A2,150 a month is our rent. All the numbers are nominal, not adjusted for inflation.
Friday, August 01, 2014
Moominvalley July 2014 Report
Another monthly report... Much of this month was spent travelling and then catching up on work when I got back. I don't post here much because I don't do much trading or make many new investments nowadays. And I put most of my blogging effort into my professional blog. So there are mostly only these monthly reports, reports on tax returns, and occasional new investments etc. Of course we are investing plenty of money into funds and stocks we already own trying to keep in line with our diversified strategy.
The Australian Dollar fell a little this month to 93 US cents. The MSCI World Index fell 1.18%, the S&P 500 fell 1.37%, but the ASX200 rose 4.40%. We gained 1.74% in US Dollar terms and 3.15% in Australian Dollar terms. So we didn't beat the Australian stock market but did much better than the world markets. Net worth rose $A56k to $1.247 million or $US37k to $US1.160 million. The monthly accounts (in AUD) follow:
Other income is non-investment income. It was far above normal this month at $27.9k as we got three salary payments this month and there were refunds and rpepayments for business travel spending. Spending was $9.3k with $6.6k of that not refundable. That's not bad considering that both of us were traveling internationally for part of the month. We managed as a result to save $18.7k from non-investment income. We gained $37.5k on investments with $6.8k of that contributed by foreign exchange gains.
Thursday, July 24, 2014
Moomin Valley Monthly Report June 2014
A belated monthly report. As June is the end of the financial year for tax purposes in Australia a lot of data only comes in a few weeks after the end of the month and so the June report is usually delayed.
The Australian Dollar rose just over a US cent this month. The MSCI World Index rose 1.93%, the S&P 500, 2.07, and the ASX200 lost 2.22%. We gained
0.82% in US Dollar terms but lost 0.59% in Australian Dollar terms. So we beat the Australian stock market but not the world markets. Net worth rose $A7k to $1.189 million or $US22k to $US1.121 million. The monthly accounts (in AUD)follow:
Other income is non-investment income. It was above normal this month at $19.9k as refunds for business travel spending continued to come in. Spending was $7,593 with $6,345 of that not refundable. That's not bad considering that both of us were traveling internationally for part of the month. We managed as a result to save $12k from non-investment income after dis-saving last month. Spending so far this year is $54k in total compared to $49k last year. Core spending is actually down from $44k to $41k. I expect less spending in the second half of the year unless we finally buy a house or something like that.
We lost $7k on investments. Tax credits on non-retirement accounts (the main delayed item) were $2,396. This year's total tax credits are at a record level:
Despite this, my preliminary tax calculation for this year is showing me owing about $300 (after already pay $50k in taxes) and I suspect that Snork Maiden will also owe extra tax though I haven't calculated her tax return yet at all.
Monday, June 02, 2014
Moomin Valley Monthly Report May 2014
The Australian Dollar barely changed this month. The MSCI World Index rose 2.21%, the S&P 500, 2.35%, and the ASX200 0.68%. We gained 1.73% in US Dollar terms or 1.57% in Australian Dollar terms. So we beat the Australian stock market but not the world markets. Net worth rose $A19k to $1.182 million or $US19k to $US1.099 million. The monthly accounts (in AUD now) follow:
Other income is non-investment income. It was above normal this month at $18.3k as refunds for business travel spending began to come in. Starting in two weeks, I will be travelling around the world, first stop is New York City. Spending as a result was at a record level of $19.1k. But "only" $12.0k of that was "core expenditure". Refunds should cover the other $7k eventually. Last year core spending hit $14k in May. As a result we dissaved from regular income (-$0.8k). We gained $18.2k on investments. The asset class that did best this month was hedge funds at 4.64%, followed by private equity at 2.9% and commodities at 2.11%. All asset classes gained. The worst was Australian small caps at 0.12%.
You can track our net worth gain and some asset class breakdown on NetWorthIQ. It's interesting to look back at the picture 10 years ago.
Friday, May 30, 2014
Man 3 Eclipse Update
Back in 2008 I invested in a capital guaranteed managed futures fund called Man 3 Eclipse. This didn't turn out to be a great investment but it wasn't that disastrous either. However, other investors it seems have not been impressed by the fund's underperformance and have redeemed their shares. As the fund got smaller, late last year the directors decided to stop investing in active investment strategies and switch to 100% deposits in Australian Dollars. The fund was issued for a fixed period maturing on 29 April 2016. A feature of the fund was a ratchet that locked in profits under some conditions. Currently the value at maturity is guaranteed to be at least $1.0554 for every dollar invested. The actual net asset value per share is $1.0414.If we assume that the fund will earn 2% per annum from now on then the value at maturity will be about $1.08. But my understanding is that if you redeem shares early then you only get $1. So this is a guaranteed 4% rate of return per year assuming they can earn 2%. The main negative possibility is that fees chew up the interest yield. If they do then we still get back at least $1.0554. Based on that I will keep my money in the fund. It's only $8,000 anyway...
So far, my investment in the Winton Global Alpha fund is much more successful. It's up about 5% since I invested.
Monday, May 05, 2014
New Investment
A new investment - Cadence Capital Limited - another Australian listed investment company that basically runs a hedge fund in listed structure. They have long and short investments, potentially leverage or net cash, performance fees - all the standard hedge fund features. And it is exchange traded and pays franked dividends... They use a combination of fundamental and technical analysis. Currently the fund is selling for slightly less than net asset value but has performed very well in the past. It has strongly outperformed the Australian index even after fees. Initial position is 10,000 shares, but imagine that will increase over time. I estimate alpha relative to the ASX 200 of 9.43%, which is really high. Beta is 0.75.
Thursday, May 01, 2014
Moomin Valley Monthly Report April 2014
I was just thinking this morning that we need to increase net worth by $3,000 each month now just to compensate for inflation.
The Australian Dollar was pretty stable this month. The MSCI World Index rose 1.00%, the S&P 500, 0.74%, and the ASX200 1.77%. We gained 0.89% in US Dollar terms or 0.80% in Australian Dollar terms. So we beat the world markets but not the Australian stock market. Net worth rose $15k to $1.163 million in Australian Dollars or $US15k to $US1.080 million. The monthly accounts (in AUD now) follow:
Other
income is income not from investments or retirement contributions. It
was normal this month at $13.5k. Spending was very high this month at $9.8k
but after adjustments it was an average $5.8k. We saved only
$3.7k from regular income.
We gained $9.2k on investments. The asset class that did best this month was real estate and the worst private equity.
The Australian Dollar was pretty stable this month. The MSCI World Index rose 1.00%, the S&P 500, 0.74%, and the ASX200 1.77%. We gained 0.89% in US Dollar terms or 0.80% in Australian Dollar terms. So we beat the world markets but not the Australian stock market. Net worth rose $15k to $1.163 million in Australian Dollars or $US15k to $US1.080 million. The monthly accounts (in AUD now) follow:
We gained $9.2k on investments. The asset class that did best this month was real estate and the worst private equity.
Thursday, April 03, 2014
Moominvalley March 2014 Report
I am wondering whether to continue this blog as the only thing I have posted recently are these monthly reports and now we are above US$1 million dollars in net worth and things seem to be mostly smooth sailing it is not so interesting. I originally started the blog partly to help me be more responsible with trading as I had to report monthly on what was happening. I haven't done much trading since the GFC. Also, it was a way for Snork Maiden to read about our financial situation, which she pretty much totally leaves up to me to take care of. It doesn't seem that Snork Maiden reads the blog much any more either. And I am guessing that at these levels of net worth and income it is not something that a lot of the people reading PF blogs will be able to relate to. Many of the bloggers who used to report detailed numbers dropped them after they became a success in PF terms and relatively wealthy. Anyway, I haven't quite given up yet and I see that the posts do get a few views still, so here is another monthly report.
The Australian Dollar increased further this month from $US0.8933 to $US0.9274. This depressed gains in net worth in Australian Dollar terms. Stock markets rose a little. The MSCI World Index rose 0.50%, the S&P 500, 0.84%, and the ASX200 0.29%. We gained 3.02% in US Dollar terms and lost 0.77% in Australian Dollar terms. So we beat the world markets but not the Australian stock market. Net worth rose $5k to $1.148 million in Australian Dollars and rose $US43k to $US1.065 million. The monthly accounts (in AUD now) follow:
Other income is income not from investments or retirement contributions. It was normal this month at $14.6k. Spending was low this month at $4.3k but after adjustments it was an average $5.5k. As a result, we saved $10.3k from regular income
We lost $8.8k on investments. $5.1k of the loss was due to the rise in the Australian Dollar. The asset class that did best this month was hedge funds, but that is because I did some trading in shares of Platinum Capital. Private equity was the only other asset class with a positive return.
Monday, March 03, 2014
Moominvalley February 2014 Report
The Australian Dollar rebounded this month from $US0.8742 to $US0.8933. This depressed gains in net worth in Australian Dollar terms. Stock markets rose strongly. The MSCI World Index rose 4.88%, the S&P 500, 4.57%, and the ASX200 4.97%. We gained 5.49% in US Dollar terms and 3.24% in Australian Dollar terms. So we beat the world markets but not the Australian stock market. Net worth rose $43k to $1.143 million in Australian Dollars and rose $US60k to $US1.021 million. So, we are finally a US Dollar millionaire household! The monthly accounts (in AUD now) follow:
Other income is income not from investments or retirement contributions. It was normal this month at $14.2k. Spending was high this month at $7.6k with $6.8k in core non-work related expenditure. In other words, not including stuff that we will get refunded. As a result, we saved $6.5k from regular income. Retirement contributions were on the high side as we both got a third retirement contribution this month. Pay and retirement contributions are paid here every two weeks in Australia, so some months have three salary payments or retirement contributions. They don't coincide as there is usually a delay with the retirement contributions being paid into the superannuation fund.
We gained $35k on investments. There was a loss due to the rise in the AUD of $2.6k. The main investment gains this month were in large cap Australian stocks, which gained 4.4%. Private equity is the only asset class where we had a loss. I also repurchased shares in Platinum Capital and early in month switch a little money into the CFS Geared Share Fund. Later in the month I rebalanced Snork Maiden's CFS account. So our allocation to large cap Australian stocks and hedge funds increased with the allocation to all other asset classes falling.
Monday, February 03, 2014
Moomin Valley January 2014 Report
As I said in the annual report, the data in these monthly reports will be by default in Australian Dollars from now on. The Australian Dollar is now worth quite a bit less than a US Dollar and I think about our finances mainly in Australian Dollars of course, so it makes sense to report in Australian Dollars. The Australian Dollar fell further this month from $US0.8928 to $US0.8742. This depressed gains in net worth in US Dollar terms. Net worth fell $1k to $1.099 million in Australian Dollars and fell $US21k to $US961k. The monthly accounts (in AUD now) follow:
Other income is income not from investments or retirement contributions. It was normal this month at $15.4k. Spending was about average this month at $6.0k with $5.3k in core non-work related expenditure. In other words, not including stuff that we will get refunded. As a result, we saved $9.4k from regular income. Retirement contributions were also at the typical monthly rate.
We lost $15k on investments. There was a gain due to the fall in the AUD of $2.8k. Most of the loss was in retirement accounts. The rate of return for the month was -1.36% in AUD terms or -3.41% in US Dollar terms. The MSCI lost 3.98%, the S&P500 3.46%, and the ASX 200 lost 3.03% - the first two indices are in USD terms and the latter in AUD. So, we beat the market. Actually, I am recently seeing better performance on market declines than has been the case in the past.
I sold some shares in Platinum Capital as they are overvalued and some international share fund units. I bought some shares of Clime Capital and other Aussie stock funds. Overall this resulted in a bit of de-leveraging as cash continued to pile up and I reduced debt. Total leverage fell from 32.9% to 30.1%. Looking a the returns on asset classes, large cap Australian shares lost 2.43% and large cap US stocks 2.3%. By contrast, hedge funds (mainly Platinum Capital) gained 3.21%.
Thursday, January 02, 2014
Moomin Valley Annual Report 2013
This year was much like 2012 career- and personal life-wise. Financially, the main difference is that the Australian Dollar fell from $US 1.0392 to $US 0.8928. This means that though it was another strong year for underlying investment returns, net worth in USD grew much more slowly than last year and in AUD terms much faster. In AUD we went from $759k to $1.097 million. In USD terms from $789k to $980k.
These are the annual accounts that sum each of my monthly reports for the year in Australian Dollars:
Non-investment income was up partly because of pay rises but also because I got some extra pay for taking on additional responsibilities at work. My pay will actually fall in 2014 as that has now ended. Also, there was quite a bit of work related expenditure refunds (see below). Investment income was twice as much this year as last partly because the portfolio was growing and investment returns were 25.6% this year vs. 16.9% last. It is hard to imagine that they will be this good again in 2014. As a result comprehensive income came in at $444k. Remember that this is an after tax result (mostly - investment earnings are computed pre-tax), also that $162k is locked up in retirement accounts.
Spending was at a record level of $88k. About $11k of this was work related etc. spending that was refunded. We did a lot of travel and recently started private health insurance. I estimate that if we were maximally frugal we could have spent just $49k, which is the item marked "needs" above.
As a result, net worth rose $339k. Saving from regular income was $109k.
Moomin Valley December 2013 Report
The Australian Dollar fell further this month from $US0.9124 to $US0.8928. This depressed gains in net worth in US Dollar terms. Net worth increased $4k to $980k In Australian Dollars we reached $1.098 million, up $A29k on last month. The monthly accounts (in USD) follow:
Other income is income not from investments or retirement contributions. It was high this month at $18.8k because both of us got three pay checks this month. Spending was normal this month at $4.8k ($A5.3k). As a result, we saved $14k from regular income.
We lost money on investments - $11.6k - mainly due to the fall in the Australian Dollar and an underlying gain of only $6.5k. Rate of return for the month was -1.19% in USD terms or +0.98% in Australian Dollar terms. The MSCI gained 1.76%, the S&P500 2.53%, and the ASX 200 gained 0.79% - the first two indices are in USD terms and the latter in AUD.
This month I subscribed to the Platinum Capital rights issue for $A7.75k, this was the largest investment move of the month. Every month we automatically add $A1k to each of mine and Snork Maiden's Australian managed fund accounts and save around $3k in superannuation (retirement) with our employers funds. I also added $3k to Snork Maiden's managed fund account - added equal amounts to property securities and fixed interest funds to rebalance things. So then the remaining saving was in cash. Strong investment performers this month were Platinum Capital (PMC.AX) and IPE.AX. The worst performing investment was Qantas. The Winton managed futures fund had a second positive month. So far, so good. Private equity, foreign stocks, and hedge funds were the best performing asset classes, while Australian stocks were weak. Next year, I think I will report our monthly accounts primarily in Australian Dollars as that is how we think about them and it seems that the Australian and US Dollar will get further apart still. Coming soon: our annual review.
Wednesday, January 01, 2014
Managed Accounts Finally Above their Pre-GFC Investment Values
Two of my Mom's managed accounts - one in US stocks and one in international stocks are finally worth a bit more than the amounts we invested in 2007 and 2008 in what were retrospectively ill-timed moves and in one case with a manager who turned out to be have serious issues down the track. Like going out of business issues. This is why it has taken so long to get back above what was originally invested despite the strong performance of U.S. stock indices for a while now. Several funds in her main account are also still losing money. They are all the commodities/futures funds investments and several emerging markets funds (Brazil, India). But this month the portfolio hit a new high, though numbers aren't very accurate as I only update data on spending accounts once a year or so. Investment return this month was 1.25%.
2013 Outcome and 2014 Forecast
In Australian Dollar terms we came in above the top of 2013's predicted range for net worth of $A700k-$A1 million with a final net worth of $A1.098 million. In US Dollar terms the forecast was $500k-$1 million and we ended at $US980k, very close to the top of the range.
For this year, my most optimistic forecast is $A1.4 million, which assumes that the Australian Dollar falls to 85 cents and the stock market does well again. The least optimistic forecast is $A1 million which assumes a significant fall in the market and the Australian Dollar at 75 cents. The corresponding US Dollar range is $US1.19 million to $US0.75 million.
Monday, December 23, 2013
Predicting Stock Market Returns
This correlation is pretty amazing. It is also pretty clear that there is causation here too or both variables are driven by the same other causal variables.
Monday, December 02, 2013
Moominvalley November 2013 Report
Turns out that I miscalculated and we didn't quite reach USD 1 million last month. This month due to the fall in the Australian Dollar we are further below it to $975k. In Australian Dollars we reached $1.069 million, up $A14k on last month. The monthly accounts (in USD) follow:
Spending was high this month. First, I had a bunch of business expenses for a trip early next year. Then I had to pay my employer a refund of half the price of an airline ticket for our trip to the Northern Hemisphere this past Northern summer. Otherwise, they decided retrospectively that they would have to pay fringe benefits tax and they don't want to do that... We still spent about $A6k after deducting these which seems to be the new normal. As a result we only saved $2.8k from regular income.
We lost money on investments - $28k - mainly due to the fall in the Australian Dollar of about 3 US cents. Rate of return for the month was -2.87% in USD terms or +0.83% in Australian Dollar terms. The MSCI gained 1.04%, the S&P500 3.05% (the unstoppable Energizer Bunny), and the ASX 200 lost 1.31% - the first two indices are in USD terms and the latter in AUD.
I made a major investment in managed futures as already mentioned in the blog. This month I will subscribe to the Platinum Capital rights issue for about $A7.5k. At the end of November our allocation of gross assets looked like this:
Of course, this isn't the same as the allocation of net worth due to leverage. Total leverage is about 34% i.e. 34 cents borrowed for each dollar of net worth. We retain that much cash while borrowing due to looking still to buy a house...
Sunday, December 01, 2013
Investments Update
Stock markets remained very strong globally, and particularly in the United States, this month, but not so much in Australia. The ASX 200 actually fell 1.31% while the SP 500 rose 3.05% both in local currency terms. The MSCI World Index was in between with a 1.46% increase in USD terms. Australian small caps were particularly weak. Our small cap investments lost 2.58% while our large cap Australian stocks bucked the trend and gained 0.82%.
A lot of our funds and stocks are hitting all time max profits for us
Colonial First State Geared Share Fund (Aus managed fund)
Unisuper (industry superannuation fund)
PSS(AP) (industry superannuation fund)
Colonial First State Diversified Fund (Aus managed fund)
CREF Global Equities (US retirement fund)
Colonial First State Geared Global Share Fund (Aus managed fund)
Generation Global Fund (Aus marketed managed fund from Generation)
Boulder Total Return Fund (BTF)
Colonial First State Diversified Fixed Interest Fund(Aus managed fund)
Macquarie Winton Global Alpha Fund
So diversifed and international funds and large cap Australian stocks are providing us with good long term returns. Australian small caps have been good but not in the past month.
Looking at my Mom's investments, finally we seem to have exceeded the pre-global financial crisis peak. Some funds though are worth less than what we paid for them and some more (we don't track the dividends from funds that pay out dividends so this isn't very accurate). What has done really badly are India and Brazil funds and commodities funds somewhat less badly. Hedge funds, large cap developed country stocks, diversified funds have done well in the long run.
Tuesday, November 26, 2013
Second Investment in Managed Futures
I have long seen the advantages of managed futures funds. The best of managed futures funds companies seems to be Winton. I previously made an investment with Man-AHL. The fund hasn't made much money for us, but did much better in the financial crisis than most of my other investments. We have 0.80% of net worth invested in the fund. We also have some investment in commodities via GTAA. Another fund that hasn't done much of anything so far. Now I have made an initial investment in a Winton fund offering. The investment is 4.6% of net worth. This takes exposure to commodities out of net worth to 6.0% and out of gross assets 4.5%. The main downside to this fund is that in Australia it doesn't have any tax advantages compared to stocks, which have strong advantages. This means that this will likely remain a small diversifying investment until maybe one day I set up a self-managed super fund, which is a tax advantaged structure itself.
How does this fit into our overall investment strategy? Basically we have a 60/40 portfolio with 60% in stocks and 40% in other investments. Within the stocks 2/3 are planned to be Australian stocks and 1/3 foreign. Within those categories we also allocate to large and small cap Australian and to US and non-US stocks in proportion to their market capitalizations. In the 40% other we have allocations to: bonds, real estate, hedge funds, commodities, private equity, cash, and other. The whole portfolio is then levered to provide about a beta of 1 to the stock market and rebalanced on an ongoing basis. The leverage of a diversified portfolio is an idea from the risk parity approach. 60/40 is simply the traditional stock-bond ratio used for diversified portfolios, and we weight heavily to Australian stocks for tax reasons. Several of the supposedly non-stock investments are in fact Australian listed stocks that are listed investment companies pursuing alternative investment strategies. A lot of the leverage is obtained by investing in leveraged (geared) managed stock funds rather than using margin loans ourselves. We keep the actual margin loan quite small most of the time. This is because the interest rate we can get is much worse than what the funds can get. Interactive Brokers has much better interest rates, but they aren't giving loans to Australian investors at the moment. All this seems to me a reasonable strategy for a non-high net worth investor based in Australia.
Friday, November 01, 2013
Moominvalley October 2013 Report
Following hitting one million Australian dollars net worth last month, this month we reached a million US Dollars. $US1.008 million to be precise, up $US49k on last month. In Australian Dollars we reached $1.064 million, up $A38k on last month. The monthly accounts (in USD) follow:
Income was boosted a bit this month due to a gift of RMB 10k that Snork Maiden got when she visited China. She also spent a lot of that there and so we spent $5,846 for the month. We still saved almost $9k from regular income but our spending is gradually inching up and saving down as you would expect when our spending is still so low relative to income. Our annual spending level is around $80k per year. The following chart shows a moving average over the previous 12 months of spending for the year very roughly adjusted for inflation:
The big peaks are mostly international moves (like in 2007), or in recent years big international trips, like our trip to 3 continents this year... Of course, after mid 2007 the data are for us as a couple and before that they are for just me, Moom, alone.
Rate of return for the month was 3.92% in USD terms or 2.51% in Australian Dollar terms. The MSCI gained 4.04%, the S&P500 4.60%, and the ASX 200 3.97% - the first two indices are in USD terms and the latter in AUD.
I moved $US10k during the month from Australia to the US to pay off my margin loan with Interactive Brokers. I also did some switching out of large cap Australian stocks to diversified funds and global shares to rebalance as the Australian stock market was very strong and the Australian Dollar rose during the month too. I'm looking in the coming month to make a big (well less than 5% of net worth, but that is fifty thousand dollars) investment in managed futures. Having trouble with the application process, in the meantime.
Friday, October 18, 2013
And in US Dollars Too
As the Australian Dollar has risen strongly in the last few days, it has pushed us over the 1 million US Dollar mark, at least intra-month, too.
Saturday, October 12, 2013
Moom's Taxes 2012-13 Edition
My taxes are not so much changed from last year as things have settled down a lot now, compared to our first few years in Australia:
Salary (no employee super contributions so that is the actual salary) was up 12.3%. Interest up dramatically due to our house buying fund. Dividends and managed fund distributions up more modestly. Deductions were down on the whole. Tax payable up 19.4% due to lower deductions and the increase in Medicare surcharge etc. as a result after tax income didn't rise as much.
I expect to pay $1440 extra tax. I actually increased my CGT loss carry-forward this year, taking it from from $82k to $83k! That's a tax asset worth about $31k, which we don't include in our regular net worth spreadsheets.
Snork Maiden's Taxes 2012-13 Edition
I've finally done our tax returns for this year. First, is Snork Maiden's taxes.
Blogpost on last year's taxes in order to compare with this year. In Australia there is no such thing as a joint tax return but increasingly married couples have to enter data in their tax return on their spouses finances as more things are being assessed on a household basis such as the Medicare Surcharge Tax. So, actually I need to do them at the same time. Anyway, here is a summary for Snork Maiden:
Her salary is actually higher than this. Employee superannuation (retirement) contributions are not counted in the taxable income - so-called "salary sacrifice". They amounted to about $A10k. Salary was up 11.5% on last year and taxable income including investments was up 12.5%. Distributions from managed funds and capital gains were up dramatically. I also compute a real income number before and after tax (up 15.2%) that puts back in some of the deductions which are purely imaginary. For example, long-term capital gains are taxed at half the rate of ordinary income but instead of using half the tax rate, half the capital gain is deducted from taxable income.
It looks like she owes about $500 extra tax this year.
Update on Interactive Brokers
E-mail from IB this morning telling us Australian investors who have margin loans with them that we have to close out our margin loans by 11th November. This follows the previous e-mail saying that we couldn't open any new positions until we paid off the loan. So, I will be transferring money to the US to pay off the loan. I plan to use Ozforex for this. They do say that they hope to be able to offer margin loans to Australian customers again with 6 months.
Lots of Nice Head and Shoulders Patterns in the Markets
It looks like the US markets are expecting a US default or something despite the rise in stock prices over the last two days. Of course, if the crisis is really solved the market will likely go higher but if not, it will play out as a classic textbook technical analysis pattern. My favorite indicators are also pointing down:
Sunday, October 06, 2013
Investment Returns Since the Financial Crisis
Following up on yesterday's post comparing global, US, and Australian index rates of return and my own investment performance, today's post looks at the period after the low in the stockmarkets in March 2009. I also compare everything properly in both USD and AUD terms. First, in US Dollar terms:
Initially I tracked the ASX200 very closely coming out of the low but then gradually got pulled down by the lower performance of foreign shares. In the last year the ASX has underperformed foreign shares and that too seems to drag on our performance. Seem to be getting the worst of both worlds rather than the best! In AUD terms things look a bit different (just use the AUD/USD exchange rate to convert everything to AUD values):
Foreign shares performed poorly coming out of the financial crisis. Since mid 2011 they have outperformed Australian shares and as a result I've underperformed the foreign indices in that period.
Saturday, October 05, 2013
10 Year Rates of Return: ASX200 vs MSCI, SPX, and Moom
Another way of showing just how extraordinary the performance of the Australian stockmarket has been in the last couple of decades. I've posted this graph before, but now I've added the rate of return of the ASX200 index, which is the 200 largest stocks by capitalization on the Australian share market:
Returns are the average annual rate of return over the 10 years previous to the date marked. The ASX almost hit 15% per annum over ten years at one point! This maybe isn't a fair comparison as Moom, MSCI, and S&P500 are returns in US Dollars and the ASX200 is the return in Australian Dollars. ">Again you can see that I track the MSCI pretty closely.
Thursday, October 03, 2013
Investment Performance Against 4 Different Indices
BigChrisB sent me the ASX200 Accumulation Index data
he had collected and I have now measured my investment performance since 1996 (monthly data) against it and compared that to the other indices I've been tracking performance against:
The table shows that you get very different performance figures depending on which index you benchmark against. First the MSCI World Index in USD terms and using the US risk free rate to do the standard CAPM regression analysis. In other words, I measure my investment returns in US Dollars too. Estimated beta is 1.23 - a 1% change in the index is associated with a 1.23% change in my portfolio. Alpha is 0.44% which means I am beating the index on a risk adjusted basis. My monthly percentage rate of return is most correlated with the returns of this index. R-Squared is 0.74 which means that 74% of the variation in my rate of return is explained by the changes in the index. Results are quite different when I measure my rate of return and that of the index in Australian Dollars. The R-Squared is only 0.39, beta is much lower, and alpha is a little negative. Switching back to US Dollars my correlation with the S&P 500 is worse than with the MSCI but I underperformed the index by 1.6% per year, risk adjusted. Finally, in comparison to the Australian ASX 200 index and measuring things in Australian Dollars I underperformed by 3.89% a year, beta is 0.89 and R-Squared is 0.51. The ASX has been a fantastic performer over this period of time:
This explains why I benchmark against the MSCI in USD terms even though I live in Australia.
Tuesday, October 01, 2013
Moomin Valley September 2013 Report
The main news this month was passing the one million Australian Dollar net worth mark. In other news, I spent two weeks this month in Northern Europe, but that hasn't had any impact on the figures after I deducted the refundable component to get "core expenditure", which was only $3,900. This month's accounts in US Dollars, as usual:
Current other income was a little higher than usual due to the refund I got for the European trip. I have the answer to last month's question as to why Snork Maiden's pay was a bit higher than expected. She got promoted one notch on the pay-scale but this happened after the regular union negotiated pay rise kicked in on 1 July though it was retroactive to 1 July.
The Australian Dollar rose this month to 93.41 US cents, which boosted investment returns in USD terms. As you can see from the table about 2/3 of USD investment returns were exchange rate gains.
I still have to file tax returns for both of us. I actually got a letter from the ATO telling me I was running out of time. I thought that was cheeky given the deadline is the end of this month.
One Million Australian Dollars
We reached the long-awaited million Australian dollar net worth level. We aren't quite at a million US Dollars yet. It was back in 2007 when we first crossed a half million Australian Dollars mark for the first time and in 2008 we briefly touched half a million US Dollars. In between there was a global financial crisis, a marriage, and a move to Australia... well in reverse order... attempts to make a living as a trader, being unemployed, and then getting back onto the career track at a higher salary than before:
I actually thought yesterday when the Australian market was falling 85 points (1.6%) that we wouldn't remain above the line at the end of the month. Actually, the Geared Share Fund fell 3.3% on the day but was still up 5.5% on the month.
So the numbers come in at $A1.026 million or $US 958k. Rate of return for the month was 8.63% in USD terms or 3.5% in Australian Dollar terms. The MSCI gained 5.2% and the S&P500 3.14%. More accounting details to come.
Sunday, September 29, 2013
Sources of Data on Stock Market Accumulation Indices
It's easy to get real time information on a wide range of stock market indices and historical data on a daily basis from sites like Yahoo Finance. But getting data on accumulation indices is much harder. Accumulation indices or in US terminology "total return indexes" include dividends in the index return. So they track how much your money would be worth if you could invest in the index and then reinvest all dividends without paying taxes or management fees. I have collected data on the MSCI All Country World Index and S&P500 total return index going back to 1996. My current sources for these indices are here and here.
The MSCI site allows you to select different pages of index returns using menus. I use the ACWI for the Developed and Developing Country, Gross returns, and Standard (midcap and large cap) options. Gross returns also include tax credits. I would include small caps, but that data wasn't available when I started following the series. You can select the data for any date you like.
At the S&P website you need to get the daily fact sheet on each index which includes price only and total return indices. The only way to get exact end of calendar month data is to collect it on the last day of each month. It seems that you now need to subscribe to get historical data. They used to provide a few months for free. You can get Australian indices here as well as the US ones I usually collect from here.
Bigchrisb recently linked to another source for the Australian ASX200 accumulation index - statistics provided by the Reserve Bank of Australia. You can get monthly data for a few recent years there.
Monday, September 02, 2013
Moominvalley August 2013 Report
We have been back home all this month and spending modestly by recent standards. This month's accounts in US Dollars, as usual:
Retirement contributions were higher than normal at $3,630 (AUD 4079) because Snork Maiden got an extra retirement contributions in after last month's three paychecks. Hmmm... I must be missing a contribution somewhere. But there is in fact little line between three paycheck months and three retirement contribution months as retirement contributions don't seem to be sent to the fund on as precise a timing as employees get their cash payment. Snork Maiden's pay was also a bit higher than expected. I haven't checked why.
The Australian Dollar fell a little more this month to exactly 89 US cents. Investment returns in US Dollar terms were 0.68% but in Australian Dollar terms they were 1.34%. For a change, we did much better than global markets due to our focus on Australia. The MSCI lost 2.04% (USD terms) and the S&P 500 2.90%.
Net worth rose in US Dollars by $17k to $873k. In Australian Dollar terms it rose by $A25k to $A981k. Unless there is a sharp fall in the markets we would clear 1 million Australian Dollars this month or next. But this time of year is often volatile :) September has been the second worst month since I started investing (May is worst), while October has been the best. That's surprising given its reputation for stock market crashes. In this timeframe (since 1996) the worst month for both the international indices I track has actually been August and the best April.
Saturday, August 17, 2013
More International Investing Red Tape
It used to be that one advantage of being an Australia based investor was that you could invest in any investment product anywhere in the world and as long as you paid your taxes the government didn't mind. Of course, the taxes are relatively high compared to living in Hong Kong or Singapore but low compared to Western Europe. By contrast, US investors are heavily restricted unless they have a high net worth and become "accredited investors". But it seems the red tape is increasing (not surprising under a Labor government). I have had an account with Interactive Brokers since I lived in the US. This includes margin lending and I currently am borrowing money from them. Their interest rates are much lower than those you can get with retail brokers here in Australia. But, I just got a message from them that Australia modified the Corporations Act in 2010 so that margin lenders to Australian clients all need some licence. IB was told at the time that they didn't need to get the licence modification but now they do. Therefore, until they get the licence approved I won't be able to make any new investments on margin. Of course, I can close positions and I could add enough money to the account to pay off the loan and then continue to make new investments. No problem with trading futures as IB isn't lending money on futures trades. I haven't done any futures trades for several years. They gave us the option of closing our account at this point. Of course, I affirmed to keep my account open.
Thursday, August 15, 2013
Ten Years of Tax Credits
The chart shows our annual total of investment tax credits over the last ten years. These consist of credits attached to dividends for corporation tax paid by Australian companies known as "franking credits" and tax withheld on dividends in some countries. The US withholds tax on foreign investors, the UK does not. This doesn't include the atx credits in our superannuation (retirement) funds.
Because of investment expenses we end up with excess credits beyond the tax due on the dividends. We can use these to reduce our tax bill on a one to one basis. But with a $A60k joint annual tax bill we would need 20 times our current liquid assets to wipe out our tax bill. That's something like 10 million dollars. So this strategy is only making a somewhat marginal impact at the moment. Tax credits have not yet exceeded the pre-GFC high, despite liquid assets being 45% higher now. Liquid assets are all non-retirement investments before deducting debt.
Sunday, August 11, 2013
Vote Compass
The ABC have a website called Vote Compass that is meant to help in deciding who to vote for in our upcoming federal election here in Australia. I came out as a little socially liberal and right of centre economically and closest to the Liberal National Party. This wasn't a surprise at all. But it was still fun to do the survey. Snork Maiden was about as socially liberal as me but left of centre. Both of us are in the space between the Labor and Liberal parties.
I just saw that Enoughwealth has also done the survey. He came out as more socially conservative and right wing than the Liberal National Party.
Friday, August 02, 2013
Health Insurance, Part 2
So the consultant I met last week didn't send me any quotes... When I phoned the company she hadn't entered any of my details into their system either. So, I talked to a couple of consultants who were willing to give me actual quotes. The hospital cover plan we are looking at would cost $253.39 per month for the two of us including the lifetime health care cover and the 10% tax rebate and a $500 excess on hospital admission (only paid once per year per person if you need to go to hospital more than once). That's $3040 per year. My estimate of the Medicare surcharge is $3,100. So, it is about a breakeven in terms of upfront fees, as I expected. It turns out that my understanding of the lifetime health cover fee was wrong. If you don't join a private health scheme within a certain time of returning to Australia or immigrating and becoming eligible for Medicare then you pay the full loading. Your time out of Australia doesn't count. So our average loading would be about 20%.
I'm now thinking about the "extras" package, which covers stuff like dental and optical. The cheapest package adds $508 a year in costs, but none of their preferred optical providers are in our state and the benefits you can get on dental are also low outside of Victoria and South Australia which seems to be their major base. So, I don't think that extra package makes sense. Snork Maiden tends to use these services when she visits China.
This is our corporate health insurance deal. Probably, I should look at another quote before deciding on it.
P.S. 12:24pm
I just discovered this great government website that lets you compare alternative policies.
Thursday, August 01, 2013
Moominvalley July 2013 Report
Half of this month we spent travelling. Given that, spending is fairly modest. The Australian Dollar continued to fall, boosting returns in Australian Dollar terms and reducing them in US Dollar terms. This month's accounts in US Dollars, as usual:
Income was very high as this was a three pay month and we also got some refunds for the travel expenditure. The difference between "Expenditure" and "Core Expenditure" is due to business-related travel spending. Core expenditure gives a better idea of how much we are really spending while the total expenditure is needed to actually make the numbers add up. As a refresh, there are quite a few anomalies in the way I report our accounts. Other income, which is salary and other non-investment income (current income), as well as retirement contributions, is reported after tax and also include the proceeds to net tax refunds. Investment income (both current and retirement) is reported pre-tax including tax credits (Australian "franking credits" and foreign tax paid). We don't actually receive these credits - they reduce our tax bill at the end of the year - so I need to deduct them from the reported investment return to get the actual change in net worth each month. This is because net worth only reflects the actual money in our accounts at the end of each month. If we went to an accrual based system I could also add the value of my capital gains loss tax asset - worth $35k or so - but that would be a big complication for little or no gain. So, I stick with this system which works well for me. I only really care about what we get after tax and what we have now, but I want to see investment returns on a pre-tax basis to compare them with the market indices.
The Australian Dollar fell sharply this month resulting in investment returns in US Dollar terms of 2.33% but in Australian Dollar terms of 4.73%. This again lagged the market. The MSCI gained 4.82% (USD terms) and the S&P 500 5.09%.
Net worth rose in US Dollars by $34k to $861k. In Australian Dollar terms it rose by $A59k to $A961k. This has really been a stratospheric rise since mid 2011:
Non-retirement profits in AUD terms also finally got above zero again. Profits on retirement accounts are well above the pre-GFC high:
Saturday, July 27, 2013
Health Insurance
So I met with the health insurance representative on Friday and she will send me quotes next week for various plans. With a basic plan we will save money compared to the Medicare surcharge. At our income level the Medicare surcharge is 1.25% of income which would be about $3,125 per year. The basic insurance package for our couple would be about $2,200 per year. But there are lots of "extras" you can add on. A complicated topic is the Lifetime Health Cover policy. This was introduced in 2000 by the Australian government and is meant to encourage people to take out private health insurance at a young age to avoid the adverse selection problem. It means that the cost of your insurance premium rises by 2 percentage points for each year you are over 30 years old after 2000.... For me this means that as I had my 30th birthday in 1994, the penalty only started accruing after 2000 (I think). But then I was in the US for many years. Those years don't count towards the penalty. So, I figure the penalty for me is 12%. For immigrants the penalty only starts to be incurred from after they become eligible for Medicare (and are older than 30). So for Snork Maiden I reckon her penalty is 6%. Therefore, our combined penalty is 9%. The government also offers a tax rebate for having private health insurance. At our income level this is 10%. So the penalty and the rebate should roughly cancel out and can be ignored when looking at the costs of the different policies.
Explanation for non-Australians - Australia has somewhat free public health care but their are tax incentives to get private health insurance. There is a surcharge which is 1-1.5% of your total income when your household income exceeds a certain level and you don't have insurance and there is a tax credit of 0-30% of the cost of health insurance, which is higher at lower income levels. There are also penalties for delaying getting health insurance after age 30 which are applied for the first ten years after you first buy private health insurance.
Thursday, July 25, 2013
Excess Superannuation Contributions
I just saw this on the Colonial First State website:
"More generous rules for excess contributions:
In the past, if you went over your concessional contribution cap accidentally or otherwise, you’d be penalised effectively by having to pay the highest tax rate on the excess amount. But from
1 July 2013, you pay tax at your normal marginal tax rate on any excess concessional contributions, plus an interest charge. You'll also have the ability to withdraw up to 85% of any excess concessional contribution made. Note that this does not apply to contributions you have made in excess of the concessional cap before 1 July 2013."
I had heard there would be some change to the excess contributions regime but didn't know the details. But this is pretty unclear. Looking at the ATO website they don't have any clear information available yet on exactly how it would work. It looks like you can pay the extra tax at your own marginal rate and leave the money in the fund. The longer you wait to pay the excess tax, the more interest you will pay. But the ATO also says that "you will be liable for the excess concessional contributions charge." It doesn't say how much that will be - or perhaps that is the interest that the other articles I found mention.
I am stuck making excess contributions (more than $25k currently) because the universities' superannuation scheme has employers contributing 17% of your salary to the fund. And, no, you can't get them to reduce it or pay part of it as a "non-concessional contribution". At least the excess for me is less than $1000. In Snork Maiden's case I just realised that after the latest round of pay increases she will now be over the cap. We have been contributing $400 every two weeks as a "salary sacrifice" contribution on top of the employer contribution of 15.4%. We'll reduce this to $350.
Blog List
I finally upgrade Moomin Valley to a new Blogger template but in the process lost my previous blog list. A lot of the links were dead anyway. I've added a few back. If you would like your personal finance or investment blog added, let me know and if I like it, I'll add it. I'm more interested in the investing/business direction and less in frugality/getting out of debt.
Also, what's up with the NetWorthIQ badges? I re-added the code to the blog but nothing shows up :( If you know a hack, please let me know too.
Wednesday, July 24, 2013
Houses, Shares, Taxes Again
OK, so now we are not renting a house. We looked at four. Two were acceptable. But now Snork Maiden's mom says that she won't visit Australia till we buy a house and so we'll stay put for the moment. There aren't a lot of interesting houses on the market at the moment at this time of year.
I completed the four share purchases with shares in CAM.AX and IPE.AX.
Enoughwealth sent me a useable copy of the Australian tax form. It combines all three regular tax forms (the main form, the supplementary form, and the business items form) into one and unlike other Australian tax forms it isn't very colorful and instead of having separate boxes for each letter or number it has freeform entry boxes - compare to the sample individual tax return. But all the items and labels are exactly the same. It's weird, but I don't see why not to use it.
Monday, July 22, 2013
Houses, Shares, Taxes...
After looking at another couple of houses at the weekend and not agreeing on which we preferred we have changed direction and are now looking to rent a house or townhouse as a midway step to buying a house. Snork Maiden's mom is probably coming to visit for a while (months) and though we previously reorganized this apartment to accommodate her and her now deceased husband we aren't prepared to do that this time. We are much better off now and so have other alternatives. One option would be to rent her a furnished apartment nearby, but she's not keen on that... So we have four houses lined up to look at in the next three days. Rents range from $A570 to $A650 per week compared to $A490 in our current apartment. One ($A650) is actually nearer to the city centre, the others a little further out. One house is almost identical to another we looked at to buy a few doors down. Snork Maiden didn't like the small garden or lack of trees in the (new) neighborhood. But if we're not buying permanently...
I also just put in four orders to buy shares in listed funds here in Australia. Two have already executed (OCP.AX and AOD.AX). My margin loan was down to only $A15k. But if we are not likely to buy a house very soon then I don't need the extra borrowing capacity. We are still keeping a huge amount of cash on hand. You never know when the ideal property would show up. If we rent a house though it would be a 12 month lease. You can get out of that but it could be costly. With high occupancy rates still, it shouldn't be too hard to find someone else to rent in these locations.
The financial year here in Australia ends 30th of June so we are again in the run-up to filing tax returns (deadline 31 October). I've done a preliminary assessment and both of us probably owe more tax. For me it is over $1,000. This is going to mean that I will need to pay quarterly taxes in future :( The reason it is so high is that as we still don't have private health insurance I need to pay 1% of my income as the Medicare surcharge. On top of that my interest earnings are more than $3k due to our house-buying cash stockpile. On Friday I'm meeting a health insurance salesperson (sorry, consultant) who is offering a lower corporate health insurance rate. So, hopefully in future I can avoid the quarterly tax payments. It's also an incentive to increasing the margin loan again. I tried to do Snork Maiden's taxes using the ATO's E-Tax software now that they have a Mac version. It was a frustrating experience and I gave up. Crazily, you can't download a pdf of the main tax form! Only a sample copy. You have to get a hardcopy from the ATO in the mail or from their "shopfront". What I would really like is a web-based tax form that I can just fill numbers into without dealing with all the silly questions in E-Tax, or a typable pdf. I am going to get a hardcopy and again submit paper tax returns until they get the system more user friendly.
Sunday, July 14, 2013
Moominvalley June 2013 Report
Finally back in Australia after another long trip to Europe, Asia, and Africa. This month's accounts in US Dollars, as usual:
Unlike last month we managed to save some money this month ($8,108 from current non-investment income) but still spent $6,412, which isn't too bad given all the travelling. There will probably be a similar level of spending in July too.
The Australian Dollar fell sharply this month resulting in investment returns in US Dollar terms of -5.46% but in Australian Dollar terms of -0.94%. As a result net worth fell $US36k but rose $3k in Australian Dollar terms to $A901k.
Monday, June 03, 2013
Moominvalley May 2013 Report
Short report this month. I am travelling, currently in Charlottesville VA and about to go out to do some shopping.... Long trip from Australia via Canada yesterday... Here are the monthly accounts:
The Australian Dollar fell sharply resulting in steep losses in USD terms. US Dollar net worth is down $70k. This way underperformed the MSCI World Index. Australian Dollar net worth was flat as investment returns were -1.42% in currency neutral terms. The Australian Dollar is still overvalued of course (will report back from my shopping trip maybe on that)... We spent a record amount, actually dissaving a little bit this month. Most of the expenditure is on planned travel. $3,500 at least was reimbursed but still is recorded as expenditure. A big chunk though is associated private travel.
Wednesday, May 01, 2013
April 2013 Moominvalley Report
Yes, I haven't posted anything since last month's report, but I didn't post much on my professional blog either. It's been a busy time - teaching and everything else... Now starting to plan trips for June and July. I've booked a trip to Canada and the US. Will be in Ontario and Virginia in the first week of June. I'll be back in Australia for 10 days and then heading for Spain and Middle East/Africa. It will be my first trip to sub-Saharan Africa - I have been to Tunisia before - with two new countries to add to the visited list. I have a guidebook with a picture of giraffes on the cover right next to me as I am typing this.
Another up month... In USD terms it is the 11th up month. In AUD and currency neural terms we were down a little last month though. We yet again hit new net worth highs in both Australian and US Dollar terms of $A8889k (+$A31k) and $US923k (+$US28k).
Our rate of return was 1.97% in USD terms versus 2.92% for the MSCI and 1.93% for the S&P500. US stock markets were very strong and the Australian stock market relatively weak. In Australian Dollar terms we gained 2.52%. All asset classes gained apart from small cap Australian stocks (-2.62%). The best performing asset class was large cap Australian stocks (+3.32%). The monthly accounts (in US Dollars) look like this:
Non-investment income was a bit above normal and spending was the high side. Snork Maiden was traveling in North America. Total investment returns were $17k with USD returns suffering from the rising US Dollar. Saving in the table is saving from non-investment income.We saved almost $8k from our salaries not counting the retirement contributions of $4k. The latter were inflated, by a third payment this month from Snork Maiden's employer - all salary and other payments are paid every two weeks in Australia.
Tuesday, April 02, 2013
Moominvalley March 2013 Report
Finally, we had a slightly down month in investment returns in Australian Dollar terms though the streak of gains extended to the 10th month in USD terms. We yet again hit new net worth highs in both Australian and US Dollar terms of $A858k (+$A9k) and $US895k (+$US25k). The Australian Dollar rose to $US 1.0426.
Our rate of return was 1.38% in USD terms versus 1.88% for the MSCI and 3.75% for the S&P500. US stock markets were very strong and the Australian stock market relatively weak. In Australian Dollar terms we lost 0.43%. Real estate was the best performing asset class and Australian small cap stocks the worst. The monthly accounts (in US Dollars) look like this:
Non-investment income was normal as was spending. We spent $A220 on a lawyer looking over the contract for the house that we didn't buy. Total investment returns were $12k with USD returns suffering from the rising US Dollar. Saving in the table is saving from non-investment income.We saved almost $10k from our salaries not counting the retirement contributions of $3k.
Monday, March 11, 2013
Money Burning a Hole in Your Pocket
Snork Maiden's stepfather died. He was 80 years old. Her mother is much younger. Snork Maiden has gone to China to be with her mother for a while. Her mother wants to visit Australia later this year, maybe starting in late October for a while and think about spending more time here in the future. She wants to transfer some money to our account here to help pay her expenses in Australia so that she can be more independent than when she and her husband visited last time. If we still are living in this apartment we could try to rent her a furnished unit somewhere nearby. We saw a couple of these last year when were looking for accommodation for a colleague (in the end they stayed on campus), but they weren't that near here.
But she wants to transfer the money today. One reason is so that Snork Maiden can help her with the transaction, which involves moving a "pile of cash" between two banks. Snork Maiden said as well that:
"She is in a hurry because she doesn't want to sit on a pile of money for long. She got a fixed-term pile of money that is ready to be harvested today, and she wants to decrease the number of transactions as much as possible. I suggested we could put the money in her saving account for the time being, but she said that was too complex and she has never had that much money sitting in her account. It was my stepfather who dealt with their money, so she has never touched so many cash before, and even the thought of having that much of money in her bank account somehow worries her. "
In the past I heard she would give money away to relatives rather than hold onto too much. It made me think of this story. A lot of people asked how it could be that a 68 year old full professor in a low cost of living location didn't have any savings. One answer is that some people just don't seem to be able to hold onto money for psychological reasons. Obviously, I don't have that problem. So, I'm going to look after her money for her.
Subscribe to:
Posts (Atom)