People tend to think they are less relatively wealthy than they are. You can check out your perceptions against reality for a number of countries here. I'm not surprised. According to the official statistics we are in the top 4% of households in Australia by wealth. But looking around, it certainly doesn't feel like that could be true.
Our house is only valued a few percent above the median for our city. Our car is a 15 year old Ford when it feels like the roads are full of luxury vehicles. But it's not like we are saving like crazy. In 2018, we spent almost all of what we earned from salaries. Apparently, a lot of people feel the same way.
Monday, February 04, 2019
Friday, February 01, 2019
January 2019 Report
In January stock markets rebounded but because the Australian Dollar rose, we didn't gain a lot in Australian Dollar terms. The Australian Dollar rose from USD 0.7049 to USD 0.7274 The MSCI World Index rose 7.93% and the S&P 500 8.01%. The ASX 200 rose 3.87%. All these are total returns including dividends. We gained 0.49% in Australian Dollar terms and 3.79% in US Dollar terms. So, we underperformed the markets. This is not surprising given the weight of cash and bonds in our portfolio. Our currency neutral rate of return was 1.89%. I estimate that the target portfolio gained 1.57% in Australian Dollar terms.
Here again is a detailed report on the performance of all investments:

The table also shows the shares of these investments in net worth. At the bottom of the table I also included the Australian Dollars return from foreign currency movements and other net investment gains and losses - net interest and fees. The loss on the apartment is the estimated sale costs.
Things that worked very well this month:

The main driver is continued movement of cash from my US bank account to Interactive Brokers where I am buying bonds before eventually transferring some of the money to our Australian bank accounts when the broker allows. Also, we sold the apartment we inherited.
On a regular basis, we also invest AUD 2k monthly in a set of managed funds, and there are also retirement contributions. Then there are distributions from funds and dividends. Other moves this month:
Here again is a detailed report on the performance of all investments:

Things that worked very well this month:
- The China Fund - the fund has announced a tender for 30% of outstanding shares at 99% of NAV. The share price is rising towards NAV as a result. I tendered my shares into the buyback. At least it will probably realise a small capital loss.
- Pershing Square Holdings. This bounced back nicely from December losses and we are now up in this investment.
- Unisuper. This is after a steep fall in previous months. I continue to be surprised how much higher the beta of Unisuper is compared to PSS(AP). Both are public sector superannuation funds and we supposedly have a similarly aggressive stance in each.
- US Dollars - The Australian Dollar rose, especially after the statement from Jerome Powell.
- Cadence Capital - It continues to lose money and is now our third worst investment ever in terms of dollars lost. The fund manager explained that they focus heavily on value stocks and those got trashed.
- Yellowbrickroad...

On a regular basis, we also invest AUD 2k monthly in a set of managed funds, and there are also retirement contributions. Then there are distributions from funds and dividends. Other moves this month:
- I moved AUD 30k from the CFS Geared Share Fund back to the CFS Conservative Fund in my CFS superannuation account. I originally moved this money in October to CFS Geared Share Fund. I made a small profit on the roundtrip trade, but the main motivation for closing the trade was to reduce risk.
- I bought 1558 shares in OCP.AX at AUD 2.07 a share just because they were being offered so low.
- I sold 15,000 shares in PMC.AX and bought 5000 shares in PIXX.AX as the PMC premium to NAV was still high.
- I bought AUD 24k during the "flash crash" and sold them after the Australian Dollar recovered a few cents.
- I bought 1000 shares of PERLS XI as I can't move the Australian Dollars I bought in December to our Australian bank account yet.
- I bought USD 100k of treasury bills maturing in February.
- I bought USD 100k of Santander UK bonds maturing in March.
- I bought 1000 shares of the gold ETF, IAU.
Wednesday, January 30, 2019
Understanding Increase in Spending Better
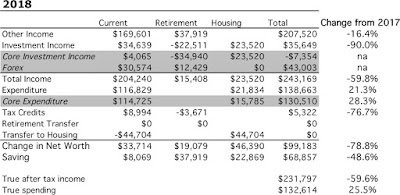
I wanted to understand why spending in the 2018 calendar year was up 28% on 2017. The first step was computing a spending breakdown for the 2017-18 financial year. The period is different and the definitions of income and spending are different than in my usual accounts to make it more comparable with other income and spending breakdowns on the web. I now computed the spending breakdown for the second half of 2018 and we can compare monthly spending in this period to that in 2017-18:

Spending was up by 7.5%. So not as dramatic a growth rate. The biggest difference between the two periods, is that in the first period we spent a lot on travel and in the second on health. In fact, the travel spending was mainly in the second half of 2017-18 - i.e. in the first half of 2018. So, 2018 had high spending because of both travel and health spending being up strongly on 2017. The way I usually compute spending and income is to include any refunds for medical spending as income rather than reducing spending by the amount of the refund, which I am doing here. So, that pushed up spending even more. I'm glad I now understand why our spending increased so much.
Another major change is that cash spending was down in the second half of 2018. That was because I had access to the statement for my Qantas Cash card – only the last 13 months is online. In the previous period, I treated all spending on the card as cash spending.
Going forward, I expect medical expenses to be lower this half year and travel expenses to be much lower than in the first half of 2018. Given that, 2019 calendar year spending might be lower than 2018 spending.
Tuesday, January 29, 2019
Gold
Put my toes into the water by buying a small 0.5% position using the IAU ETF. I've posted about gold previously and it is in our long-term allocation to allocate 6% to gold.
Saturday, January 26, 2019
Spending Breakdown
After a discussion with friends at lunch yesterday and some blogposts I read recently, I decided to try to find out what we are spending on. I haven't done this in more than two decades I think. I looked at the 2017-18 financial year so that I can also easily include official income and tax figures in the total. It's all in Australian Dollars of course:

Income is gross income from our tax returns plus employer superannuation contributions which which don't enter taxable income. Income includes salaries and investment income etc.
Next we deduct taxes. As franking credits – tax credits for corporation tax paid by Australian companies are included in taxable income, they need to be deducted as we don't actually get the cash. Then there is 15% tax on superannuation (retirement) contributions. In total tax is 26% of gross income. Next I deduct some financial costs that are deducted from gross income to get to taxable income. There are more of these deductions actually, but some I have included in our spending.
Of the AUD 216k of net income half was spent and half saved.
The big spending items are mortgage interest, supermarkets etc, cash spending, mail order, childcare etc, and travel (flights, accomodation etc). Cash spending includes both spending actual cash and spending using our Qantas cash cards. I haven't gone into the accounts for the latter, though maybe I should. Some of the other spending categories very low compared to the actual amount spent on these because a lot of the spending is in cash. Possibly the most important of these is restaurants. Yes, there is a lot of fuzziness in these numbers because we don't budget and spend a lot in cash.
Am happy to get feedback on how we can save money, though I'm not really into "frugality" for it's own sake. Or maybe you would just like to compare the differences with other posted spending breakdowns.
P.S.
Qantas only provide online statements for the last 13 months. So, I can't now do a breakdown of those accounts for 2017-18. Maybe next year.
Friday, January 25, 2019
New Investment: Santander UK

Bought my first US corporate bond - a Santander UK bond maturing on 14 March. This supposedly gives a yield per annum of about 2.85%, which is more than treasuries of the same maturity. The original coupon on the bond is 4.2575%, so it is trading at a price of above 100. It pays quarterly interest. Fees for trading corporate bonds are higher than for treasury bonds at Interactive Brokers, but I still figured it was worth it.
Santander UK is the result of the merger of three former UK "building societies" - a bit like credit unions. It is owned by Spain's Banco Santander group but is managed separately. The maturity date is before the scheduled Brexit date on 29 March, so I figure Brexit shouldn't affect getting paid when the bond matures. The bonds are denominated in US Dollars not Sterling.
Tuesday, January 22, 2019
Interesting Paper from GMO on Bursting Stock Market Bubbles and Anti-Bubbles
Here is the paper. Yes, they think that we were in a bubble in 2017 and much of 2018 and the last quarter of 2018 was the beginning of the bursting of the bubble. The problem with the CAPE measure of valuation they use is that it is so backward-looking. If profits are growing fast, CAPE will be high because it uses the average profits of the last 10 years. It has the built-in assumption that profits growth is very strongly mean-reverting.
Monday, January 21, 2019
Likely Political and Economic Scenario for Australia
A couple of days ago I posted a list of all 12 of Labor's proposed tax increases. How likely is it that these will actually be enacted? Labor is unlikely to gain control of the Senate. So, they will need the support of minor parties and independents to push through their program. A quite likely scenario is that there will be a recession in 2020 and the minor parties will be very resistant to raising taxes in those conditions, especially on housing. Or Labor will decide to postpone some of the proposals in reaction to a recession. Then Labor is likely to not be re-elected in 3 years if unemployment is rising etc. So, at this point I would put even odds on most of this agenda being enacted.
Sunday, January 20, 2019
How Has Yale Done Since the Financial Crisis?
Just following up on Financial Independence's comment on my post linking David Svensen's 2008 lecture. How has Yale done since Svensen's lecture? It is easy to find out by checking the endowment's annual reports. Yale's financial year is from July 1st to June 30th. The graph shows Yale's total return index against the MSCI, S&P 500, and HFRI, where the others are all calculated on a July to June basis too.

Yale has performed quite well, eventually outperforming the MSCI World Index, but underperforming the S&P 500. Yale's diversification didn't help in the financial crisis. Their returns were just as negative as those of the MSCI and the S&P 500 in 2008-9. By contrast, the HFRI suffered only small losses in 2008-9. The bottom line is that Yale's returns are quite similar to an equity index.
Here is their asset allocation over the years:

Prior to 2013 they didn't report venture capital separately from buyout funds and so "Leveraged Buyouts" represents all private equity in the earlier years. Also, prior to 2009 they didn't report real estate and natural resources separately and so "natural resources" covers both. Over the years they have increased private equity and foreign stocks and reduced real estate and domestic stocks.
The Average Hedge Fund No Longer Produces Alpha
I regressed the excess (above risk free rate) monthly returns of the HFRI fund-weighted hedge fund index on the excess returns of the MSCI All Country World Index (gross returns):

Back at the turn of the century, the hedge fund index had alpha between 5 and 10%. But it collapsed going into the financial crisis and in the most recent 5 year period alpha is -0.17% p.a. Beta is 0.34. The r-squared between the MSCI and HFRI excess returns is 0.86, which is high. So, you might as well invest 34% of your money in global stocks and the rest in cash to replicate the index. Interestingly, a linear trend line rather than an exponential trend line fits the index:

So, it doesn't make sense to invest in hedge funds recently unless you can select an above average fund.
Friday, January 18, 2019
All of Labor's Tax Increases

- Abolish Liberal plan to raise the top tax threshold to $200k: This was supposed to happen in 2024. The top tax bracket will still cut in at $180k (about USD130k) where it has been for many years. Bracket creep is pushing more and more taxpayers into the top bracket. This will affect us if I am still working then. If I'm not, probably my taxable income will be lower.
- Raise the top tax rate: Add 2% to the top rate to raise it to 47%. With Medicare that is 49%. This will immediately raise our taxes.
- Abolish plan to eliminate 37% tax bracket: This also was supposed to happen in 2024, so may not affect us except to the extent of how many franking credits will get used up offsetting our taxes, if I retire by then.
- Repeal already-legislated tax cuts for companies with turnovers of between $10 million and $50 million: Small businesses pay 27.5% corporation tax and larger companies 30%. The government wanted to extend the low rate to larger companies. This is unlikely to directly affect us.
- Reduce the long-term capital gains tax discount to 25%: The discount is now 50%. This will have an immediate impact on us as we have run out of accumulated tax losses. OTOH existing investments will be grandfathered. It makes it more attractive to incorporate and pay CGT of 27.5% instead of 37.5%.
- Abolish refundability of franking credits: Since 2000, if you have excess tax credits from Australian companies beyond those that offset the taxes you need to pay you can get a cash refund. I did benefit from this once or twice soon after we moved to Australia and my income was low. This will have a big impact on superannuation funds in pension phase that have zero tax to pay and possibly even in accumulation phase if they have a lot of franked dividends. It will affect lower income self-funded retirees with money outside superannuation too. Some listed investment companies (closed end funds) are already paying out special dividends to get franking credits out of the fund and to investors before the end of the financial year. On the other hand, I don't think these funds will radically restructure due to this proposal. I don't think it will have a big impact on us as I've planned to put the least tax advantaged investments like managed futures into our planned SMSF. And I expect we would be in the 32.5% tax bracket when retired. If I retire at 60 say and start a superannuation pension we could use franking credits inside our SMSF to offset Moominmama's superannuation earnings tax liability as she is 10 years younger. And then maybe we could add Moomin to the superannuation fund :)
- Abolish negative gearing: This is the ability to deduct investment costs beyond the earnings of an investment from other income. This mainly applies to property investors who mostly lose money in Australia in the short run, hoping for a long-run capital gain. We don't negative gear so it shouldn't affect us. Wealthier property investors who also own shares or other investments will be able to offset their losses in property against dividend and other income. So, like many of the Labor measures they mainly hit lower income investors...
- Tax discretionary trusts as companies: These are trusts that have multiple beneficiaries and can alter what earnings they stream to which beneficiary on a year by year basis. Actually, they are proposing to tax trust distributions at a minimum of 30%. So, it's not like a company which pays 27.5% tax in the case of a small business and then distributes franking credits. I don't see any justification for allowing this kind of tax dodging. However, I think they should just require all trusts to be unit trusts with defined shares and everyone sharing in all income. These operate just like unlisted managed funds (mutual funds). I think most discretionary trusts will just do this if it's allowed.
- Reduce annual non-concessional superannuation contributions to $75k: This would mean it would take us more years to make all the non-concessional contributions we want to make and means I probably should already get one in this financial year.
- Reduce the threshold for 30% superannuation contributions tax to $200k: Currently the threshold is $250k. The threshold includes employer superannuation contributions, so this will definitely affect me.
- Remove the right, already legislated by the government, of
superannuants to make catch-up contributions when their super balance is
less than $500,000: I don't think this is probably a big deal. It will mean stretching contributions over more years.
- Reduce ability to take tax deductions for additional concessional superannuation contributions: People will need to have 90% of their income or more from sources other than employment to do this. I don't understand why concessional contributions for employees are limited to salary-sacrificed contributions and you can't make more concessional contributions unless you really aren't an employee. The Liberals tried to fix this anomaly.
- Limit tax free pensions to $75k per year: Currently you can transfer up to $1.6 million into an account to fund a tax free superannuation pension. At a 4% initial withdrawal rate (required rate for under 65s) that is $64k per year. At 5% (65-74 y.o.) it is $80k per year. So, Labor's proposal is not that restrictive. However, if the $1.6 million earns a lot more than that a year, it will be taxed a lot more than at present.
- Limit deductions for tax advice to $3,000 per year: I am assuming that this won't apply to companies or superannuation funds, just to individuals. In which case, it isn't a big deal.
Thursday, January 17, 2019
David Svensen Lecture at Yale
Svensen is the manager of Yale's endowment. He also gives occasional lectures at Yale.

My investment strategy is strongly influenced by endowment investors like Svensen.

My investment strategy is strongly influenced by endowment investors like Svensen.
Wednesday, January 16, 2019
Moomin Needs a Tax File Number
That's what the bank in Falafelland says... So, I will look today at applying for one for him. I think they should just give them out when you apply for a birth certificate. I don't know if the bank wants it because they just want a permanent ID for him or because it will affect the tax he pays as a foreign beneficiary of a local trust account. Up till now we have been using his passport number as an ID number. But passport numbers aren't permanent. You get assigned a new one every time you renew your passport, which is every 5 years for children.
Saturday, January 12, 2019
Portfolio Charts
Portfolio Charts is a really interesting website where you can do simulations of safe and permanent withdrawal rates and many other things for a range of investment portfolios. These include predefined portfolios and you can also build your own portfolio using a range of ETFs. Here for example is Tony Robbins' version of Ray Dalio's All Weather portfolio:

The orange line gives the withdrawal rate which means that you wouldn't have run out of money if you retired in any year since 1970 and retired for the length of time on the x-axis. The green line is the withdrawal rate that means that you will have at least as much money as you started with in real terms. It's interesting how these go in opposite directions as the length of retirement increases. If you retired for 30 years the permanent withdrawal rate is 3.8%. This portfolio had an average real return of 5.5%. The best performing portfolio in terms of withdrawal rates is the site creator's own "Golden Butterfly" which has 40% stocks, 40% bonds, and 20% gold:

This portfolio had a real return of 6.5%.
An interesting point is that safe and permanent withdrawal rates vary a lot by country. The site allows you to choose the US, UK, Canada, and Germany as home countries. The linked article also includes Australia, but unfortunately the site itself doesn't allow you to do analysis for Australia. A big caveat is, of course, that all this depends on historical returns. If bonds, for example, don't do as well going forward as they did from 1980 till recently then, withdrawal rates are going to be lower. Choice of alternative investments is also limited to gold, a commodities ETF, and a REIT ETF.
Annual Report 2018
Investment Returns
In Australian Dollar terms we gained 2.3% for the year while the MSCI gained 0.9% and the ASX200 lost 1.1% (all pre-tax including dividends). In USD terms we lost 7.7%, while the MSCI lost 8.9% and the S&P500 lost 4.4%. So we beat Australian and international markets but not the US market. In the longer term perspective, our returns and market returns were closely aligned this year:

Here are returns over various standard periods (not annualized):

We have done well compared to the ASX 200 over the last 5 years. Not as great over 10 years. In USD terms we have done well compared to the MSCI over the last three years and underperformed over longer time periods.
Investment Allocation
The main change in allocation over the year is the large increase in cash and real estate when we received the inheritance:
 I also reduced my allocation to Australian large cap stocks around the same time, in early October. Earlier in the year, the allocation to cash falls as we increased trading and invested more in the Winton Global Alpha Fund (commodities) and subscribed to some IPOs. Private equity also increased with investment in Aura and IPE and then decreased with the takeover of IPE.
Accounts
I stopped reporting monthly accounts this year, but I've still been computing them. Here are our annual accounts in Australian Dollars without including the inheritance:
We earned $170k after tax in salary, business related refunds, medical payment refunds, tax refunds etc. We earned (pre-tax including unrealised capital gains) $35k on non-retirement account investments. Both of those numbers were down strongly from last year. I stepped down from an admin role that paid extra salary and earned less in consulting etc. The investment numbers would have been worse without trading and the fall in the Australian Dollar ($31k in "forex" gain). Total current after tax income was $204k. Not including mortgage interest we spent $117k – Total actual spending including mortgage interest was $133k.
$9k of the current pre-tax investment income was tax credits – we don't actually get that money so we need to deduct it. Finally, we transferred $45k in mortgage payments (and virtual saved interest) to the housing account. The change in current net worth, was therefore $34k. Looking at just saving from non-investment income, we saved $8k. Both these numbers are down steeply from last year.
The retirement account is a bit simpler. We made $38k in contributions (after the 15% contribution tax) and the value fell by an estimated $23k in pre tax returns. $4k in "tax credits" is an adjustment needed to get from the number I calculate as a pre-tax return to the after tax number. Taxe on returns are just estimated because all we get to see is the after tax returns. I do this exercise to make retirement and non-retirement returns comparable. Net worth of retirement accounts increased by $19k.
Finally, the housing account. We spent $16k on mortgage interest. We would have paid $24k in mortgage interest if we didn't have an offset account. I estimate our house is worth $24k more than I did last year based on recent sales in our neighbourhood. After counting the transfer of $45k into the housing account housing equity increased $46k of which $23k was due to paying off principal on our mortgage.
Total net worth increased by $99k, $69k of which was saving from non-investment sources. Comparing 2018's accounts with 2017's, we saved 49% less and net worth increased by 79% less. Total after tax income was almost $230k, down 60% on last year. This number feels a lot more "reasonable" than last year.
Though our saving is down sharply on last year, we still saved in total 33% of our after tax non-investment income. Of course, this is less than last year's 50%. Including investment income our savings rate was 43%.
Here are the same accounts expressed in US Dollars:

How Does This Compare to My Projection for This Year?
At the beginning of the year, I projected a gain in net worth of $250k based on an 8% return on investments and a 6% increase in spending. As you can see, spending rose 25% and return on investments was only 2%. As a result net worth increased by only $99k.
Looking to 2019, I think we will be lucky if our investment return is 0%, as I am quite bearish about the world economy and stockmarket. If I pencil in a 6% rise in spending, then we would only increase net worth by $60k.
In Australian Dollar terms we gained 2.3% for the year while the MSCI gained 0.9% and the ASX200 lost 1.1% (all pre-tax including dividends). In USD terms we lost 7.7%, while the MSCI lost 8.9% and the S&P500 lost 4.4%. So we beat Australian and international markets but not the US market. In the longer term perspective, our returns and market returns were closely aligned this year:

Australian Dollar Returns
Here are returns over various standard periods (not annualized):

We have done well compared to the ASX 200 over the last 5 years. Not as great over 10 years. In USD terms we have done well compared to the MSCI over the last three years and underperformed over longer time periods.
Investment Allocation
The main change in allocation over the year is the large increase in cash and real estate when we received the inheritance:

Accounts
I stopped reporting monthly accounts this year, but I've still been computing them. Here are our annual accounts in Australian Dollars without including the inheritance:

Annual Accounts
There are lots of quirks in the way I compute the accounts, which have gradually evolved over time. Here is an explanation:
Current account is all
non-retirement accounts and housing account income and spending. Then
the other two are fairly self-explanatory. But housing spending only
includes mortgage interest. Property taxes etc. are included in the
current account. There is not a lot of logic to this except the
"transfer to housing" is measured using the transfer from our checking
account to our mortgage account. Current other income is reported after
tax, while investment income is reported pre-tax. Net tax on investment
income then gets subtracted from current income as our annual tax refund
or extra payment gets included there. Retirement investment income gets
reported pre-tax too while retirement contributions are after tax. For
retirement accounts, "tax credits" is the imputed tax on investment
earnings which is used to compute pre-tax earnings from the actual
received amounts. For non-retirement accounts, "tax credits" are actual franking credits
received on Australian dividends and the tax withheld on foreign
investment income. Both of these are included in the pre-tax earning but
are not actually received month to month as cash.... Finally, "core
expenditure" for housing is the actual mortgage interest we paid.
"Expenditure" adds back how much interest we saved by keeping money in
our offset account.
We include that saved interest in the current account as the earnings
of that pile of cash. That virtual earning needs to be spent somewhere
to balance the accounts... It is also included in the "transfer to
housing". Our actual mortgage payments were less than the number
reported by the $6k in saved interest. For current accounts "core
expenditure" takes out business expenses that will be refunded by our
employers and some one-off expenditures. This year, I think there are
none of those one-off expenditures. "Saving" is the difference
between "other income" net of transfers to other columns and spending in
that column, while "change in net worth" also includes the investment
income.
We earned $170k after tax in salary, business related refunds, medical payment refunds, tax refunds etc. We earned (pre-tax including unrealised capital gains) $35k on non-retirement account investments. Both of those numbers were down strongly from last year. I stepped down from an admin role that paid extra salary and earned less in consulting etc. The investment numbers would have been worse without trading and the fall in the Australian Dollar ($31k in "forex" gain). Total current after tax income was $204k. Not including mortgage interest we spent $117k – Total actual spending including mortgage interest was $133k.
$9k of the current pre-tax investment income was tax credits – we don't actually get that money so we need to deduct it. Finally, we transferred $45k in mortgage payments (and virtual saved interest) to the housing account. The change in current net worth, was therefore $34k. Looking at just saving from non-investment income, we saved $8k. Both these numbers are down steeply from last year.
The retirement account is a bit simpler. We made $38k in contributions (after the 15% contribution tax) and the value fell by an estimated $23k in pre tax returns. $4k in "tax credits" is an adjustment needed to get from the number I calculate as a pre-tax return to the after tax number. Taxe on returns are just estimated because all we get to see is the after tax returns. I do this exercise to make retirement and non-retirement returns comparable. Net worth of retirement accounts increased by $19k.
Finally, the housing account. We spent $16k on mortgage interest. We would have paid $24k in mortgage interest if we didn't have an offset account. I estimate our house is worth $24k more than I did last year based on recent sales in our neighbourhood. After counting the transfer of $45k into the housing account housing equity increased $46k of which $23k was due to paying off principal on our mortgage.
Total net worth increased by $99k, $69k of which was saving from non-investment sources. Comparing 2018's accounts with 2017's, we saved 49% less and net worth increased by 79% less. Total after tax income was almost $230k, down 60% on last year. This number feels a lot more "reasonable" than last year.
Though our saving is down sharply on last year, we still saved in total 33% of our after tax non-investment income. Of course, this is less than last year's 50%. Including investment income our savings rate was 43%.
Here are the same accounts expressed in US Dollars:

How Does This Compare to My Projection for This Year?
At the beginning of the year, I projected a gain in net worth of $250k based on an 8% return on investments and a 6% increase in spending. As you can see, spending rose 25% and return on investments was only 2%. As a result net worth increased by only $99k.
Looking to 2019, I think we will be lucky if our investment return is 0%, as I am quite bearish about the world economy and stockmarket. If I pencil in a 6% rise in spending, then we would only increase net worth by $60k.
New Investment: U.S. Treasury Bills
Interactive Brokers currently pays 1.7% interest on U.S. Dollars. But U.S. government bonds pay more than that and are supposedly risk free, so I thought I would give it a try. I am concerned that U.S. interest rates could still rise and so I don't want longer term bonds. So, I just bought a U.S. Treasury Bill expiring on 12 February. My idea is when that matures, I'll put part of the proceeds towards buying Australian Dollars. I plan to build a ladder of these and so force myself to buy Australian Dollars slowly.
At IB the commission for buying bonds is $5 and it turns out that the minimum trade size for treasuries is $100k. This isn't stated anywhere, but when I tried buying $50k last week, I got a message that my trade size was too small, whereas this trade went through. I'm gradually moving U.S. Dollars to my IB account - I can move up to $100k every 7 business days using the ACH method.
I've thought about municipal and corporate bonds too, but these can be illiquid. For example, for the nearest term Berkshire Hathaway bond, only $1000 is currently being offered.
At IB the commission for buying bonds is $5 and it turns out that the minimum trade size for treasuries is $100k. This isn't stated anywhere, but when I tried buying $50k last week, I got a message that my trade size was too small, whereas this trade went through. I'm gradually moving U.S. Dollars to my IB account - I can move up to $100k every 7 business days using the ACH method.

I've thought about municipal and corporate bonds too, but these can be illiquid. For example, for the nearest term Berkshire Hathaway bond, only $1000 is currently being offered.
Subscribe to:
Posts (Atom)