Saturday, March 06, 2021

Hedge Funds Outperform Again in February

HEDGE FUNDS SURGE IN FEBRUARY AS INTEREST RATES RISE

HFRI Equity Hedge leads broad-based gains as retail trading trend expands;
Macro, CTA strategies advance on rates, commodities;
Crypto, Activist, Technology, Energy sub-strategies also lead

CHICAGO, (March 5, 2021) – Hedge funds surged in February to extend January gains as interest rates, commodity prices, and expectations for the reemergence of inflation all increased. The HFRI Fund Weighted Composite Index® (FWC) gained +4.1 percent in February, while the investable HFRI 500 Fund Weighted Composite Index advanced +3.2 percent, according to data released today by HFR®, the established global leader in the indexation, analysis and research of the global hedge fund industry.

Consistent with the previous month, the HFRI FWC experienced a wide dispersion in constituent performance, as the top decile of the HFRI gained +16.3 percent, while the bottom decile declined -3.1 percent for the month. As reported previously by HFR, total hedge fund capital jumped to $3.6 trillion to begin 2021, a 4Q20 increase of $290 billion, representing the largest quarterly asset growth in industry history. Estimated 4Q20 net asset inflows totaled $3.0 billion, bringing total inflows for the second half of 2020 to an estimated $16.0 billion.

Equity Hedge strategies, which invest long and short across specialized sub-strategies, led February performance as the influence of retail investors increased trading volumes and investors expanded their focus to a wider range of individual equities. The HFRI Equity Hedge (Total) Index surged +4.8 percent for the month, with strong contributions from a wide dispersion of sub-strategy performance led by the high-beta, long-biased Energy, Fundamental Value, and Technology exposures. Following strong January gains, the HFRI EH: Energy/Basic Materials Index surged +9.7 percent in February, while the HFRI EH: Fundamental Value Index spiked +6.4 percent and the HFRI EH: Sector-Technology Index added +4.4 percent.

Event-Driven strategies, which often focus on out of favor, deep value equity strategies and situations, accelerated January gains into February, with the investable HFRI 500 Event-Driven Index surging +2.8 percent for the month, while the HFRI Event-Driven (Total) Index gained +3.6 percent. ED sub-strategy gains were led by Activist, Special Situations, and Credit Arbitrage exposures, strategies which categorically trade in deep value equity situations, including companies which are possible targets for restructuring, acquisitions or investor-driven strategy shifts. The HFRI ED: Activist Index surged +8.3 percent in February, while the HFRI ED: Special Situations Index advanced +4.1 percent, and the HFRI ED: Credit Arbitrage Index added +2.7 percent.

Uncorrelated Macro strategies also posted a strong gain in February, driven by trend-following CTAs and fundamental Commodity-focused strategies. The HFRI Macro (Total) Index jumped +3.6 percent, while the investable HFRI 500 Macro Index spiked +3.7 percent. Driven by strong trends in interest rates, Macro sub-strategy performance was led by the HFRI Macro: Systematic Diversified/CTA Index, which gained +4.4 percent for the month, and the HFRI Macro: Commodity Index, which added +4.1 percent.

The fixed income-based, interest rate-sensitive HFRI Relative Value (Total) Index gained +2.3 percent in February, while the HFRI 500 Relative Value Index advanced +1.5 percent for the month, led by the investable HFRI 500 RV: Volatility Index, which jumped +3.0 percent, and the HFRI 500 RV: Fixed Income-Convertible Arbitrage Index, which advanced +2.4 percent. Extending the January surge, Blockchain and Cryptocurrency exposures continued to deliver strong performance as cryptocurrencies reached record highs and as hedge funds increasingly incorporated related exposures into new and existing fund strategies. The HFR Blockchain Composite Index and HFR Cryptocurrency Index each surged nearly +30.0 percent in February.

Risk Premia and Liquid Alternatives also gained in February, led by multi-asset and commodity exposures. The HFR Bank Systematic Risk Premia Multi-Asset Index advanced +7.9 percent for the month, while the HFR BSRP Commodity Index gained +3.3 percent. The HFRI-I Liquid Alternative UCITS Index advanced +1.05 percent in February, driven by a +1.8 percent gain in the HFRI-I UCITS Event Driven Index.

"Recent hedge fund gains accelerated through February, marking the strongest 4-month period in over 20 years as the drivers of performance widened to include not only Event Driven and Equity Hedge, but also captured strong positive contributions from trend-following Macro and interest rate-sensitive Relative Value Arbitrage strategies", stated Kenneth J. Heinz, President of HFR. "New stimulus measures, increasing vaccinations, and uncertainty with regards to immigration and energy policy have shifted macroeconomic and geopolitical volatility to include not only the single stock or asset trends from concentrated, increased retail trading but also cryptocurrency trading, energy exposure and interest rate/inflation sensitivity. Institutional investors are likely to continue expanding allocations to leading hedge fund managers as a mechanism to gain specialized exposure to these and other powerful trends through mid-2021".

Tuesday, March 02, 2021

February 2021 Report

The month ended quite turbulently, but stock markets were still up for the month. The Australian Dollar rose from USD 0.7663 to USD 0.7737. The MSCI World Index rose 2.35%, the S&P 500 by 2.76%, and the ASX 200 rose 1.65%. All these are total returns including dividends. We gained 1.65% in Australian Dollar terms or 2.68% in US Dollar terms. The target portfolio is expected to have gained only 0.23% in Australian Dollar terms and the HFRI hedge fund index is expected to gain 1.05% in US Dollar terms. So, we outperformed or matched all our benchmarks. The S&P 500 isn't a benchmark.

Here is a report on the performance of investments by asset class (currency neutral terms): 
 
Hedge funds added the most to performance and gold detracted the most. Things that worked well this month:
  • Tribeca Global Resources (TGF.AX), Regal Funds (RF1.AX), and Hearts and Minds (HM1.AX) were the top three performers gaining AUD 20k, 18k, and 11k, respectively. In other notable gains, we gained AUD 5k in Treasury Wine (now a 2% of net worth position) and Winton Global Alpha gained for a change, up AUD 3k.
What really didn't work:
  • Gold was the worst performer, giving back AUD 30k of gains.
The investment performance statistics for the last five years are:
The first two rows are our unadjusted performance numbers in US and Australian Dollar terms. The following four lines compare performance against each of the three indices. We have the desired asymmetric capture for all three indices now and positive alpha compared to all of them.

We moved further towards our long-run asset allocation. Real assets (real estate and art) are the asset class that is furthest from their target allocation (7.2% of total assets too little) followed by bonds (2.9% too much):


On a regular basis, we invest AUD 2k monthly in a set of managed funds, and there are also retirement contributions. Other moves this month:

  • I sold my USD 25k of Virgin Australia bonds for 8.125 cents on the dollar. With Australian borders closed longer than we would have expected at the beginning of the year, I guess the company's financial situation will be worse than they expected when they told us we would likely get 9 cents.
  • Prospect Capital called its baby bonds (PBB) early, resulting in another USD 25k reduction in our bond exposure.
  • I started systematically daytrading ASX200 CFDs and futures....  I made a little money, just under AUD 600. I also started trading soybean futures using my version of the turtle model. This system doesn't trade that often. It made one trade which was stopped out for a loss.
  • Two days before the earnings release, I sold 2000 of our Treasury Wine shares (TWE.AX) as I was anticipating some turbulence. The next day the price fell sharply and I bought them back almost a dollar lower. By the end of the day the price recovered. On the earnings day not much happened. Then the day after earnings the stock price rose 17% on a broker upgrade and a positive article in the Fin Review. After that there was more turbulence and I adjusted the positions a little
  • I invested USD 10k in another painting at Masterworks. I now have USD 60k invested in 6 paintings.

Sunday, February 21, 2021

Trading Update

I've now been trading the ASX200 systematically, mostly on Plus500, for two weeks. I'm only ahead by about AUD 500, but that's not surprising. Actually, it's a good result given the small position size so far, and the potential for drawdowns. I've done more backtesting and improved the algorithm. About half of total returns would come from holding winning positions (during the day) overnight and I haven't done that yet. I also updated my soybean trading model with the last year or so of data and the algorithm I was using would continue to be profitable, so I am adding that. By contrast with the ASX200 model, this is a trend following model that doesn't trade very often. Finally, during the past week I did some trading of Treasury Wine around the high volatility in the stock with the earnings release and broker upgrades and downgrades. This involved far larger fluctuations in value than the systematic trading.

Sunday, February 14, 2021

Tweaking the Target Portfolio

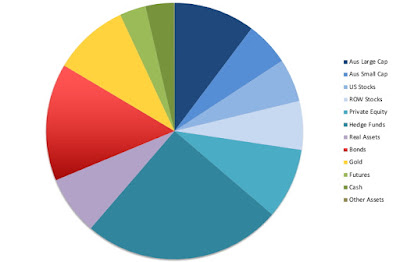
I've decided to slightly tweak the target portfolio weights to reflect a larger allocation to hedge funds. The top level allocation is 59% to equity and 41% to everything else. Then there is 10% to private equity (split between venture and buyout) and 49% to public equity. Within that 25% to long-only and 24% to hedge funds (was 21.5%) (also split 50/50 to Australian focused and foreign focused funds). And within the long-only 13% to Australia and 12% to the rest of the world. Within Australian 9% to large cap and 4% to small cap and within foreign 5% to the US and 7% to other countries. Within the "everything else category", 10% to gold, 10% to bonds, 10% to real estate, 5% to art, 5% to futures, and 1% to cash and everything else. So:

9% Australian large cap

4% Australian small cap

5% US stocks

7% ROW stocks

12% Australian focused hedge funds

12% Foreign focused hedge funds

5% Venture capital

5% Buyout PE

10% Gold

10% Real estate etc.

10% Bonds

5% Art

5% Futures

1% Cash etc.

Overall the whole portfolio is levered by about 20% (assets are 120% of equity). This 20% is roughly the value of our house, which isn't included in the above. We also try to maintain a 50:50 allocation to Australian Dollar exposure vs. foreign currency exposure. My job is mainly to choose funds and a couple of stocks and do a little trading in part of the futures allocation.

We are still overweight hedge funds after this change.


Sunday, February 07, 2021

Plus500 Update

I got a statement from the new HSBC account and submitted it to Plus500 and it was approved! So, now I tried to withdraw $1,000. They at least allowed me to submit the request now. However, there was a statement that they will refund the original source of the money.... Which would mean they will send it back to the credit card we used to fund the account, even though that is a joint account. Let's see what happens. 

P.S. 8 February 

The money showed up in the new HSBC account! So we successfully withdrew money from Plus 500.

Saturday, February 06, 2021

Hedge Funds Gained 0.92% in January

 HEDGE FUNDS GAIN IN JANUARY, NAVIGATING VOLATILITY

HFRI Event Driven, RVA & Crypto lead strategy performance;
Deep value Special Situations, Merger Arbitrage, Credit lead sub-strategies

CHICAGO, (February 5, 2021) – Hedge funds advanced in January to begin 2021, actively trading through a turbulent month dominated by a volatile surge in trading from retail investors concentrated in a handful of deep value equities with significant short interest. The HFRI Fund Weighted Composite Index® (FWC) gained +0.9 percent in January, while the investable HFRI 500 Fund Weighted Composite Index advanced +0.35 percent, according to data released today by HFR®, the established global leader in the indexation, analysis and research of the global hedge fund industry.

Reflecting the powerful trading trends, the HFRI FWC experienced a wide dispersion in constituent performance, as the top decile of the HFRI gained +11.6 percent, while the bottom decile declined -7.8 percent for the month. As reported previously by HFR, total hedge fund capital jumped to $3.6 trillion to begin 2021, a 4Q20 increase of $290 billion, representing the largest asset growth in industry history. Estimated 4Q20 net asset inflows totaled $3.0 billion, bringing total inflows for the second half of 2020 to $16.0 billion.

Event-Driven strategies, which often focus on out of favor, deep value equity strategies and situations, led strategy performance in January, with the investable HFRI 500 Event-Driven Index surging +3.0 percent for the month, while the HFRI Event-Driven (Total) Index gained +2.8 percent. ED sub-strategy gains were led by Merger Arbitrage, Special Situations, and Distressed exposures, strategies which categorically trade in deep value equity situations, including companies which are possible targets for restructuring, acquisitions or investor-driven strategy shifts. Following strong performance in 4Q20, the HFRI ED: Merger Arbitrage Index surged +4.0 percent in January, the HFRI ED: Special Situations Index advanced +3.8 percent, and the HFRI ED: Distressed Index added +2.6 percent. The investable HFRI 500 ED: Special Situations Index jumped +6.2 percent for the month, and the HFRI 500 ED: Merger Arbitrage Index advanced +5.1 percent.

The fixed income-based HFRI Relative Value (Total) Index gained +1.3 percent in January, while the HFRI 500 Relative Value Index advanced +1.2 percent for the month, led by the investable HFRI 500 RV: Fixed Income-Convertible Arbitrage Index, which jumped +3.5 percent, and the HFRI RV: Yield Alternatives Index, which added +4.0 percent.

Following the 2020 surge, Blockchain and Cryptocurrency exposures continued to deliver strong performance as cryptocurrencies hit record highs and as hedge funds increasingly incorporated related exposures into new and existing fund strategies. The HFR Blockchain Composite Index and HFR Cryptocurrency Index each surged over +48.0 percent in January.

Through intense stock volatility, the HFRI Equity Hedge (Total) Index advanced +0.8 percent for the month. Equity Hedge funds experienced a wide dispersion of sub-strategy performance led by the high beta, long-biased Energy and Fundamental Growth exposures. Following strong 4Q20 gains, the HFRI EH: Energy/Basic Materials Index surged +4.8 percent in January, while the HFRI EH: Fundamental Growth Index added +2.3 percent. Partially paring these gains, the HFRI EH: Sector-Technology Index declined -1.1 percent, and the HFRI EH: Multi-Strategy Index fell -0.8 percent for the month.

Risk Premia, Risk Parity and Liquid Alternatives produced mixed performance in January, led by equity and commodity exposures. The HFR Bank Systematic Risk Premia Equity Index advanced +2.2 percent for the month, while the HFR BSRP Commodity Index gained +1.6 percent. The HFR Risk Parity Vol 12 Institutional Index fell -0.2 percent in January, while the HFRI-I Liquid Alternative UCITS Index posted a narrow loss of -0.14 percent for the month, driven by the -0.3 percent decline in the HFRI-I UCITS Macro Index.

Uncorrelated Macro strategies posted a narrow gain in January, with the HFRI Macro (Total) Index advancing +0.2 percent, while the HFRI 500 Macro Index added +0.1 percent. Macro sub-strategy performance was led by the HFRI Macro: Discretionary Thematic Index, which gained +1.8 percent for the month, and the HFRI Macro: Multi-Strategy Index, which added +1.1 percent.

"Hedge funds effectively navigated the idiosyncratic stock trading volatility which focused on deep value equities with high short interest, with this trend driving gains across Event Driven strategies which categorically focus on inexpensive, out of favor equities that are experiencing fundamental, structural transition in the underlying businesses. While certain sub-strategies declined in January, as is evidenced by the wide dispersion in performance, as a direct result of the size, breadth and diverse nature of hedge fund strategies, overall industry performance was positive for the month," stated Kenneth J. Heinz, President of HFR. "While significant financial market attention has been focused on a handful of funds and small number of equities impacted by these recent trading trends, the overall hedge fund industry is comprised of over 9,100 funds managing nearly $3.6 trillion across a highly diverse range of strategies, which include significant capital exposure to out of favor, deep value equities. With an emphasis also on opportunistic positioning and sustained capital appreciation achieved through specialized long-short portfolio management, leading institutions are likely to continue expanding allocations to hedge funds as a tool for achieving their long-term portfolio objectives."

Finished First Week of Trading

I traded each day according to the rules and had 3 wins and 2 losses and ended up AUD 219 for the week. If that is a typical week then I would need to trade ten times bigger to make a decent "wage" from this. That would be 4 full futures contracts (AUD 670k notional value). But that would expose the account to a possible daily loss of AUD 50k during a market crisis like the March crash last year. I would feel that is just too much for even a AUD 1 million SMSF, though for our full portfolio it is reasonable theoretically. So, we would need to use a constant risk strategy to reduce the risk to AUD 10k every day. That also feels like a big risk in trading if it is a daily thing. So, I doubt we get up to that size of trading any time soon. 

If this is a successful strategy I will likely pursue trying to build an automated system later this year. I previously explored Capitalise, but found they couldn't implement a system like this with variable position size based on risk. So, unless they have improved it'd probably mean learning Python, but that isn't a bad thing...

Wednesday, February 03, 2021

Why a Constant Risk Trading Strategy Works

A constant risk trading strategy in the day-trading context is where your maximum loss possible is a constant. There are other definitions in trend-following etc contexts where you choose a position size so that the typical or expected daily movement up or down is a constant over time and markets.

Using the first definition, once you choose a stop loss, you compute the loss per contract or share if the stop was triggered and divide the fixed maximum loss figure by that to find out how many contracts or shares to buy. For example, if you are willing to risk $2000 on a trade and a contract will lose $1000 in the worst case, you buy (or sell) two contracts. 

The reason this works is the maximum downside loss is capped but by trading more contracts when possible the upside is increased. This helps create asymmetry. 

This graph shows possible loss on the x-axis and trading results (in backtest) on the y-axis, when trading one SPI contract over the last 13 months:

And this is what happens to the returns when the maximum loss is set at the average $2,300 (yes the stop loss can occasionally be exceeded when the opening price of the day is above the entry stop):


This has a lower information ratio (similar to Sharpe ratio but without deducting the risk free rate) than the one contract strategy though. It misses out on really big gains when volatility is high. But if you combine the two and set a minimum maximum loss at $2,300 you get better results than either strategy alone. Below $2,300 potential loss you trade a variable number of contracts and above it one contract only:

This has a higher information ratio than either simple strategy but it does take on a lot more risk at times than the constant risk strategy, which for a small account trading full size futures contracts could mean just not trading when volatility is high.


Tuesday, February 02, 2021

2nd Day of Trading

Today's trade was a winner, recovering a bit more than half of yesterday's loss. This is going to need a lot more research. Especially around the relationship between volatility and returns. I suspect that it's not worth trading when volatility is low and maybe there is an upside limit to how much volatility to tolerate. Now I have 13 months of data (from Barchart) nicely organized. Just need to merge all the spreadsheets together and test hypotheses.

Monday, February 01, 2021

Trading Once Again

Just over a year ago, I decided to stop systematic trading. This wasn't the first time. The problem with my trading systems was that they were overfitted to the data. They worked well for a while but then didn't. I did try one similar approach that is not tuned to the data. Yes, I said that this wasn't for me. But then over this weekend, I thought: "Maybe it is?" :) So, I downloaded a bunch more data and did backtests. It would have done especially well during the COVID-19 crash and OK in other months in the last year. So, I decided to try it today again. I used the Plus500 account, which I had decided to shutdown but hadn't managed to do yet. At least this allowed me to trade a smaller position - only AUD 10 per SPI point. The full size futures contract is AUD 25 per point. Well, I was stopped out for a AUD 960 loss... In the backtesting, getting stopped out is fairly unusual. Initially, the market fell and the short trade was profitable. Then it reversed and had a steep rally. 


Most losing trades have to be manually closed at the end of the day. So bad luck on my first trade. I'll try a few more and see how I go...

Thursday, January 28, 2021

Treasury Wine Estates Rises Sharply on No News

Treasury (TWE.AX) rose sharply today with no announcement from the company or news in the media. At one point it was up 9%. This was on a day when the market was sharply down. It closed up 5.92%. I added to my position on the basis that my thesis was working out and that this spike would be continued.


Monday, January 25, 2021

Incentives for Charitable Giving in Australia

As there is no estate or inheritance tax in Australia, I think it makes much more sense to give money to charity while you are alive rather than in your will. If I give money in my will, my children will have less but no tax benefit from giving money. If I give while I am alive then I can claim a tax deduction. Or am I wrong?

P.S. 6 February

I thought of an alternative approach. You can write in your will that your children need to make contributions to charity from the money they receive. That way they can take tax deductions instead. The advantage of this is that if you are unsure if you will run out of money in retirement you can direct your children to make donations if you didn't run out of money. The downside is that they may not follow your directions. Maybe there is some trust structure that enforces this. Also, you don't get to see the benefits of your donations.

Saturday, January 23, 2021

Started SMSF Process

I made it my new year resolution to finally set up an SMSF. This is the next step in our financial restructuring process. The final step will be estate planning. The idea is to put relatively high tax investments into the SMSF. Also, we will put direct holdings of US stocks into the fund, so that they aren't part of our estate. Yes, there is a tax treaty between Australia and the US, which would mean that we wouldn't pay any tax at the moment. But it is likely that the threshold for inheritance tax in the US will be reduced under the Democrats and there is still paperwork to do.

I have now started the process with SuperGuardian who seem to provide a lot of service with a lot of flexibility and have very good recommendations. All I've done so far is send in the client engagement form. The decisions I made so far are to use a corporate trustee and to use a Macquarie CMA as the fund's bank account. Apparently, one third of SMSFs use a Macquarie CMA and SuperGuardian's representative said a lot of their clients do too. A corporate trustee is a little more complicated and expensive in the short run, but seems more sensible in the long run. An SMSF with only individual trustees must have at least two trustees, while the corporate trustee can have a single director. As I am 11 years older than Moominmama, it's likely that she will end up being the only trustee/director unless we bring our children into the fund, or she involves at outside person as an additional trustee. She would also have to deal with all that and she currently isn't at all interested in any of this financial stuff.

Thursday, January 21, 2021

January 2021 Report

The rallies in the Australian Dollar and the stock markets continued this month. The Australian Dollar fell from USD 0.7725 to USD 0.7663. The MSCI World Index fell 0.43% and the S&P 500 by 1.01%, but the ASX 200 rose 0.93%. All these are total returns including dividends. We gained 0.59% in Australian Dollar terms or -0.22% in US Dollar terms. The target portfolio is expected to have lost 0.09% in Australian Dollar terms and the HFRI hedge fund index is expected to lose 0.24% in US Dollar terms. So, we outperformed all benchmarks apart from the ASX 200.

Here is a report on the performance of investments by asset class (currency neutral terms): 


Hedge funds added the most to performance and gold detracted the most. Things that worked well this month:
  • Tribeca was the best performer in dollar terms. Treasury Wine was maybe the best in percentage terms.
What really didn't work:
  • Pershing Square Holdings was the worst performer, giving back AUD 11k of gains. Gold was second worst, losing AUD 9k.
The investment performance statistics for the last five years are:
 

The first two rows are our unadjusted performance numbers in US and Australian Dollar terms. The following four lines compare performance against each of the three indices. We have the desired asymmetric capture for all three indices now and positive alpha compared to all of them. 
 
We moved further towards our long-run asset allocation. Real assets (real estate and art) are the asset class that is furthest from their target allocation (7.4% of total assets too little) followed by hedge funds (3.6% too much): 
 
 
On a regular basis, we invest AUD 2k monthly in a set of managed funds, and there are also retirement contributions. Other moves this month:
  • I invested USD 10k in another painting with Masterworks.
  • USD 50k of HSBC bonds matured.
  • The remaining USD 3.75k of General Finance baby bonds were called.
  • I sold 2000 shares of the Boulder Income Fund (BIF) closing our position and buying 100 shares of Berkshire Hathaway (BRK/B) instead. 
  • I also closed our position in Pendal Property Securities and switched the funds to Generation Global. Both are funds offered by Colonial First State.
  • To then rebalance a bit towards real estate I bought 50,000 shares of URF.AX.
  • As part of a long term plan to not hold US stocks directly, I reorganized my holdings in my Interactive Brokers and CommSec brokerage accounts. In the end, the CommSec account ended up holding gold (PMGOLD), unlisted funds from Colonial First State and Macquarie, and small positions in each of our listed Australian funds. The latter are so we get the correct tax information from the share registries as IB isn't strong on this. My main holdings of these funds are now at IB, which has a much lower borrowing rate. IB has all my other stock positions in Australian, UK, and US markets. The latter will eventually move to the new SMSF. There are also some bond positions there which we will hold to maturity.

Wednesday, January 20, 2021

Berkshire Hathaway


I sold 2000 shares of the Boulder Income Fund (BIF) closing our position and bought 100 shares of Berkshire Hathaway (BRK/B) instead. Berkshire is BIF's largest holding and seems to recently be outperforming BIF. Additionally, it doesn't pay dividends and so is more tax effective. Berkshire has a relatively low valuation by several metrics compared to the US stock market in general. I think the company could become much more valuable after Buffett steps down as CEO as I expect the future managers will break it up. The position is quite small (less than 1%) as our whole target US stock allocation is only 5% of net worth.

I have held Berkshire in the past, a long time ago.

Saturday, January 09, 2021

Hedge Funds Beat the S&P 500 in December

It's rare to see hedge funds beating the major stock indices to the upside these days, but that's what happened in December when the HFRI returned 4.47% and the S&P 500 3.84%. The MSCI World Index gained 4.68%. As a result our target portfolio actually returned 6.13% in US Dollar terms, though we still beat it, gaining 7.21%. In Australian Dollar terms it gained 1.26% rather than just breaking even as I reported a few days ago.

Contributions of Individual Investments 2020


As promised, here are the contributions of each of 62 investments to our annual investment return. Of course, these numbers (in Australian Dollars) depend on the size of each investment and I don't make any attempt to work out or compile the annual rate of return on all these investments (I do compute it for some). 

Compared to last year, gold again is a top contributor and Hearts and Minds and Pershing Square Holdings are gain near the top. Cadence Capital had a turn around this year for the positive and Platinum Capital for the negative. The large super funds did OK but last year they were the two top contributors.

There were two big disasters this year. Winton Global ALpha had a terrible performance losing 18% and Virgin Australia bonds were almost totally wiped out in the airline's bankruptcy.

The total number of investments was smaller this year as we gradually ran off our individual bond holdings and traded much less.


Tuesday, January 05, 2021

Annual Report 2020

Overview 
The main financial themes of this year for us was continuing to invest the money we inherited in late 2018 and surprisingly strong investment returns for the year after the sharp fall in markets in March due to the COVID-19 pandemic. In my academic career I was also surprisingly productive in the second half of the year following the struggle of dealing with closed schools and our move to online teaching in the first half of the year. We spent less for the year overall because of a reduction in spending during the lockdown and no travel. Our house fell in value, which was against the trend in the Australian housing market.

 
All $ signs in this report indicate Australian Dollars. As I did last year, I'll do a separate report on individual investments.

Investment Returns 
In Australian Dollar terms we gained 11.9% for the year and in USD terms we gained 23.2% because the Australian Dollar gained 10%. The MSCI gained 16.8%  in USD terms and the ASX 200 only 2.6% in AUD terms. The HFRI hedge fund index gained 8.9% in USD terms. Our target portfolio is expected to gain 6.8%. So, we beat all benchmarks this year.
 
This chart compares our portfolio to the benchmarks in Australian Dollar terms over the year:

 
We tracked the MSCI World Index very closely till May. After that we started to diverge. I posted equivalent Australian Dollar returns in the December monthly report. Here are annualized returns over various standard periods:


US Dollar returns are not very good over longer periods, but they still beat the HFRI, especially over the 3-5 year horizon. Here are the investment returns (currency neutral) and contributions of each asset class in 2020:
 
The contributions to return sum to the total portfolio return. Hedge funds and private equity had the highest returns and hedge funds by far the largest contribution to total return. Gold had the third highest return and the second highest contribution to total return. The rate of return on bonds is surprisingly good actually given the almost total loss of our Virgin Australia investment.

Investment Allocation
The main changes in allocation over the year was that we ran down our bonds allocation while increasing hedge funds, private equity, and gold mostly:
We started investing in art, which for the moment is grouped together with real estate.

Accounts
Here are our annual accounts in Australian Dollars:


There are lots of quirks in the way I compute the accounts, which have gradually evolved over time. There is an explanation at the end of this post. 

We earned $128k after tax in salary, business related refunds, medical payment refunds, tax refunds etc. This was down 13% on 2019 because Moominmama worked less and we had large tax bills due to investment income (investment income is reported pre-tax). We earned (pre-tax including unrealized capital gains) $370k on non-retirement account investments. The latter number was up on from last year. The former number continued its decline. The investment numbers suffered from the rise in the Australian Dollar ($67k in "forex" loss). Total current income was $498k. Not including mortgage interest we spent $121k. Total spending was down 18% on 2019 due to reclassifying mortgage interest as an investment cost since we paid off and redrew the mortgage and reduced spending due to the pandemic. Not counting mortgage interest, spending was down 9%.

$10k of the current pre-tax investment income was tax credits – we don't actually get that money so we need to deduct it to get to the change in net worth. We transferred $45k into retirement accounts from existing savings in "non-concessional (after tax) contributions. I list $2.4k of "inheritance". This is mostly due to adding the value of a painting I inherited, which I already had but hadn't included in net worth. The only other "things" included in our net worth are our car, a gold coin, and our house.

 
The change in current net worth, was therefore $324k. Looking at just saving from non-investment income, we dissaved $37k. So, before the transfer to retirement accounts we saved about $8k from salaries etc.

The retirement account is a bit simpler. We made $44k in pre-tax contributions (after the 15% contribution tax) and made an estimated $65k in pre-tax returns, which was strongly down on 2019. $8k in "tax credits" is an adjustment needed to get from the number I calculate as a pre-tax return to the after tax number. Taxes on returns are just estimated because all we get to see are the after tax returns. I do this exercise to make retirement and non-retirement returns comparable. Net worth of retirement accounts increased by $146k.

Finally, the housing account. I estimate that our house lost $34k in value. As our mortgage is now included in the current investment account there are no other entries in the housing account now.
 
Total investment gains were $401k, up 8% on 2019.

Total net worth increased by $436k,  which was up 12% on last year. $51k of this was from saving from non-investment sources, up 7% on last year. Thanks to employer superannuation contributions this was 30% of our total after tax non-investment income. Including investment gains our savings rate was 78% of our comprehensive after-tax income.


How Does This Compare to My Projection for This Year?
At the beginning of the year, I projected a gain in net worth of $425k, which turned out to be almost exactly correct. The baseline projection in my spreadsheet for 2021 is for a very high 19% rate of return, a 6% increase in spending, and flat other income, leading to an $800k increase in net worth to around $5.7 million. A more sensible projection would be for another $400k increase to around $5.3 million. Of course, anything could happen.
 
Notes to the Accounts
Current account includes everything that is not related to retirement accounts and housing account income and spending. Then the other two are fairly self-explanatory. However, property taxes etc. are included in the current account. Since we notionally converted the mortgage to an investment loan, mortgage interest is counted in current investment costs. So, the only item in the housing account now is increases or decreases in the value of our house. This simplified the accounts a lot but I still keep a lot of cells that might again be used in the future.
 
Current other income is reported after tax, while investment income is reported pre-tax. Net tax on investment income then gets subtracted from current income as our annual tax refund or extra payment gets included there. Retirement investment income gets reported pre-tax too while retirement contributions are after tax. For retirement accounts, "tax credits" is the imputed tax on investment earnings which is used to compute pre-tax earnings from the actual received amounts. For non-retirement accounts, "tax credits" are actual franking credits received on Australian dividends and the tax withheld on foreign investment income. Both of these are included in the pre-tax earning but are not actually received month to month as cash.... 
 
For current accounts "core expenditure" takes out business expenses that will be refunded by our employers and some one-off expenditures. This year, there are none of those one-off expenditures. "Saving" is the difference between "other income" net of transfers to other columns and spending in that column, while "change in net worth" also includes the investment income.

Closing Plus 500 Account


I opened a CFD trading account with Plus 500 in Moominmama's name in order to hedge Bitcoin trades over the weekend and do other trading experiments with small position sizes. I no longer need the account and they are charging monthly inactivity fees. So, I tried to withdraw the cash in the account. But they wouldn't transfer the money to our joint Commonwealth Bank account. They also refused to transfer the money to Moominmama's Interactive Brokers account, even though it has a BSB and bank account number. So, I opened a new bank account in her name at HSBC. But now we have to wait a month to get a statement that would be acceptable to Plus 500... To be continued

Aura Venture Fund II Still Accepting New Investors

Recently, I invested in the Aura Venture Fund II. There was a "first close" but the fund is still accepting new investors before a final close. From my experience with Aura Venture Fund I, these later investors will need to pay interest together with their initial investment to account for possibly benefiting from the funds initial investments that were made before they joined. You can get more information about the fund here. Usually, you will need to be qualified as a wholesale investor and the minimum investment is likely AUD 250k. Note that you will only need to invest a fraction of that at first with capital calls then spread over the life of the fund. My initial investment was AUD 62.5k.

My IRR on VF I is 27% so far, but of course there is no guarantee that the new fund will perform as well or that the final IRR will be that high for VF I when all investments are wound up. A big advantage is that the tax rate for Australian investors on early stage venture capital investments is negative. There is a 10% offset on your investments and zero capital gains or income tax. Also, investment in the fund may make a foreign investor eligible for an investor visa to immigrate to Australia.

Monday, January 04, 2021

December 2020 Report

The rallies in the Australian Dollar and the stock markets continued this month. The Australian Dollar rose from USD 0.7361 to USD 0.7725. The MSCI World Index rose 4.68%, the S&P 500 by 3.84%, and the ASX 200 rose 1.27%. All these are total returns including dividends. We gained 2.16% in Australian Dollar terms or 7.21% in US Dollar terms. The target portfolio is expected to have gained 0.07% in Australian Dollar terms and the HFRI hedge fund index is expected to gain 2.03% in US Dollar terms. So, we outperformed all benchmarks. In recent months, we have been tracking the target portfolio quite closely but with a positive alpha:
 
 
The target portfolio is a mix of indices (ASX200, MSCI World, HFRI, price of gold, Australian Dollar, private equity indices) and actual funds (TIAA Real Estate, TIAA Bond Market, Winton Global Alpha). If I was more industrious, I would use indices for the latter too... Hopefully, we can continue to beat the target portfolio by selecting better than average hedge funds etc. 
 
Increasingly our assets are in more illiquid investments that report with a lag. I am now using estimates for all of these:
  • Our house - we might change the value based on local sales up to a year after the month end! We will stick with last year's value until there is another local sale. Our house  isn't included in the calculation of the rate of return, though, only in our net worth calculation.
  • Aura VF1 - reports every 2 months and more than a month after the end of the month, I am using the IRR so far to project the return.
  • Aura VF2- reports every 2 months and more than a month after the end of the month. For the moment we will stick with the IPO price.
  • Winton Global Alpha - lag is only 2-3 days.
  • Cadence Opportunities - not sure how long the lag will be. I am using the historic alpha and beta to compute an expected return.
  • APSEC - seems to be 2-3 weeks after month end. I am using the expected HFRI return to project the return.
  • Masterworks - none of my paintings is yet tradable in the secondary market, so we are just using the IPO price.
Some of our other investments are listed on the market or quoted daily, but their NAV adjusts with a lag, such as Wilson Alternative Assets (WMA.AX) and TIAA Real Estate.

Here is a report on the performance of investments by asset class (currency neutral terms): 
 
Hedge funds added the most to performance followed by gold. Things that worked well this month:
  • Pretty much everything! But gold was the strongest performer in dollar terms, gaining AUD 28k.
What really didn't work:
  • URF.AX which invests in residential property in New York and New Jersey lost most – AUD 3.5k. Hearts and Minds (HM1.AX) had its first decline since March, losing AUD 1.3k. That's after gaining AUD 95k since the March low!
The investment performance statistics for the last five years are:
The first two rows are our unadjusted performance numbers in US and Australian Dollar terms. The following four lines compare performance against each of the three indices. We have the desired asymmetric capture for all three indices now and positive alpha compared to two of them. 
 
We moved further towards our long-run asset allocation. Real assets (real estate and art) are the asset class that is furthest from their target allocation (7.6% of total assets too little) followed by bonds (4.8% too much): 
 
 
We are now over-allocated to hedge funds, so will look to trim some positions over time. On a regular basis, we invest AUD 2k monthly in a set of managed funds, and there are also retirement contributions. Other moves this month:
  • I rebalanced my US 403b retirement account to 50% in the TIAA Real Estate Fund (direct real estate) and 50% in the CREF Social Choice Fund (balanced fund). I eliminated an allocation to the Money Market Fund and reduced the allocation to the Social Choice Fund.
  • I bought 5,000 Treasury Wine Estates shares.
  • I sold 1,000 CBAPI.AX Commonwealth Bank hybrid securities (convertible bonds).
  • I bought 3,000 shares of the IAU gold ETF, taking our position to 20,000 shares and finally around 10% of gross assets. 
  • I bought AUD 160k by selling US Dollars to get our currency exposure to 50% Australian Dollars and I bought GBP 25k by selling AUD.
  • I bought 1,000 Pershing Square Holdings (PSH.L) shares. This took me more overweight hedge funds, but I self-justified it by the fact that the shares are still trading at a big discount to NAV but the gap is narrowing. And anyway, the target portfolio weights are arbitrary, aren't they? I will look to trim the lower performing listed hedge funds once prices are nearer NAVs again.

Saturday, January 02, 2021

Restructuring Baby Moomin's Portfolio

About one and a half years ago I opened an account for baby Moomin with Generation Life to invest the money he inherited from my mother. For this calendar year, the account made about 6.6% on a pre-tax basis.* 


This wasn't as good as our portfolio, which returned about 12% in Australian Dollar terms. So, I felt that it was time to make some changes. I decided to switch out of the Dimensional World Allocation 50/50 Fund and the PIMCO Australian and Global Bond Funds. I am switching into the Dimensional World Allocation 70/30 and Vanguard Growth Funds, 50% in each. This is my first time investing in a Vanguard fund! The Vanguard fund is better tax optimized, while Dimensional has more of a tilt to value stocks, which are maybe back in favor. This will result in a total portfolio that is 60% stocks, 20% bonds, 10% infrastructure, and 10% hedge funds.

* This assumes that 30% tax was deducted. Actually, the tax was lower due to franking credits and offsets for foreign taxes. The post-tax return was 4.65%.

Friday, January 01, 2021

2020 Performance of Interactive Brokers Accounts

Inspired by Financial Samurai's post, here are the track records of our two Interactive Brokers accounts over 2020.

Moominpapa (in USD and compared to the S&P500):

This is the kind of result we are trying to achieve with our investment strategy and why we don't just invest in index funds. The only ETF we invest in is IAU - a gold ETF.

Moominmama (in AUD):


On the IB platform, I can only compare this inappropriately to US Dollar indices. By comparison, the ASX200 gained only 1.27% for the year. At the end of March it was down 23% for the year and so probably fell about as much as this portfolio did at the worst point a few days earlier. This is a pleasing result, though less downside would be nice, but then this is just a relatively small part of our total portfolio.


Monday, December 21, 2020

2020 Update on the Yale Endowment

Inspired by Financial Samurai's latest post, I am updating my post on the Yale Endowment. They have released preliminary results for the 2019-20 financial year (ends 30 June) and so we can update with three years of data. They returned 6.8% for the 2019-20 financial year, which is just below the S&P500's 7.5%. On the other hand, HFRI lost 0.6% and I lost 0.1% in USD terms. In the long run, since the financial crisis they have tracked the MSCI index with a little extra return and a little less volatility:

Their asset allocation continues to evolve, with domestic equity now only 2.5% and private equity now 41% of the portfolio:

Natural resources are now down to 4.5%. This is much more extreme than the typical family office portfolio, which has 49% of assets in alternatives including rela estate and commodities vs. 78% of the Yale portfolio.

Sunday, December 06, 2020

Breakdown into Taxes, Spending, and Saving

Following up on yesterday's post on our spending over time in different categories, I made another pretty graph, this time of the breakdown of income into taxes, spending, and saving. Everything is in Australian Dollars:


Total income is our gross income on our tax returns plus superannuation contributions that are not on our tax returns. This means that it includes taxable investment income. As a result, current saving looks quite big, but saving from our salaries is much smaller than this, nearer to AUD 20k per year. Superannuation contributions include employer and salary sacrifice contributions and not "non-concessional contributions", which I treat as transfers from current savings totaling AUD 180k during this period.

Mortgage principal payments were low last year when I paid off and redrew the mortgage. Even though in my investment performance reports I now include mortgage interest as an investment cost, for the purposes of these posts on spending I include it in housing costs to make our numbers more comparable to other people's. Investment costs are mostly margin interest as well as other fees. Taxes include income and property tax.

Saturday, December 05, 2020

Spending Over the Last Four Years

The chart shows our spending over the last four Australian tax years. The 2020-21 figures are an estimate based on the first five months of the year:

This year's spending is predicted to be lower than last due partly to COVID-19 and a lack of major house maintenance expenditure this year. Travel and cash spending have gone from significant items in 2017-18 to almost nothing or nothing this year. I deliberately reduced cash spending when I started this tracking of our spending in order to make tracking easier. The category that seems to have increased the most is childcare and education, which is not surprising as we went from one child in daycare only a few days a week to two children for more days of the week. The childcare subsidies we got have also been reduced. 

Also of interest are restaurants, which are the tiny sliver above supermarkets, which also declined a lot this year for obvious reasons (I think I got food delivered from a restaurant maybe a couple of times ever in my life). In 2017-18, restaurants were very low because I would usually pay with cash then. Really, restaurant spending was much higher than shown in the first two years. Last year it was AUD 3k and this year is estimated to be AUD 1k. Travel only includes flights and accommodation.

Currency Exposures

 I took a more granular look at currency exposures:

So, actually I still have less than 50% exposure to the Australian Dollar. This probably still exaggerates Australian Dollar exposure. I couldn't find any information on the Australian vs. international bond exposure in any of four Australian balanced funds we are invested in. So I ascribed all their bond exposure to Australian bonds. I am always frustrated by the low level of disclosure regarding investments by most Australian funds in comparison to American funds.

Thursday, December 03, 2020

November 2020 Report

Stock markets rose strongly and the US Dollar fell this month. The Australian Dollar rose from USD 0.7036 to USD 0.7361. The MSCI World Index rose 12.36%, the S&P 500 by 10.95%, and the ASX 200 rose 10.32%. All these are total returns including dividends. We gained 3.83% in Australian Dollar terms or 8.63% in US Dollar terms. The target portfolio is expected to have gained 2.70% in Australian Dollar terms and the HFRI hedge fund index is expected to gain 2.82% in US Dollar terms. So, we outperformed the latter two benchmarks. Here is a report on the performance of investments by asset class (currency neutral terms): 
Hedge funds added the most to performance and gold detracted the most.
 
Things that worked well this month:
  • The following funds all gained more than AUD 20k: Tribeca Global Resources (TGF.AX), Hearts and Minds (HM1.AX), Platinum (PMC.AX), Pershing Square Holdings (PSH.L). Pershing and Tribeca both gained more than 18%. URF.AX (US residential real estate) gained 34%.
What really didn't work:
  • Gold fell 5.9% or AUD 23k. Domacom (DCL.AX) drifted down, losing AUD 5.5k.
The investment performance statistics for the last five years are:
 
The first two rows are our unadjusted performance numbers in US and Australian Dollar terms. The following four lines compare performance against each of the three indices. We have the desired asymmetric capture for all three indices now and positive alpha compared to all three of them. 
 
The next graph shows monthly performance relative to the MSCI and HFRI indices in US Dollar terms. Before COVID-19 we seemed to track the hedge fund index closely. Post-COVID-19 we are tracking the MSCI closely. We did take on more risk but it wasn't that big a change I thought. So, our investments must also be behaving differently.

 
We moved further towards our long-run asset allocation. Bonds are still the asset class that is furthest from their target allocation (8.4% of total assets too much) followed by real assets (real estate and art) (8.0% too little):
 
 
We are now over-allocated to hedge funds, so will look to trim some positions over time. On a regular basis, we invest AUD 2k monthly in a set of managed funds, and there are also retirement contributions. Other moves this month:
  • I applied for AUD 100k of shares in the Cadence Opportunities Fund.
  • The first capital call for the Aura VFII fund was made for AUD 62.5k.
  • General Financial called 760 of our GNFSL baby bonds. We still have 240.
  • I made a trade in E-Mini S&P call options around the US election. Got out for a small profit, but should have held much longer.
  • I bought another 1,000 IAU gold ETF shares. Still not at 10% of gross assets in gold!
  • I sold 5,000 Hearts and Minds (HM1.AX) shares, taking our position down to 40,000. This was because the stock was trading at a large premium to NTA.
  • I bought AUD 25k by selling US Dollars. We are now at roughly 50/50 in terms of Australian Dollar linked and foreign currency linked investments and so will probably not buy more Australian Dollars for a while.
  • I borrowed AUD 100k from Interactive Brokers and AUD 30k from CommSec to fund the new investments.

Tuesday, December 01, 2020

New Investment or Trade? Treasury Wine Estates


Today, I bought 5,000 shares of Treasury Wine @ AUD 8.42 a share. The stock has traded as high as AUD 20.20 in the last three years. The price has fallen since China put a huge tariff on Australian wine. The company's announcement seemed positive to me. This stock was also recommended at the recent Sohn Investment Conference by Jun Bei Liu of Tribeca Investment Partners. I don't think she was betting on such a high tariff.

Monday, November 23, 2020

Asset Allocation of Family Offices

 Here is the average asset allocation of family offices a couple of years ago according to UBS:

It's odd that they count commodities separately from alternatives. Perhaps it was used in a study about commodity investing. Here is our current allocation that was partly inspired by university endowments:

It's quite close, though we have more in commodities (=gold) and less in cash. Alternatives here includes private equity, real estate, hedge funds, futures, and art. As usual, the value of our house is not included.

Saturday, November 14, 2020

Two New Investments

The second Aura Venture Fund finally closed this month and the first capital call was made for 25% of the investment. One of the things I like about these venture funds is that they gradually trickle money into the market. The others are that they have negative tax (a 10% tax offset on investments and no tax on gains or income) and the first fund has so far performed well. As I am committed to invest AUD 250k, this first payment was AUD 62.5k.

The second investment is the Cadence Opportunities Fund, which is an active trading equity hedge fund structured as a private company. When this fund was first floated and failed to IPO (instead it became an unlisted hedge fund), the main Cadence Fund (CAM.AX) was performing badly and so I decided not to invest. That was a mistake. The fund has gained more than 100% since launching. Now they have a rights issue and the opportunity for outside investors to obtain shares that aren't subscribed to by existing investors - the "shortfall". I put in a bid for AUD 100k in Moominmama's name.

Monday, November 02, 2020

October 2020 Report

Stock markets fell and the US Dollar rose this month. The Australian Dollar fell from USD 0.7156 to 0.7036. The MSCI World Index fell 2.41% and the S&P 500 by 2.66%, but the ASX 200 rose 1.94%. All these are total returns including dividends. We gained 2.35% in Australian Dollar terms and 0.63% in US Dollar terms. The target portfolio gained 0.22% in Australian Dollar terms and the HFRI hedge fund index is expected to lose 0.22% in US Dollar terms. So, we outperformed all benchmarks. Here is a report on the performance of investments by asset class (currency neutral terms):
Hedge funds added the most to performance and gold detracted the most.
 
Things that worked well this month:
  • Regal Funds was the top performer, gaining AUD 20.8k. Hearts and Minds gained AUD 14.4k.
What really didn't work:
  • As well as gold (down AUD 1.8k), London listed stocks 3i (2.6k) and Pershing Square Holdings (1.9k) were the worst performers.
The investment performance statistics for the last five years are:
 
The first two rows are unadjusted numbers in US and Australian Dollar terms. The following four lines compare performance against each of the three indices. We have the desired asymmetric capture for all three indices now and positive alpha compared to all three of them.
 
We moved further towards our long-run asset allocation. Bonds are still the asset class that is furthest from their target allocation (11% of total assets too much) followed by real assets (8% too little):
 

On a regular basis, we invest AUD 2k monthly in a set of managed funds, and there are also retirement contributions. Other moves this month:
  • I invested USD 20k in two new paintings at Masterworks. I now have USD 40k invested.
  • I bought 278k Domacom shares (DCL.AX).
  • I bought 25,000 Bluesky Alternatives shares (WMA.AX). 
  • I borrowed AUD 100k from IB and used it to reduce our CommSec margin loan and increase our offset account balance.

Friday, October 23, 2020

Masterworks Sells First Painting, Investors Make 32% in One Year

Masterworks sold a Banksy Mona Lisa for $1.5 million after holding it for one year. Investors gain 32% after all fees and costs. I don't think this would be typical but nice to see that this first deal worked out.

I've now invested in four paintings through Masterworks.