Tuesday, October 16, 2018

More Progress on Programming the Trading Model

Now this is a nice equity curve! This was produced by the computer making daily decisions for each day this year so far, using the full version of my model but without stops. The idea is it tracks what happens to $1000 compounded (without commissions or any slippage etc. - former is not important latter might be). The blue line is the NASDAQ 100 index also rebased to 1000 as the beginning of January. The computer is also printing out a list of instructions one for each day like this:

5082    7637.43018       1.00000       0.00000  D buy. Stay long
5083    7490.00000       0.00000       0.00000  K sell. Go short
5084    7399.00977       0.00000       0.00000  K sell. Stay short
5085    7352.81982       0.00000       0.00000  K sell. Stay short
5086    7371.62012       0.00000       0.00000  K sell. Stay short
5087    7044.50000       0.00000       0.00000  D sell. Stay short
5088    6964.02978       0.00000       1.00000 R buy not confirmed by pdD D sell. Stay short
5089    7157.20996       1.00000       1.00000 R Buy outside BB confirmed by pdD
5090    7068.67041       1.00000       1.00000 R Buy outside BB confirmed by pdD
5091      NA       1.00000       1.00000 R Buy outside BB confirmed by pdD

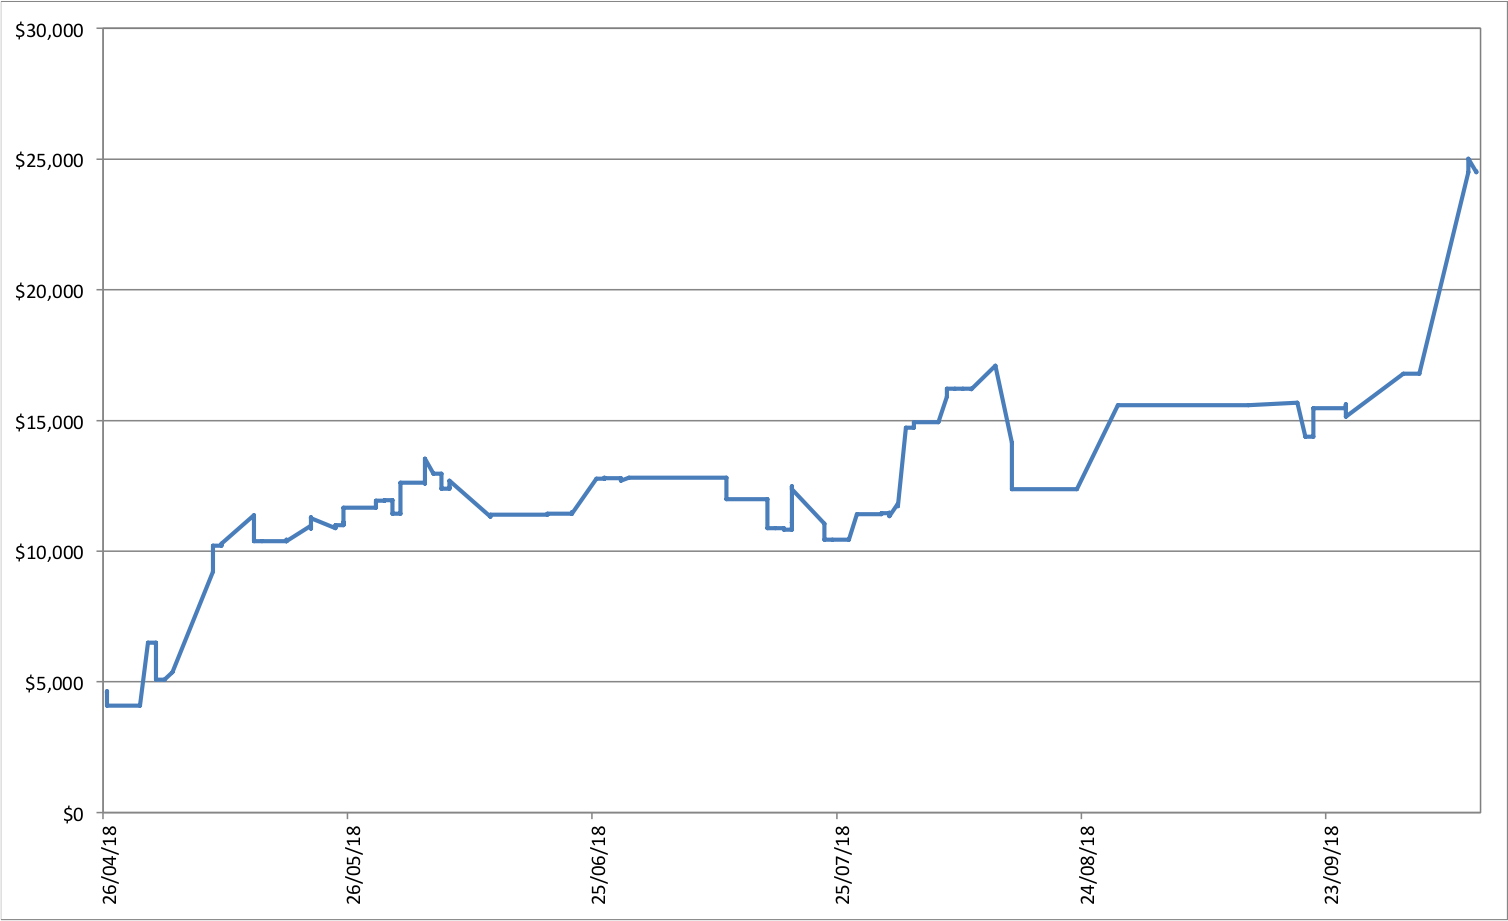
These are the most recent decisions, including today's decision to stay long. The "NA" indicates that we don't yet know the index value for today...

It also produces some performance statistics:

Alpha       1.76456 Beta      -0.21425  ror       1.68344 Sharpe       5.47108

That means 176% p.a. of alpha... This is based on compounding the daily alpha over the year. Beta to the market is slightly negative and so compound rate of return for the year is a little less than alpha. I don't expect that high rates of return in other years. Conditions are ideal this year and probably the model is a bit overfitted. One of the reasons for doing this programming is to make it easier to test the model on larger samples.

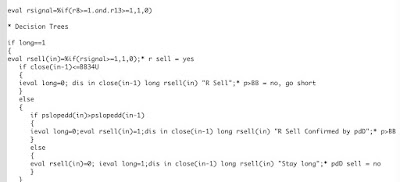
Next I will add some refinements like using futures prices instead of index prices for performance results. Oh yes, and adding stops!

P.S.
When I ran the algorithm on the S&P 500, I found at least one bug which also needs ironing out.


Firetrail Cancels IPO

I looked at the prospectus but decided not to invest. Apparently they got more than the minimum funds raised but claim that there aren't enough different shareholders...

Firetrail Absolute Return Limited withdraws listed investment company IPO offer

Tuesday 16 October 2018

Dear Moom,

After careful consideration Firetrail Absolute Return Limited (Company) (in consultation with Firetrail Investments Pty Limited (Firetrail)) has made the decision, in the best interest of investors, to withdraw the initial public offering for ordinary shares in the Company (Offer) which was scheduled to close this Friday, 19 October 2018.

The Company made the decision to withdraw the Offer (in consultation with Firetrail) as it was in the best interests of investors to do so given liquidity concerns, in particular the concentration of the shareholder base. Listed Investment Companies (LICs) that do not have a well-diversified shareholder base are generally at a higher risk of the share price trading at a discount to the company’s net tangible assets. As such, we believe it was in the best interests of shareholders to withdraw the Offer, despite raising in excess of the minimum investment amount.

Investors that would like to gain access to the strategy are still able to do so through the Firetrail Absolute Return Fund which is still open to investors and has delivered strongly during the recent market volatility over the past week. Since Monday 8 October 2018, the share market has fallen over -4%1. The Firetrail Absolute Return Fund has delivered a positive return of approximately +1.3% over the same period, highlighting the benefit of the strategy which aims to deliver positive absolute returns above the RBA Cash Rate, independent of movements in the underlying share market.

Please contact us if you would like more information on investing in the Fund.

Kind regards,

Firetrail Investments

Sunday, October 14, 2018

NQ Equity Curve


This is the equity curve trading NQ futures since the beginning of the trading experiment. It starts at about USD 4k because that was the cumulative profit for 2006-8. This isn't our total trading performance because I've also traded other things like ES futures and earned a little interest.

The little tick down at the end is the "bad trade", which wasn't so bad in the end, but that was mostly luck.

I've done a bit more programming and now the program produces a coherent list of trades, one for each day. But I've only written up part of the system yet, so you wouldn't want to actually trade them :) In fact, here is the fractional gain (i.e. 0.15 is 15% gain, not compounded) if you traded "the strategy" for this year:


In other words, it breaks even in the end, which is what you'd probably expect for a random set of trades. This kind of thing is now easy to produce, which is one of the main things this is all about.

To explain this curve, the model starts at long on 4th January and some of the code is written for what to do if you are long - it might tell you to switch to short, but not much code is written yet for what you should do if you are short. So there is little code to flip you back to long again. As a result the model is stuck on short for much of the time...

Saturday, October 13, 2018

Started to Code the Decision Tree


After a couple of hours of coding and debugging I got the first little bit of the model decision tree to work and spit out buy and sell decisions. The output looks like this:

4895    6584.58008 1       0.00000 Stay long
4896    6653.29004 0       1.00000 R Sell Confirmed by pdD
4897    6676.62988 0       1.00000 Go long
4898    6677.93994 0       0.00000 Stay short
4899    6662.66016 0       0.00000 Stay short
4900    6708.49023 0       0.00000 Stay short

As the decision tree is far from complete, only the first two orders – long and then short – make any sense. The first number is a code for the date, the second is the closing value of the NASDAQ 100 index on the previous day (so that it's easier for me to work out where I am than the obscure date codes). Then there are codes for buy and sell and then a verbal description of the decision and why it was taken.

Luckily, writing computer code is a core practical skill for professional economists (or you should have these skills if you don't!) we took programming courses as part of our first year undergrad study.