Not sure why the calculation I posted here showed positive tax, but both the ATO and my own calculation show that Moominmama's tax assessment was -$127 for 2021-22. That's kind of like the holy grail or something :)
Showing posts with label Goals. Show all posts
Showing posts with label Goals. Show all posts
Monday, October 03, 2022
Moominmama Actually Had Negative Tax for 2021-22
Wednesday, August 04, 2021
Coinvestment, Revised Target Allocation, and Rights Issue
I'm making an investment in a pre-IPO company alongside a venture capital fund and other investors. I valued the company based on their forward projections for EBITDA and the multiples similar companies listed on the stock exchange have. Of course, the company could fail and so it is sensible to take a middle valuation between the extremes of zero value and the value if the company succeeds as planned. This still gave a good gain on the current valuation. In reality, total loss is unlikely as the company is already approaching profitability. The funding is for expansion. The worst outcome is more likely a sale for the current valuation or something less to a competitor. I am planning to invest about 2% of our portfolio in this company.
This means I will have to raise my target allocation to private equity and reduce my allocations to hedge funds and long-only equities. To also take into account my future commitment to a venture capital fund I am increasing the private equity allocation of gross assets from 10% to 15%. I am reducing the hedge fund allocation from 24% to 22%, Australian large cap from 9% to 8%, US stocks from 6% to 5%, and rest of the world stocks also from 6% to 5%. I would be happy to have an even higher allocation to private equity if I had access to enough diverse good quality opportunities. So, changing the target allocation isn't just like the US government raising its debt ceiling every time they hit it :)
By contrast, I am an investor in listed company Domacom (DCL.AX), which has been suspended from the ASX for a while, pending completion of a deal to effectively acquire a company called AustAgri. The ASX instructed them to raise more capital before relisting. I don't intend to participate in the rights issue, especially as the issue price is slightly above the last traded price of the shares on the ASX. Success of the company in the short-run really depends on this AustAgri transaction and it is still hard to be certain why it is so delayed and what will happen. Even after that transaction, the company will not be in anywhere near as good a position as this pre-IPO company.
Saturday, January 12, 2019
Annual Report 2018
Investment Returns
In Australian Dollar terms we gained 2.3% for the year while the MSCI gained 0.9% and the ASX200 lost 1.1% (all pre-tax including dividends). In USD terms we lost 7.7%, while the MSCI lost 8.9% and the S&P500 lost 4.4%. So we beat Australian and international markets but not the US market. In the longer term perspective, our returns and market returns were closely aligned this year:

Here are returns over various standard periods (not annualized):

We have done well compared to the ASX 200 over the last 5 years. Not as great over 10 years. In USD terms we have done well compared to the MSCI over the last three years and underperformed over longer time periods.
Investment Allocation
The main change in allocation over the year is the large increase in cash and real estate when we received the inheritance:
 I also reduced my allocation to Australian large cap stocks around the same time, in early October. Earlier in the year, the allocation to cash falls as we increased trading and invested more in the Winton Global Alpha Fund (commodities) and subscribed to some IPOs. Private equity also increased with investment in Aura and IPE and then decreased with the takeover of IPE.
Accounts
I stopped reporting monthly accounts this year, but I've still been computing them. Here are our annual accounts in Australian Dollars without including the inheritance:
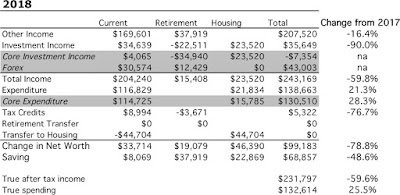
We earned $170k after tax in salary, business related refunds, medical payment refunds, tax refunds etc. We earned (pre-tax including unrealised capital gains) $35k on non-retirement account investments. Both of those numbers were down strongly from last year. I stepped down from an admin role that paid extra salary and earned less in consulting etc. The investment numbers would have been worse without trading and the fall in the Australian Dollar ($31k in "forex" gain). Total current after tax income was $204k. Not including mortgage interest we spent $117k – Total actual spending including mortgage interest was $133k.
$9k of the current pre-tax investment income was tax credits – we don't actually get that money so we need to deduct it. Finally, we transferred $45k in mortgage payments (and virtual saved interest) to the housing account. The change in current net worth, was therefore $34k. Looking at just saving from non-investment income, we saved $8k. Both these numbers are down steeply from last year.
The retirement account is a bit simpler. We made $38k in contributions (after the 15% contribution tax) and the value fell by an estimated $23k in pre tax returns. $4k in "tax credits" is an adjustment needed to get from the number I calculate as a pre-tax return to the after tax number. Taxe on returns are just estimated because all we get to see is the after tax returns. I do this exercise to make retirement and non-retirement returns comparable. Net worth of retirement accounts increased by $19k.
Finally, the housing account. We spent $16k on mortgage interest. We would have paid $24k in mortgage interest if we didn't have an offset account. I estimate our house is worth $24k more than I did last year based on recent sales in our neighbourhood. After counting the transfer of $45k into the housing account housing equity increased $46k of which $23k was due to paying off principal on our mortgage.
Total net worth increased by $99k, $69k of which was saving from non-investment sources. Comparing 2018's accounts with 2017's, we saved 49% less and net worth increased by 79% less. Total after tax income was almost $230k, down 60% on last year. This number feels a lot more "reasonable" than last year.
Though our saving is down sharply on last year, we still saved in total 33% of our after tax non-investment income. Of course, this is less than last year's 50%. Including investment income our savings rate was 43%.
Here are the same accounts expressed in US Dollars:

How Does This Compare to My Projection for This Year?
At the beginning of the year, I projected a gain in net worth of $250k based on an 8% return on investments and a 6% increase in spending. As you can see, spending rose 25% and return on investments was only 2%. As a result net worth increased by only $99k.
Looking to 2019, I think we will be lucky if our investment return is 0%, as I am quite bearish about the world economy and stockmarket. If I pencil in a 6% rise in spending, then we would only increase net worth by $60k.
In Australian Dollar terms we gained 2.3% for the year while the MSCI gained 0.9% and the ASX200 lost 1.1% (all pre-tax including dividends). In USD terms we lost 7.7%, while the MSCI lost 8.9% and the S&P500 lost 4.4%. So we beat Australian and international markets but not the US market. In the longer term perspective, our returns and market returns were closely aligned this year:

Australian Dollar Returns
Here are returns over various standard periods (not annualized):

We have done well compared to the ASX 200 over the last 5 years. Not as great over 10 years. In USD terms we have done well compared to the MSCI over the last three years and underperformed over longer time periods.
Investment Allocation
The main change in allocation over the year is the large increase in cash and real estate when we received the inheritance:

Accounts
I stopped reporting monthly accounts this year, but I've still been computing them. Here are our annual accounts in Australian Dollars without including the inheritance:

Annual Accounts
There are lots of quirks in the way I compute the accounts, which have gradually evolved over time. Here is an explanation:
Current account is all
non-retirement accounts and housing account income and spending. Then
the other two are fairly self-explanatory. But housing spending only
includes mortgage interest. Property taxes etc. are included in the
current account. There is not a lot of logic to this except the
"transfer to housing" is measured using the transfer from our checking
account to our mortgage account. Current other income is reported after
tax, while investment income is reported pre-tax. Net tax on investment
income then gets subtracted from current income as our annual tax refund
or extra payment gets included there. Retirement investment income gets
reported pre-tax too while retirement contributions are after tax. For
retirement accounts, "tax credits" is the imputed tax on investment
earnings which is used to compute pre-tax earnings from the actual
received amounts. For non-retirement accounts, "tax credits" are actual franking credits
received on Australian dividends and the tax withheld on foreign
investment income. Both of these are included in the pre-tax earning but
are not actually received month to month as cash.... Finally, "core
expenditure" for housing is the actual mortgage interest we paid.
"Expenditure" adds back how much interest we saved by keeping money in
our offset account.
We include that saved interest in the current account as the earnings
of that pile of cash. That virtual earning needs to be spent somewhere
to balance the accounts... It is also included in the "transfer to
housing". Our actual mortgage payments were less than the number
reported by the $6k in saved interest. For current accounts "core
expenditure" takes out business expenses that will be refunded by our
employers and some one-off expenditures. This year, I think there are
none of those one-off expenditures. "Saving" is the difference
between "other income" net of transfers to other columns and spending in
that column, while "change in net worth" also includes the investment
income.
We earned $170k after tax in salary, business related refunds, medical payment refunds, tax refunds etc. We earned (pre-tax including unrealised capital gains) $35k on non-retirement account investments. Both of those numbers were down strongly from last year. I stepped down from an admin role that paid extra salary and earned less in consulting etc. The investment numbers would have been worse without trading and the fall in the Australian Dollar ($31k in "forex" gain). Total current after tax income was $204k. Not including mortgage interest we spent $117k – Total actual spending including mortgage interest was $133k.
$9k of the current pre-tax investment income was tax credits – we don't actually get that money so we need to deduct it. Finally, we transferred $45k in mortgage payments (and virtual saved interest) to the housing account. The change in current net worth, was therefore $34k. Looking at just saving from non-investment income, we saved $8k. Both these numbers are down steeply from last year.
The retirement account is a bit simpler. We made $38k in contributions (after the 15% contribution tax) and the value fell by an estimated $23k in pre tax returns. $4k in "tax credits" is an adjustment needed to get from the number I calculate as a pre-tax return to the after tax number. Taxe on returns are just estimated because all we get to see is the after tax returns. I do this exercise to make retirement and non-retirement returns comparable. Net worth of retirement accounts increased by $19k.
Finally, the housing account. We spent $16k on mortgage interest. We would have paid $24k in mortgage interest if we didn't have an offset account. I estimate our house is worth $24k more than I did last year based on recent sales in our neighbourhood. After counting the transfer of $45k into the housing account housing equity increased $46k of which $23k was due to paying off principal on our mortgage.
Total net worth increased by $99k, $69k of which was saving from non-investment sources. Comparing 2018's accounts with 2017's, we saved 49% less and net worth increased by 79% less. Total after tax income was almost $230k, down 60% on last year. This number feels a lot more "reasonable" than last year.
Though our saving is down sharply on last year, we still saved in total 33% of our after tax non-investment income. Of course, this is less than last year's 50%. Including investment income our savings rate was 43%.
Here are the same accounts expressed in US Dollars:

How Does This Compare to My Projection for This Year?
At the beginning of the year, I projected a gain in net worth of $250k based on an 8% return on investments and a 6% increase in spending. As you can see, spending rose 25% and return on investments was only 2%. As a result net worth increased by only $99k.
Looking to 2019, I think we will be lucky if our investment return is 0%, as I am quite bearish about the world economy and stockmarket. If I pencil in a 6% rise in spending, then we would only increase net worth by $60k.
Saturday, May 19, 2018
How Big Should the Trading Program Be?
At the moment I am still in the experimental phase of the trading program. A 1 contract S&P or NASDAQ position either adds or subtracts about 0.1 beta to the portfolio. So if the beta of our portfolio to the market was 1.0, trading modifies this to 0.9 when short to 1.1 when long. My goal is to be able to hedge our portfolio against a market crash. That means we need to subtract up to 1 full beta from the portfolio. On the long side we then would double exposure. This means that the trading program needs eventually to be 10 times the size it is now. Using 3 times leverage on the cash in the trading account that implies allocating 25% of assets to trading. My existing allocation has 25% of assets allocated to managed futures. This total could be allocated between my own trading and "outside managers" such as Winton and meet this goal.
Why 3 times leverage? Simulation shows that about a 12% drawdown is possible. Remember that we use stops and or hedging to limit possible daily losses. So this drawdown means a string of large losses. With 3 times leverage that would wipe out 1/3 of the trading account. More than that and it will reduce the earning potential of the account too much going forward, I think. And be way too scary.
Why 3 times leverage? Simulation shows that about a 12% drawdown is possible. Remember that we use stops and or hedging to limit possible daily losses. So this drawdown means a string of large losses. With 3 times leverage that would wipe out 1/3 of the trading account. More than that and it will reduce the earning potential of the account too much going forward, I think. And be way too scary.
Monday, April 02, 2018
New Era in Moomin Valley

In a few months we will reach "financial independence" - our annual spending will be feasible with a little less than a 3% p.a. withdrawal rate. About 60% of this was due to our own efforts working, saving, and investing over the last 24 years and 40% from inheritance. I never depended on receiving the inheritance, which is why I saved so hard. Because I knew finding an academic job could be very hard when my initial short-term contracts ended, I saved up to 50% a year at times. This allowed me to live for a year in 2001-2 without working for pay, traveling around the world looking for work. Similarly, when we moved to Australia, I could experiment with trading in the financial markets while exploring alternatives.
On the other hand, I think I was willing to take more risk based on the probability that we would receive a substantial amount. In the case of the financial crisis in 2008-9, I took on too much risk. The pressure of trying to make a living from trading with a small amount of capital combined with the volatility of the financial crisis was too much and I decided to stage an academic career comeback, which has been very successful.
The other half of the financial independence equation in the blogging community is usually "retire early". I don't have any plan to do that any time soon. I like the research side of my work and I have my teaching etc organized so that going forward it shouldn't be too hard - I only need to teach during one half of the year for now. As things are at the moment, it would be hard to find a better job than this. So, it doesn't make any sense to sacrifice my salary. I am actually exploring a potential career move to another bigger city. That job would have more admin and maybe no teaching. Introspection tells me that I wouldn't like to retire currently. On the other hand, Moominmama is pretty frustrated with her work at the moment and so now has options to take a break and consider alternatives.
On the other hand, our spending is growing by more than the rate of inflation and I expect that to continue. So the current 3% withdrawal rate would become more than a 3% rate over time unless investment returns are very good, which does not seem likely. Continuing to earn some money does sound good in those circumstances.
Is continuing to work limiting our location choices? At the moment, I don't think there is another location that we would both agree on and which would make practical sense. We have to consider education opportunities for little Moomin. So, moving to a small town in Australia does not sound like a good move from that perspective. The nice parts (with good education) of the two biggest Australian cities are extremely expensive and would take us out of the financial independence zone. We definitely would never move to Moominmama's home country (she doesn't even want to visit at the moment). Moominmama is not enthusiastic about moving to either of my home countries. One is too cold and dark as far as she is concerned (Northern Europe) and the other too foreign and dangerous (Middle East). That leaves Southern Europe as a sensible or feasible alternative, but I don't think we want Moomin to grow up speaking Spanish or French? I think it would be hard for Moominmama to learn those languages too, though not difficult for me. So, continuing to work is not stopping us from making a move to another location that we could or would want to make.
So, for now not much will change, but this blog will change. I plan to stop reporting actual earning, spending, and net worth figures. Going forward, all numbers will be in percentage terms only. When the vast majority of our net worth was the result of our own work and effort I was happy to report those numbers, and reporting, even though it is mostly anonymously, helped keep us on track. But now that so much of our net worth has not come from our own efforts and we don't have the goal of achieving financial independence anymore, I don't want to report the numbers any more. On the other hand, I'm not going to erase the existing blog.
Our long term goal now is to pass on at least as much wealth in real terms to the next generation as we received from the previous one. My parents also inherited more than 2/3 of their eventual net worth, though they also saved and worked hard to build up wealth in earlier years. They eventually passed on what they inherited.
Saturday, March 31, 2018
Target Portfolio
Following up on my previous post where I tested the performance of an idealized portfolio, here are some more ideas about an actual implementation. In total, 50% would be allocated to stocks, half of that Australian and half of that international. A fifth (maybe more) of the Australian category would be allocated to small cap stocks. Of the remaining 20% portfolio allocation half would go into unhedged funds/stocks and 10% into hedge fund type funds, probably mostly listed hedge funds, such as Cadence Capital (CDM.AX). Of the 25% in international stocks, half would go into hedge funds, primarily Platinum Capital (PMC.AX), which pays franked dividends. Then 25% is allocated to managed futures, probably mostly Winton Global Alpha Fund. This should mostly be held in a superannuation account for tax reasons – pay 15% tax on distributions instead of 47%. That means I am going to need a self-managed superannuation fund.
5% is allocated to gold. This would be held in a taxable account as it doesn't pay dividends. On the other hand, the long-term capital gains rate in superannuation accounts is 10% (and zero after going into pension mode) and my current long-term capital gains rate is 23.5%. If Labor get into power, which is likely, and implement their program, which is less likely, that will rise, though in retirement I expect my marginal tax rate will fall back into the 32.5% bracket but with Medicare tax and Labor's proposal, I would still be paying more than 25% for long-term capital gains. So it makes sense to get more money into superannuation, which is zero taxed in pension mode for the first $1.6 million for each partner. I plan to initially invest about $900k in the SMSF. This will come from rolling over my superannuation fund now at Colonial First State and adding $300k - you can invest 3 years of contributions at once - for each of Moominmama and myself.
The remaining 20% is allocated roughly equally to (mostly direct - i.e. not listed) real estate, bonds, private equity, and cash. Then the whole thing is levered up a bit, with the overall exposure adjusted for market conditions. I expect that debt will be roughly equal to the value of our house ($840k).
To summarize, this is the asset allocation (not including our house):

We are quite a long way from that - in particular very overweight long Australian shares and underweight hedge funds, managed futures, and gold.
Sunday, March 04, 2018
Optimal Portfolios
I have been doing some experimentation with designing optimal portfolios, something which I last looked at in 2011. I have the monthy rates of return on various asset classes going back to 1996. These include international shares (MSCI World Index, gross) both hedged into Australian Dollars and not. Australian shares (ASX 200 accumulation), Managed Futures (a mix of Man AHL and Winton), direct real estate (a particular US fund as a proxy), hedge funds (HFRI index), the bond market (again I'm using a fund as a proxy), Australian Dollar cash, and gold in Australian dollars. You can use the solver in Excel to find the allocation that monthly rebalanced gives the highest Sharpe Ratio. This optimal portfolio varies over time but generally it doesn't like hedge funds and allocates about 10-20% to gold, and 20-40% to managed futures. Because future performance won't necessarily be the same as past performance (particularly a worry for managed futures) and because managed futures, in particular, are not tax effective – they pay most income out subject to marginal tax rates – I wouldn't allocate according to a particular optimization. A target portfolio gets near the optimal performance while being more diversified and a bit more tax effective:
This graph shows the performance of various assets and a "target portfolio":

Here the target portfolio is 25% international shares (half hedged into Australian dollar and half not), 25% Australian shares, 25% managed futures, and then 5% in each of real estate, bonds, cash, gold, and hedge funds. Then the whole thing is geared up a bit with borrowing. It performs pretty nicely over various historical periods.
Here we have a close up of performance since the financial crisis:
 I've managed to match the performance of the Australian index but have lagged behind the MSCI World Index. It matches the performance of the MSCI but has a smoother path. The next graph shows ten year rolling returns:
 Here we see that such a portfolio clearly dominates in the long-run over regular stock indices or my own performance, which has not been good over a ten year period recently. The graph also shows how the performance of the Australian stock market has declined. It had very high ten year returns prior to the crisis, but now has lower returns than international shares over the last ten years.
I have been moving in the direction of the optimal portfolio by diversifying out of Australian shares and buying managed futures, but it has been too slow so far. In the last few months I have been buying $A10k of managed futures each month. I also allocated more to international investments when I reinvested my CFS superannuation fund in their wholesale funds.
This graph shows the performance of various assets and a "target portfolio":

Here the target portfolio is 25% international shares (half hedged into Australian dollar and half not), 25% Australian shares, 25% managed futures, and then 5% in each of real estate, bonds, cash, gold, and hedge funds. Then the whole thing is geared up a bit with borrowing. It performs pretty nicely over various historical periods.
Here we have a close up of performance since the financial crisis:


I have been moving in the direction of the optimal portfolio by diversifying out of Australian shares and buying managed futures, but it has been too slow so far. In the last few months I have been buying $A10k of managed futures each month. I also allocated more to international investments when I reinvested my CFS superannuation fund in their wholesale funds.
Thursday, January 11, 2018
Projection for 2018
My fair weather forecast for 2018 is a net worth gain of about AUD 250k to reach about AUD 2.3 million. It is based on expected salaries and retirement contributions, an increase in spending of 6% and an 8% rate of return on investments.
Sunday, April 19, 2015
Snapshot at an Inflection Point
Now the house purchase is complete * and we are starting a new financial restructuring plan I thought of drawing up a balance sheet as a snapshot of this "inflection point". It's in a different format to anything I've done before as it is based on the various accounts things are in and how flexible they are rather than asset classes and beta and other investment theory things I've considered in the past. This is all in Australian Dollars:

Long term assets are retirement accounts, checking, saving, cash, and credit cards are short term and everything else is medium term as it can be restructured/sold/closed etc. but probably won't be done fast. So, the goal now is to increase the size of the offset account until it is the size of the mortgage. In the meantime adding a bit to some investments - we still have $2000 of automatic savings a month outside of retirement accounts for example - and increasing the margin loan. Then one day in a few years there will be a flip - pay off most of the mortgage, redraw the mortgage, then pay-off the margin loan and make investments.
BTW, if you're wondering why we have a thousand dollars in Australian Dollars cash, a big chunk of that is a travel money card.
* As you can see from the balance sheet we still didn't get the deposit on our apartment back, so everything is not yet settled.
Monday, December 01, 2014
Half a Century

Today is my fiftieth birthday. It feels like quite a milestone. This morning I was sitting in a presentation with a colleague from a unit I used to work in who when I asked him how things are going said: "This is my final year, I'm retiring"... so after discussing that for a bit I told him it was my 50th birthday today. He said he was working too hard to celebrate back in 2000. It's probably the halfway point in my adult life, though you never know how long you are going to live, of course, we can just rely on life expectancies and how long our parents lived.
Careerwise, I think I need to be a bit less like this guy - "my strategic plan is to say yes to everything" and more like this guy. Two of the bloggers I follow. I find it hard to say no, though I am doing it more and more. Early in your career I do think you want to say yes a lot, but then you need to start to get more selective or you'll never get anything good done. You need to decide what to invest time in. I've been fairly successful. Three years ago I was appointed full professor and I am a reasonably well known researcher in some circles. I'm happy with some of my research, but I still think I could do much better work.
I got my PhD at age 29, but in a lot of other ways I've been a late developer. Since my fortieth birthday I achieved one major typical life goal - getting married (six years ago now) but at 50 I still don't have children, have never owned a house etc. I guess these goals were never that important to me or I actually was opposed to them. If you follow the blog, you'll know we are still pursuing those two goals. We probably have achieved the goal of financial security, though it could still all unwind if things go really wrong. I'm definitely not a risk averse person. I have come quite a way though from the crisis point in 2008. I made the right decision to refocus on my academic career.
Friday, October 18, 2013
And in US Dollars Too
As the Australian Dollar has risen strongly in the last few days, it has pushed us over the 1 million US Dollar mark, at least intra-month, too.
Tuesday, October 01, 2013
One Million Australian Dollars
We reached the long-awaited million Australian dollar net worth level. We aren't quite at a million US Dollars yet. It was back in 2007 when we first crossed a half million Australian Dollars mark for the first time and in 2008 we briefly touched half a million US Dollars. In between there was a global financial crisis, a marriage, and a move to Australia... well in reverse order... attempts to make a living as a trader, being unemployed, and then getting back onto the career track at a higher salary than before:
 I actually thought yesterday when the Australian market was falling 85 points (1.6%) that we wouldn't remain above the line at the end of the month. Actually, the Geared Share Fund fell 3.3% on the day but was still up 5.5% on the month.
So the numbers come in at $A1.026 million or $US 958k. Rate of return for the month was 8.63% in USD terms or 3.5% in Australian Dollar terms. The MSCI gained 5.2% and the S&P500 3.14%. More accounting details to come.
So the numbers come in at $A1.026 million or $US 958k. Rate of return for the month was 8.63% in USD terms or 3.5% in Australian Dollar terms. The MSCI gained 5.2% and the S&P500 3.14%. More accounting details to come.
Wednesday, January 02, 2013
2013 Forecast
We came in near the top of 2012's predicted range for net worth. For this year, the optimistic forecast is $A975k or just over $USD 1 million. Buying a house would cost about $50k in costs and then around $2,500 a month in higher costs. So let's assume a $75k hit. A fall in the Australian Dollar to 75 cents would increase Australian Dollar net worth to over $A1 million and reduce US Dollar net worth to $US765k. While we are expecting a 10% investment return a 10% fall instead would mean net worth was $175k lower. So the expected range in Australian Dollars is $A700k-$A1 million and in US Dollars $500k to $1 million.
Moominvalley December 2012 Report
This was the 6th month of positive investment returns in Australian Dollar terms (7th in USD terms). We yet again hit new net worth highs in both Australian and US Dollar terms of $A754k (+$A38k) and $US784k (+37k). The Australian Dollar was fairly stable.
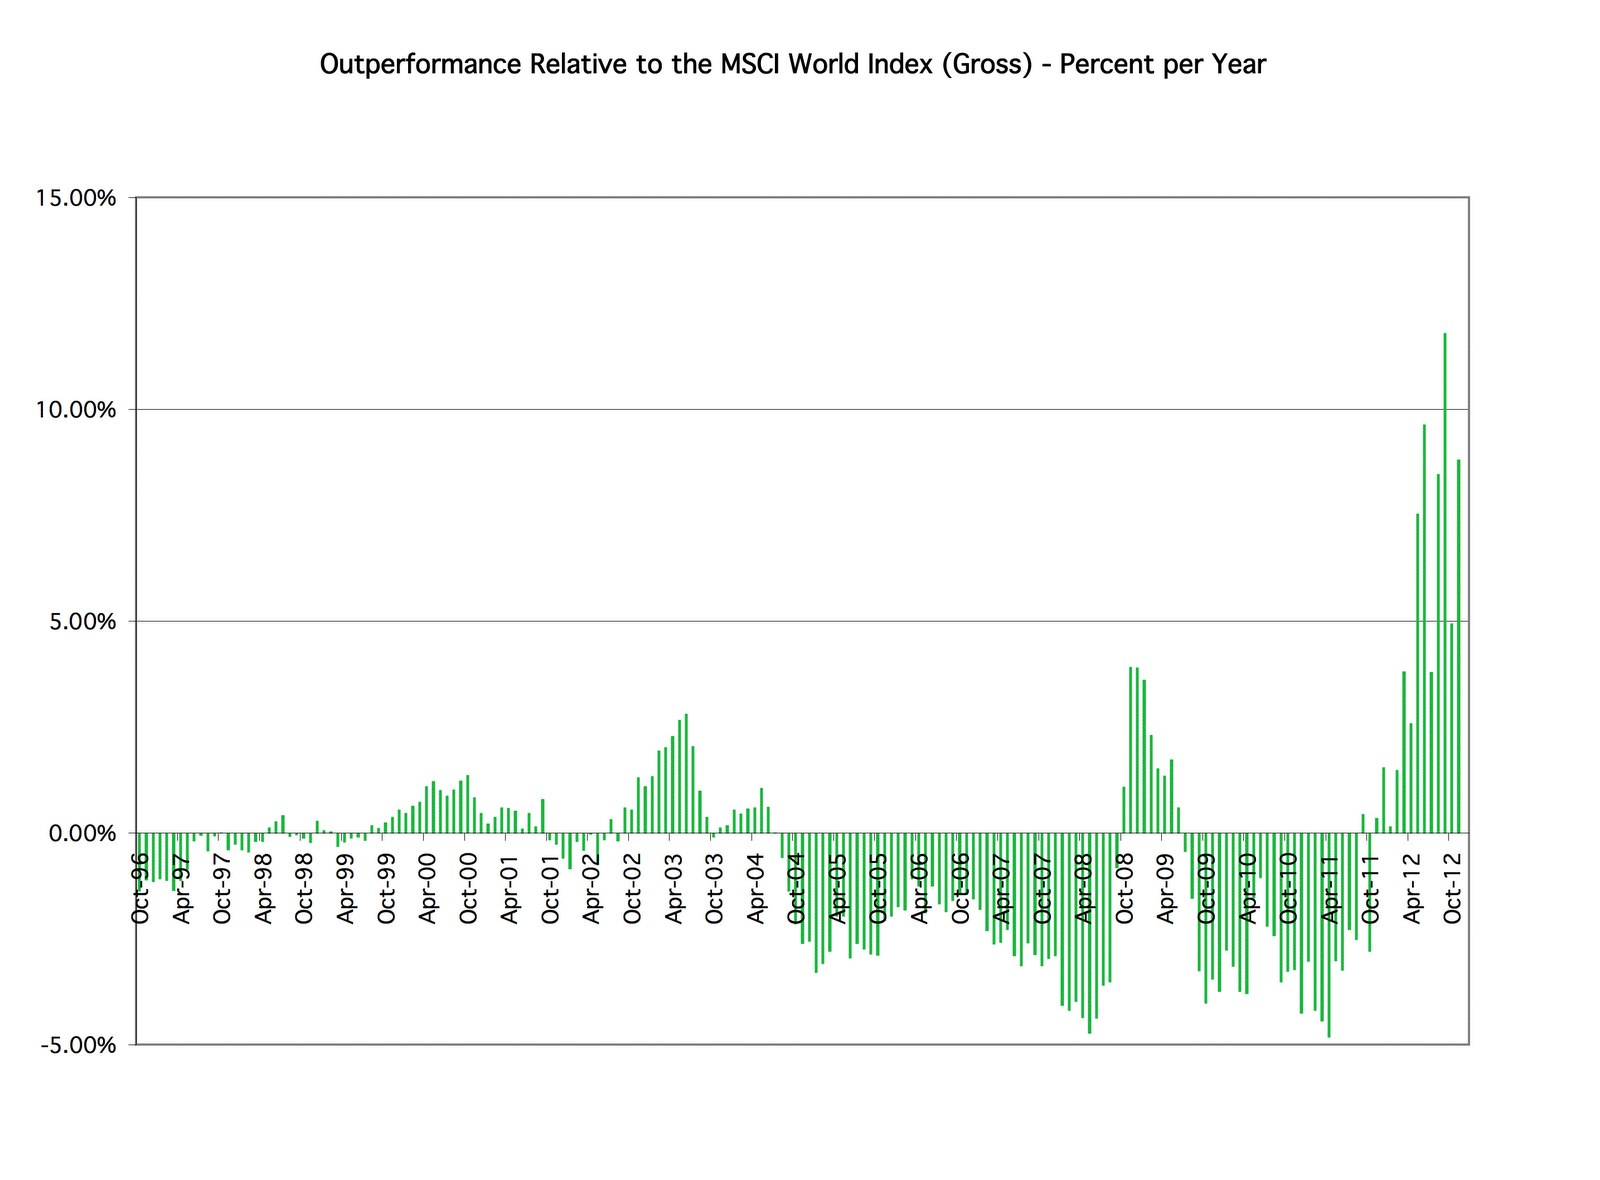
Our rate of return was 3.74% in USD terms versus 2.31% for the MSCI and 0.91% for the S&P500. In Australian Dollar terms we made 4.01%. Performance has outstripped the MSCI for the last several months:
 The graph shows the annual rate of return above the MSCI All Country World Index for money invested in the month indicated. We have had periods of both under and over performance with the differences getting smaller as we go back in time.
This month's gains were mostly due to strong gains in Australian shares but all asset classes except commodities rose. The monthly accounts (in US Dollars) look like this:
 Spending was lower than it has been recently at $,4401($A4,235). The monthly accounts show that we earned $13.4k in salaries etc. Retirement contributions were $2.4k. My employer delayed making one payment due to Christmas. Total investment returns were $27.9k with little contribution from exchange rate moves. Saving in the table is saving from non-investment income.
The house-buying fund reached $A152k, so we have reached our goal.
Our rate of return was 3.74% in USD terms versus 2.31% for the MSCI and 0.91% for the S&P500. In Australian Dollar terms we made 4.01%. Performance has outstripped the MSCI for the last several months:
This month's gains were mostly due to strong gains in Australian shares but all asset classes except commodities rose. The monthly accounts (in US Dollars) look like this:

The house-buying fund reached $A152k, so we have reached our goal.
Sunday, December 09, 2012
Adjusting Savings Plan
We pretty much achieved our goal of accumulating $A150k in cash to buy a house:
 Now it's time to adjust savings plans again. For the moment I'll use savings to pay down the margin loan of $A35k that we took to start the fund off. I also just withdrew Snork Maiden's investment in the Acadian Long Short Fund as it has been an underperformer and a quick evaluation of returns shows that despite owning seven different funds in her account there only seem to be three main sources of return: Australian stocks, international stocks, property. I'll submit a new regular savings plan for her managed funds (mutual funds) account soon to replace the current one.

Monday, December 03, 2012
Moominvalley November 2012 Report
This was the 5th month of positive investment returns. We hit new net worth highs in both Australian and US Dollar terms of $A716k (+$A15k) and $US747k (+20k). The Australian Dollar was fairly stable.
Our rate of return was 1.18% in USD terms versus 1.33% for the MSCI and 0.58% for the S&P500. In Australian Dollar terms we made 0.64%. This is mostly due to strong gains in large cap Australian shares, hedge funds, and private equity in that order. Private equity had the largest percentage gain due to the distribution from IPE. Looking at longer term performance we have about matched the market year to date - 14.54% vs. 14.16% for the MSCI. Over 1-5 years we have lagged the world stock markets. Over 10 years though we are doing very well. This chart shows the averaeg annual rate of return over a decade:

The monthly accounts (in US Dollars) look like this:

Spending was around recent averages - $5,466 ($A5,242). The monthly accounts show that we earned $13.6k in salaries etc. Retirement contributions were $3.3k. Total investment returns were $8.6k with about equal amounts from exchange rate moves and core investment returns. The house-buying fund reached $A144k. The goal of $A150k should be reached at the end of next month.
Sunday, December 02, 2012
Million Dollars
No, we haven't reached millionaire status yet but gross underlying assets do now exceed a million US Dollars:

This is gross assets before deducting loans counting both loans we owe and those owed by leveraged funds we own. I use this total asset data as the best way of tracking the composition of our portfolio.
Saturday, January 03, 2009
Goals for 2009
Unlike previous years I'm not going to set any quantitative financial goals for this year as there is too much uncertainty. On the investment management side I would like to:
1. Improve alpha to return to positive numbers or a more positive number depending on which method you use to estimate it.
2. Continue to progress towards a long-term asset allocation that is more like an endowment fund approach as the markets permit.
The major goal though is to get a decent job (3). In any case, I want to (4) continue the progress I've made on getting my academic research back on track (I now have 3 papers I've submitted for review). At the end of the year some should be accepted for publication and I should have that number under review again. If I can (5) make some progress on the business front of trying to do something with my trading models that would be good too. And finally (6) I want to lose some weight. Trying to eat better and get more exercise via cycling etc. will be the methods.
Six goals is plenty I think :)
Friday, October 10, 2008
Update

As you can see, I removed all the goals from the sidebar. We are so far from them there is little point in tracking them. When I went into the market earlier in the year when it was down 20% in the US and 25% in Australia, I figured there might be 10% downside from there and I was prepared to handle it. Now the market is down 40% from the peak, so I miscalculated. At this point we are very battered by the market but can still survive. I'll report on September together with October. It's going to be interesting after the second severe bear market in a decade whether a lot of the proponents of indexing into stocks, and mostly US stocks change their tune. I know that I will be a lot more cautious in investing in the future after being mauled twice by bear markets. I'm not going to go to the opposite extreme of what I've been doing though, rather making sure I am diversified and not using much leverage.
I also removed the word "trader" from my profile. It's time to get back to my previous career and investing patiently for the long-term. Some people can be highly successful traders. I'm not one of them.
Sunday, July 13, 2008
June 2008 Report
This was the worst month since the 2000-02 bear market performancewise and in terms of absolute dollar loss of net worth the worst ever.

The MSCI index matched its January performance (-8.18%), but this time we underperformed the market on a risk-adjusted basis. In the chart, month's above the red line have risk adjusted excess returns, while those above the blue line have above average risk adjusted returns:

And July is not shaping up very well either yet. (Lack of) progress on meeting our annual goals is assessed in the first part of this report. Other statistics appear towards the end of the report. All amounts are in U.S. Dollars unless otherwise stated.
1. Net Worth Goal: Reaching $505k In US Dollars we fell back $48,878 to $433,409, while in Australian Dollars we lost $A51,751 to decline to $A453,262. We are down on the year so progress on this goal is very negative. I'm lowering the goal again to $500,000.
2. Alpha Goal: Alpha of 8.5% The point of this goal is to earn at least an average wage from risk-adjusted excess returns. Using my preferred time-series method our returns had a beta of 1.12 and an alpha of 7.02% with respect to the MSCI World index, which lags our annual goal. The risk adjusted excess return for June based on this analysis was -1.05%. Multiplying this by net worth gives a loss of $4,814. For the year so far the risk-adjusted excess return in dollar terms has been $21,508. Using the estimate of alpha the smoothed annual income is $32,129. In Australian Dollars terms returns are somewhat lower, while they are higher using the S&P 500 as a benchmark.
3. Increasing Non-Retirement Net Worth by More than the MSCI Index The point of this goal is to make sure that we only spend out of non-investment income and excess returns and don't use the normal market return on investments to fund spending. In other words, this makes sure we have positive saving. So far this year these accounts have grown by 1.97% in excess of the MSCI return.
4. Achieving Break-Even on U.S. Taxable Accounts After reaching this goal in May we fell back steeply this month. At the end of the month we were $8,861 below the breakeven point with a loss of $9,613 for the month. The rate of return on these accounts was -11.39%.
5. Make at Least $15,000 from Trading Realised gains this month were $231 and so far this year $3,873. I've now had five positive months in a row, which is a record. I doubt July will be positive. I'm lowering the goal to $10,000.
Background Statistics
Income and Expenditure

Investment Performance
Investment return in US Dollars was -10.24% vs. a 8.18% loss in the MSCI (Gross) All Country World Index, which I use as my overall benchmark and a 8.43% loss in the S&P 500 total return index. Returns in Australian Dollars and currency neutral terms were almost identical as the AUD hardly moved over the month. So far this year we have lost 5.43%, while the MSCI and S&P 500 have lost 10.41% and 11.91%, respectively. Over the last 12 months we lost 5.18% while the MSCI lost 8.79% and the SPX 13.12%.
Asset Allocation
Allocation was 43% in "passive alpha", 69% in "beta", 4% allocated to trading, 10% to industrial stocks, 6% to liquidity, 3% to other assets and we were borrowing 35%. Our currency exposures were roughly 57% Australian Dollar, 20% US Dollar, and 23% Other and Global. In terms of asset classes, the distribution was:

Due to the use of leveraged funds, our actual exposure to stocks was 119% of net worth.
Subscribe to:
Posts (Atom)