Regal Funds Management plans to float a hedge fund LIC (closed end fund) on the ASX in March or April next year. Regal was on my future potential investments list but you need to be a certified wholesale investor to invest in their existing hedge funds. I might qualify next year, but investing via the stock exchange would be a lot less hassle assuming I could get in at a reasonable price.
The Hearts and Minds LIC started trading today and is trading above the IPO price. I topped up the allocation that I got in the IPO to the number of shares I originally wanted to invest in. I don't classify this as a hedge fund, as they are not planning to take short positions and there are no performance fees. Actually, there are no management fees. Instead 1.5% of NAV will be donated to charity each year.
Wednesday, November 14, 2018
Sunday, November 11, 2018
Got Online Access to My US Bank Account
I couldn't get online access to my account at Keybank because they required a US phone number as a security measure. This meant I also couldn't transfer money between Keybank and Interactive Brokers. So, I now bought a US phone number through Skype! I now have access to my account (my old password and username from First Niagara still work, and I managed to initiate a transfer of money to Interactive Brokers. Have to wait and see if it really works, though.
Saturday, November 10, 2018
Private Equity and Venture Capital Indices
I commented that I didn't have a good proxy for private equity and venture capital. So, I went and found one and came up with these indices from DSC Quantitative Group. What they do is regress a quarterly indices of private equity buyout and venture capital funds from Thomson Reuters on various sector indices of listed stocks. They update these weights each time Thomson Reuters produce a new number. Because they are using listed stock indices as proxies they can then produce a daily index for private equity. The fit of the proxy to the underlying index is not too bad. This is for venture capital:

The biggest deviation is during the financial crisis - unlisted private equity fell by more than the proxy index had predicted. When we compare the proxy to the NASDAQ total return index, it looks superficially like a leveraged version of the index:

When I regress it on monthly NASDAQ total return index data for 2008 to 2018, I get a beta of 1.15 and annual alpha of 6%. This suggests that venture capitalists add value by rotating the sectors that they invest in over time and it's not just about leverage:

Alpha is given by the intercept of 0.4% per month. I didn't do the proper CAPM regression where you are supposed to deduct risk free returns from the two returns series first. Given the volatility here and low risk free rates since 2008, I doubt it would make much difference.
Interestingly, the Cambridge VC index estimates much lower returns, close to the returns of the NASDAQ index itself.
You could do all this analysis for the buyout private equity index too. You'd want to regress that on the S&P 500 total return index instead.
Thursday, November 08, 2018
Target Portfoilo Performance
In October the target portfolio lost 2.83% in Australian Dollar terms. In USD terms the model portfolio lost 3.43%. This model portfolio doesn't include a proxy for private equity, as I don't know a good one. The ASX lost 6.04%. It was hard not to lose money last month. In the last 10 years the model portfolio returned 8.63% p.a. vs. 11.54% including franking credits for the ASX. In the longer term though the target portfolio ("composite") has about matched the returns on Australian shares with lower volatility:

So it's not that necessary to leverage the portfolio to get good returns. The chart shows returns in Australian Dollar terms though bond and real estate are US dollar returns to two TIAA funds invested in those sectors.

So it's not that necessary to leverage the portfolio to get good returns. The chart shows returns in Australian Dollar terms though bond and real estate are US dollar returns to two TIAA funds invested in those sectors.
Wednesday, November 07, 2018
Model Performed Badly Since I Stopped Trading
Since I decided to temporarily stop trading the model has performed badly losing about 9% while the NASDAQ 100 index is down about 4%. It still gained 5% for October overall while the index was down 8.7%. I gained 18% on capital invested due to leverage. It's good I stopped trading when I did.
Saturday, November 03, 2018
October 2018 Report
As I'm sure you know, this month was very volatile, which is good for trading but not for the performance of investments generally. This was a good test of our overall strategy, except that I abandoned trading after 17 October when I found the model was overfitted (and I also got ill with flu/pneumonia or something for the rest of the month). At the end of the month we received the grant of probate and so I am now adding in the inherited assets (cash and half an apartment) from the end of this month. This will suppress returns on both the upside and downside in the near future but doesn't affect the numbers for this month.
The Australian Dollar fell from USD 0.7228 to USD 0.7083. The MSCI World Index fell 7.47% and the S&P 500 fell 6.84%. The ASX 200 fell 6.04%. All these are total returns including dividends. We lost 5.30% in Australian Dollar terms and 7.20% in US Dollar terms. So, we outperformed both Australian and international markets.
Because of the high volatility this month here is a detailed report on the performance of all investments and asset classes:

The table also shows the shares of these investments in our post-inheritance portfolio. Futures contracts are at the bottom. It doesn't make sense to compute shares or rates of return for those. Yeas, we lost a total of AUD 117k, which is our worst ever monthly result in absolute dollars. Things that worked quite well in this market crash:
The following is table of investment performance statistics computed over the last 60 months (extended from 36 months previously) of data:

The first two rows gives the annual rate of return and Sharpe ratio for our investment performance in US dollars and Australian dollars. The other statistics are in comparison to the two indices. Based on beta, compared to the MSCI World Index we seem to be slightly geared, while compared to the Australian index we are less sensitive to market movements. We have a positive alpha compared to the Australian and a negative alpha compared to world markets. We capture more of the up movements and less of the down movements in the Australian market and the reverse in the international markets. The fall in the Australian Dollar over this period explains the poor performance compared to international benchmarks. The rate of return in USD terms is just horrible. US markets have been super strong over this period compared to the rest of the world.
We actually moved away from the new long-run asset allocation in quite a dramatic way with the infusion of cash:

Total leverage includes borrowing inside leveraged (geared) mutual (managed) funds. The allocation is according to total assets including the true exposure in leveraged funds. All asset classes apart from cash and real estate fell as I added the inherited assets. My share of the inherited apartment is about 6% of net worth. Australian large cap fell by more as I switched out of the CFS Geared Share Fund just before the market correction got going. Hedge funds were boosted by the addition of Tribeca (TGF.AX), which started trading on the ASX and Pershing Square Holdings, which I made a new investment in.
We also invest AUD 2k monthly in a set of managed funds, and there are also retirement contributions. Then there are distributions from funds and dividends.
The Australian Dollar fell from USD 0.7228 to USD 0.7083. The MSCI World Index fell 7.47% and the S&P 500 fell 6.84%. The ASX 200 fell 6.04%. All these are total returns including dividends. We lost 5.30% in Australian Dollar terms and 7.20% in US Dollar terms. So, we outperformed both Australian and international markets.
Because of the high volatility this month here is a detailed report on the performance of all investments and asset classes:

The table also shows the shares of these investments in our post-inheritance portfolio. Futures contracts are at the bottom. It doesn't make sense to compute shares or rates of return for those. Yeas, we lost a total of AUD 117k, which is our worst ever monthly result in absolute dollars. Things that worked quite well in this market crash:
- PSSAP Superannuation fund - this fell very little, by contrast with Unisuper, which surprised me.
- International hedge funds: Platinum, Tribeca, and Pershing, each did fairly well in relative terms. We should invest fully in these (12.5% is allocated to them in the model portfolio and 10% to Australian hedge funds).
- Futures: Our own futures trading worked perfectly until I stopped and Winton's downside was not too bad (better than in February), but still not performing with zero or negative correlation to equity markets. Gold rose (will be a priority to invest in it). We need to get trading working, but it will take me a lot of time to do the needed research.
- Real estate, CFS Diversified Fund etc all had more limited downside as we'd expect (estimated return for CFS Conservative Fund was negatively affected by trading).
- Cadence Capital, which fits in the (mostly) Australian hedge fund category, fell sharply.
- China Fund - this isn't surprising given the supposed drivers of the market correction.
- Yellow Brick Road - I should have sold out of this when the Mercantile offer terminated
The following is table of investment performance statistics computed over the last 60 months (extended from 36 months previously) of data:

This month I made USD 6k trading futures. This is the second best result to date and occurred as the NDX declined for the month. As I stopped trading partway through the month, I won't post the usual comparison of market, model, and my own performance. There seems to be potential here, but we need a system that is robust to different market conditions.
We actually moved away from the new long-run asset allocation in quite a dramatic way with the infusion of cash:

We also invest AUD 2k monthly in a set of managed funds, and there are also retirement contributions. Then there are distributions from funds and dividends.
Wednesday, October 24, 2018
Hearts and Minds IPO Oversubscribed?
I just got an email with my allocation of shares in this IPO. It's 82% of what I requested and the settlement dates and first trading date have been brought forward. So looks like the IPO is oversubscribed and closing early.
Friday, October 19, 2018
Overfitted
When I started trying to backtest the model with my new program the performance was bad, worse than I expected and worse than backtests I'd done previously. Recent changes to the model seem to have overfit it to the recent data. Therefore, we can't rely on the model going forward. This will need thorough investigation and in the mean time I'll stop trading.
Wednesday, October 17, 2018
Hearts and Minds IPO
Another Australian IPO of a listed investment company (closed end fund). This one has a twist – there are no management fees and the directors have waived their fees too. Instead of receiving a fee, the managers will donate 1.5% of NAV each year to charity. The board of directors include local investing luminaries like Geoff Wilson and a long list of wealthy Australian families (such as the Lowy family) have agreed to make investments in the fund.
The fund is a long only fund investing in Australian and international stocks. Each year several Australian investment managers present at the Sohn Hearts and Minds conference their best investment picks for the coming year. 40% of the fund will be allocated to these picks. 60% will be allocated to "high conviction ideas" from a number of other "core" investment managers. In total the fund will invest in about 25 securities.
The picks from the last two conferences have done very well:
 One of the core investment managers is Regal, whose hedge funds have done extremely well.
In summary, I think this looks like being another good investment opportunity.
The fund is a long only fund investing in Australian and international stocks. Each year several Australian investment managers present at the Sohn Hearts and Minds conference their best investment picks for the coming year. 40% of the fund will be allocated to these picks. 60% will be allocated to "high conviction ideas" from a number of other "core" investment managers. In total the fund will invest in about 25 securities.
The picks from the last two conferences have done very well:
In summary, I think this looks like being another good investment opportunity.
Results for the S&P 500

Alpha 0.47948 Beta -0.22355 ror 0.46115 Sharpe 2.62376
Again these are annualized values. Annualized rate of return is 46% for this year.
P.S.
I've now written all the code including stops for NQ and ES. Stops only detract a little from performance for ES but quite a bit for NQ. This suggests that we should use wider initial stops, just to avoid catastrophe, rather than to get out of ordinary bad trades.
Tuesday, October 16, 2018
More Progress on Programming the Trading Model

5082 7637.43018 1.00000 0.00000 D buy. Stay long
5083 7490.00000 0.00000 0.00000 K sell. Go short
5084 7399.00977 0.00000 0.00000 K sell. Stay short
5085 7352.81982 0.00000 0.00000 K sell. Stay short
5086 7371.62012 0.00000 0.00000 K sell. Stay short
5087 7044.50000 0.00000 0.00000 D sell. Stay short
5088 6964.02978 0.00000 1.00000 R buy not confirmed by pdD D sell. Stay short
5089 7157.20996 1.00000 1.00000 R Buy outside BB confirmed by pdD
5090 7068.67041 1.00000 1.00000 R Buy outside BB confirmed by pdD
5091 NA 1.00000 1.00000 R Buy outside BB confirmed by pdD
These are the most recent decisions, including today's decision to stay long. The "NA" indicates that we don't yet know the index value for today...
It also produces some performance statistics:
Alpha 1.76456 Beta -0.21425 ror 1.68344 Sharpe 5.47108
That means 176% p.a. of alpha... This is based on compounding the daily alpha over the year. Beta to the market is slightly negative and so compound rate of return for the year is a little less than alpha. I don't expect that high rates of return in other years. Conditions are ideal this year and probably the model is a bit overfitted. One of the reasons for doing this programming is to make it easier to test the model on larger samples.
Next I will add some refinements like using futures prices instead of index prices for performance results. Oh yes, and adding stops!
P.S.
When I ran the algorithm on the S&P 500, I found at least one bug which also needs ironing out.
Firetrail Cancels IPO
I looked at the prospectus but decided not to invest. Apparently they got more than the minimum funds raised but claim that there aren't enough different shareholders...
Dear Moom,
After careful consideration Firetrail Absolute Return Limited (Company) (in consultation with Firetrail Investments Pty Limited (Firetrail)) has made the decision, in the best interest of investors, to withdraw the initial public offering for ordinary shares in the Company (Offer) which was scheduled to close this Friday, 19 October 2018.
The Company made the decision to withdraw the Offer (in consultation with Firetrail) as it was in the best interests of investors to do so given liquidity concerns, in particular the concentration of the shareholder base. Listed Investment Companies (LICs) that do not have a well-diversified shareholder base are generally at a higher risk of the share price trading at a discount to the company’s net tangible assets. As such, we believe it was in the best interests of shareholders to withdraw the Offer, despite raising in excess of the minimum investment amount.
Investors that would like to gain access to the strategy are still able to do so through the Firetrail Absolute Return Fund which is still open to investors and has delivered strongly during the recent market volatility over the past week. Since Monday 8 October 2018, the share market has fallen over -4%1. The Firetrail Absolute Return Fund has delivered a positive return of approximately +1.3% over the same period, highlighting the benefit of the strategy which aims to deliver positive absolute returns above the RBA Cash Rate, independent of movements in the underlying share market.
Please contact us if you would like more information on investing in the Fund.
Kind regards,
Firetrail Investments
Firetrail Absolute Return Limited withdraws listed investment company IPO offer
Tuesday 16 October 2018Dear Moom,
After careful consideration Firetrail Absolute Return Limited (Company) (in consultation with Firetrail Investments Pty Limited (Firetrail)) has made the decision, in the best interest of investors, to withdraw the initial public offering for ordinary shares in the Company (Offer) which was scheduled to close this Friday, 19 October 2018.
The Company made the decision to withdraw the Offer (in consultation with Firetrail) as it was in the best interests of investors to do so given liquidity concerns, in particular the concentration of the shareholder base. Listed Investment Companies (LICs) that do not have a well-diversified shareholder base are generally at a higher risk of the share price trading at a discount to the company’s net tangible assets. As such, we believe it was in the best interests of shareholders to withdraw the Offer, despite raising in excess of the minimum investment amount.
Investors that would like to gain access to the strategy are still able to do so through the Firetrail Absolute Return Fund which is still open to investors and has delivered strongly during the recent market volatility over the past week. Since Monday 8 October 2018, the share market has fallen over -4%1. The Firetrail Absolute Return Fund has delivered a positive return of approximately +1.3% over the same period, highlighting the benefit of the strategy which aims to deliver positive absolute returns above the RBA Cash Rate, independent of movements in the underlying share market.
Please contact us if you would like more information on investing in the Fund.
Kind regards,
Firetrail Investments
Sunday, October 14, 2018
NQ Equity Curve
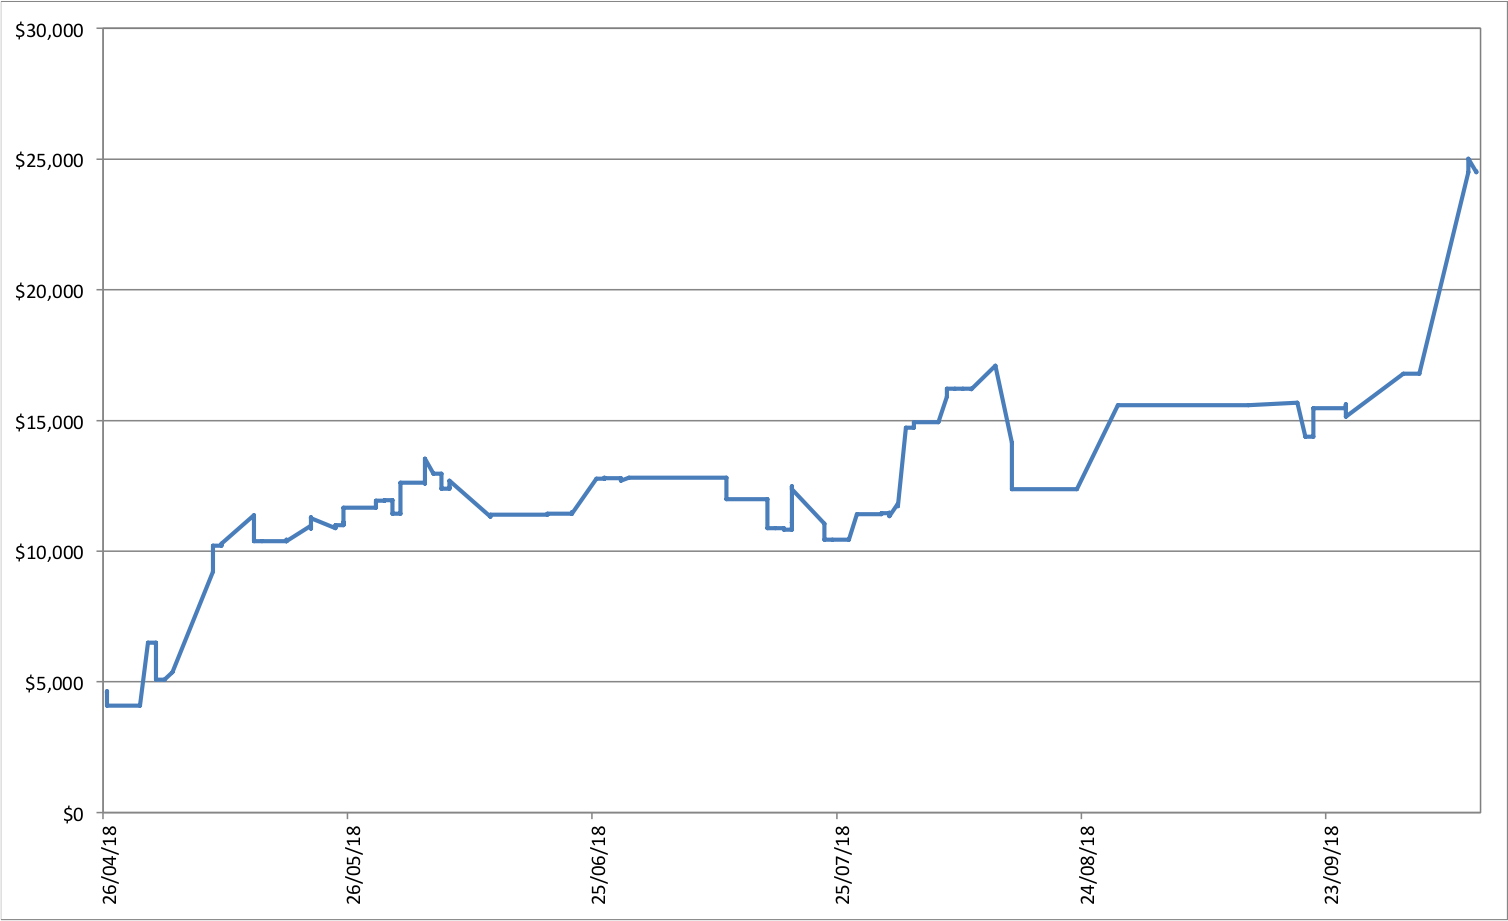
This is the equity curve trading NQ futures since the beginning of the trading experiment. It starts at about USD 4k because that was the cumulative profit for 2006-8. This isn't our total trading performance because I've also traded other things like ES futures and earned a little interest.
The little tick down at the end is the "bad trade", which wasn't so bad in the end, but that was mostly luck.
I've done a bit more programming and now the program produces a coherent list of trades, one for each day. But I've only written up part of the system yet, so you wouldn't want to actually trade them :) In fact, here is the fractional gain (i.e. 0.15 is 15% gain, not compounded) if you traded "the strategy" for this year:

In other words, it breaks even in the end, which is what you'd probably expect for a random set of trades. This kind of thing is now easy to produce, which is one of the main things this is all about.
To explain this curve, the model starts at long on 4th January and some of the code is written for what to do if you are long - it might tell you to switch to short, but not much code is written yet for what you should do if you are short. So there is little code to flip you back to long again. As a result the model is stuck on short for much of the time...
Saturday, October 13, 2018
Started to Code the Decision Tree
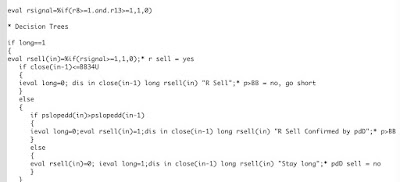
After a couple of hours of coding and debugging I got the first little bit of the model decision tree to work and spit out buy and sell decisions. The output looks like this:
4895 6584.58008 1 0.00000 Stay long
4896 6653.29004 0 1.00000 R Sell Confirmed by pdD
4897 6676.62988 0 1.00000 Go long
4898 6677.93994 0 0.00000 Stay short
4899 6662.66016 0 0.00000 Stay short
4900 6708.49023 0 0.00000 Stay short
As the decision tree is far from complete, only the first two orders – long and then short – make any sense. The first number is a code for the date, the second is the closing value of the NASDAQ 100 index on the previous day (so that it's easier for me to work out where I am than the obscure date codes). Then there are codes for buy and sell and then a verbal description of the decision and why it was taken.
Luckily, writing computer code is a core practical skill for professional economists (or you should have these skills if you don't!) we took programming courses as part of our first year undergrad study.
Should Have Done the Long Trade
Market went up strongly. Model is still long for Monday. But I'm still not in. I needed to take a break from trading. This is why I need an automated system.
Friday, October 12, 2018
Rescued the Bad Trade
I stayed up and closed at 7119.75 the bad trade where I went long at NQ = 7145. So in the end I only lost USD 500 on that trade and am still up more than USD 6k for the month. If I exactly followed the model, though, I would be up USD 13k! The model is now switching to long for Friday, but this trade is based on the adjustment I made for the 1987 crash (picture below from 1987) and doesn't have a lot of statistical support. So, this is a high risk trade and I think I will wait it out. Yeah, I'm not doing what the model says to do but at least I am not trading against it!

In other news, the Tribeca fund (TGF) starts trading on the ASX today . They only sold 63 million shares in the IPO out of a maximum of 120 million, which is a bit disappointing. Maybe, my thesis that it would trade above NAV will take a while to work out. My entry point into Pershing Square was really bad - lost around 4% already on it. I also did a trade yesterday to switch back AUD 20k from CFS Conservative Fund to CFS Geared Share Fund. ASX SPI futures are off 47 points but CME NQ futures bounced after the New York close and the model is switching to long, so hopefully my timing wasn't too bad.

In other news, the Tribeca fund (TGF) starts trading on the ASX today . They only sold 63 million shares in the IPO out of a maximum of 120 million, which is a bit disappointing. Maybe, my thesis that it would trade above NAV will take a while to work out. My entry point into Pershing Square was really bad - lost around 4% already on it. I also did a trade yesterday to switch back AUD 20k from CFS Conservative Fund to CFS Geared Share Fund. ASX SPI futures are off 47 points but CME NQ futures bounced after the New York close and the model is switching to long, so hopefully my timing wasn't too bad.
Subscribe to:
Posts (Atom)