Tuesday, November 14, 2023

Scammed

I just got scammed for AUD 2,300. I got an email from my webhosting company saying that my card had expired and I needed to renew. Except it wasn't actually from them. Instead of an AUD 100 or so fee, somebody called HalalBooking London charged me AUD 2,381. Now looking at the original email, I see it came from info@thelabhaus.com rather than Crazy Domains. I contacted Commonwealth Bank and they will try to recover the money and I cancelled my debit card. The email looked perfect apart from the email address. I had thought that if a payment was still pending they could always cancel it. Apparently not true. Instead, the bank won't do anything until the payment is no longer pending and only then will they try to reverse it!

Based on this, it seems that there is very little protection against getting scammed here in Australia compared to in the US.

HalalBooking London actually is a website where supposedly you can book Muslim friendly hotels in London. I am guessing it is actually someone else using that name for added confusion value. I contacted the website and asked them to reverse the charge if it is them or be aware that scammers are using their name. I also informed Crazy Domains about the scam.

In other news, Moominmama's friend who bought a knockdown and rebuild property in one of the most expensive suburbs of our city is now asking whether we have a spare AUD 170k we can lend them. Because of the increase in interest rates their bank has reduced the amount they are willing to lend against their existing house. I can't give specific advice without a lot more detail, but seems to me that they are likely going to have to sell their existing house ASAP if they don't want to end up reselling the property they bought. My guess is that the RBA is still going to raise rates more at this point.

P.S.

According to ChatGPT, if I cancelled my debit card while the transaction was still pending the scammer won't be able to complete processing the transaction. This makes sense, but I am a bit dubious as Commonwealth Bank asked me if I wanted to cancel the card to prevent them getting more money rather than to stop them getting this amount. CrazyDomains said I should report it to the police. I already have reported it to ACCC.

P.P.S. 15 November

I got a response from HalalBooking. They said that someone did make a booking via their site for this amount and they detected it as a fraud and refunded it. They said that there is a security vulnerability in the bank's software that was exploited. So, this is looking like there will be a positive outcome.

P.P.P.S. 17 November

Good news - the money has been refunded to our account. I don't know whether this would have happened anyway or it is because I cancelled my card quickly or because I contacted HalalBooking.

P.P.P.P.S 4 December

I found, when compiling the monthly accounts for November, that did have to pay an AUD 70 fee for the international transaction!


Monday, October 30, 2023

Reducing Gas and Electricity Bills

Today I received new format gas and electricity bills from ACTEWAGL which include a notice on the front page that we can reduce our bills by a total of AUD 558 per year by switching to the Direct Saver Plan. I am now doing that. This seems to just be straight up price discrimination, like the higher mortgage rates I used to pay.

Friday, October 27, 2023

Second Australian Unity Merger Plan Scuttled

Australian Unity and Cromwell announce that their fund merger plan is cancelled. I wasn't very enthusiastic about the merger and so am happy it has been called off. Cromwell's fund only included offices, so while the deal was diversifying for Cromwell unitholders it was not so for Australian Unity unitholders. I invested in the fund to get diversified property exposure, not just offices.

Saturday, October 21, 2023

Moominmama's Taxes 2022-23

I also did Moominmama's taxes for this financial year. The post about last year's taxes is here. Here is a summary of her tax return for this year:

Her salary was up only 3% this year. Gross income was down 2%, though there were some big fluctuations across categories. Australian dividends rose quite strongly, which is something of a trend...

Total deductions rose by 46%, mainly because of increased interest costs. As a result, net income fell 27%. 

Gross tax applies the tax bracket rates to taxable income. This was more than offset by franking credits. So, she gets the franking credits refunded as cash and has a negative tax rate. As a result, she should get a large refund.

Moominpapa's 2022-23 Taxes

This year, I've prepared our tax returns just before the deadline. Here is a summary of my taxes. Last year's taxes are here. To make things clearer, I reclassify a few items compared to the actual tax form. Of course, everything is in Australian Dollars. 

Overall, gross income and deductions barely changed from last year, falling by 1% each.

On the income side, Australian dividends and franked distributions from managed funds are again up strongly. My salary still dominates my income sources but again only increased by 3%. 

Other income sources are down strongly, partly because I shifted the assets, which produced these returns into the SMSF. Net capital gain is zero due mainly to some strategic sales to generate losses. I am carrying forward $93k in capital losses.

Deductions fell 47% because last year they included the loss on Virgin Australia bonds. I redistributed deductions a bit to match the size of different holdings. This resulted in some big changes in the individual categories. Didn't plan on charity falling that much...

Gross tax is computed by applying the rates in the tax table to the net income. In Australia, you don't enter the tax due in your tax return, but I like to compute it so that I know how big or small my refund will be.

Franking credits (from Australian dividends), foreign tax paid, and the Early Stage Venture Capital (ESVCLP) offset are all deducted from gross tax to arrive at the tax assessment. 

Estimated assessed tax fell because of the larger offsets this year.

I estimate that I will pay 25% of net income in tax. Tax was withheld on my salary at an average rate of 32%. I already paid $7,782 in tax installments and so estimate that I should get a refund of $8,701.

Monday, October 02, 2023

Good News from Pershing Square

The SEC finally approved the registration of Pershing Square SPARC Holdings. I bought Pershing Square Tontine Holdings (PSTH) around $23. We got $20 back when the SPAC was wound up. It's great to see that it will now be resurrected. Hopefully some good deal will come out of this. I wasn't that inspired by the Universal Music deal, which fell through, anyway. We ended up being invested in that all the same through PSH.L.

Saturday, September 09, 2023

Why I Haven't Posted a Monthly Report Recently

I haven't posted monthly reports for July or August. The reason is that the July accounts have an error of more than AUD 12k and I don't have the time or inclination to try to reconcile them at the moment. Probably this will have to wait till later in the year when my teaching is over. I focus all my teaching in the second semester so I am really busy. And I am also working on my new hobby of genealogy research, since December last year. Probably I will eventually make a post for the second half of the year as a whole with monthly investment performance figures. There is also an error of more than AUD 8k that cropped up now in the December 2022 accounts, which wasn't there before. Possibly they are related...

Anyway,  in AUD terms July is currently at 2.18% (compared to our target portfolio of 1.77%. ASX200 = 2.89%) or 3.18% in USD terms (HFRI = 1.75%, MSCI = 3.45%). So not bad.

August is at 0.05% (ASX = -0.44%, target = 0.90%). In USD terms though it was a fall of 3.62%. Stock markets were down but not that bad...

P.S.

After writing this post I realised what might be wrong with December 2022 and fixed that and June 2023. But July 2023 still has a 12,000 dollar error...

Tuesday, August 29, 2023

Nischa: Great Personal Finance Videos

I just found these great personal finance videos. I know most of this stuff, but lots (most?) of people could learn a lot from this!

Saturday, August 26, 2023

Paypal

Closed my Paypal account. Only time it ever comes up is when someone is trying to scam me. Just had someone try to charge USD 599 to me.

Tuesday, August 15, 2023

Lifetime Health Cover Loading

In Australia, if you don't get private health care when you are younger, if you finally do get it you have to pay an extra "loading". I had to pay 36% more and Moominmama 14%. But apparently that is only for ten years. The ten years is up and our premium has been reduced!

Saturday, August 12, 2023

June 2023 Report

We finally have all the investment statements and reports for the 2022-23 financial year, which means I can put together a report on our investment performance in June. In June, The MSCI World Index (USD gross) rose 5.85%, the S&P 500 rose 6.61%, and the HFRI hedge fund index gained 2.20% in USD terms. The ASX 200 rose 1.74% and the target portfolio 1.09% in AUD terms. All these are total returns including dividends. The Australian Dollar rose from USD 0.6479 to USD 0.6657. We lost 0.27% in Australian Dollar terms or gained 2.40% in US Dollar terms. So, we under-performed all benchmarks apart from the HFRI. Our hedge fund and private equity investments underperformed their benchmarks, dragging down performance relative to the target benchmark, which has a 38% weighting on these two asset classes.

Here is a report on the performance of investments by asset class:

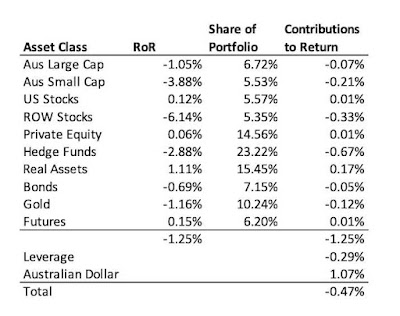
The asset class returns are in currency neutral returns as the rate of return on gross assets. I then add in the contributions of leverage and other costs and the Australian Dollar to the AUD net worth return. Gold was the biggest detractor, while futures contributed the most.

Things that worked well this month:

  • Pershing Square Holdings and Australian Dollar Futures did well.

What really didn't work: 

  • Gold and Tribeca Global Resources did badly.

The investment performance statistics for the last five years are not looking good and I don't feel like reporting them. 😕

We are now very close to our target allocation. Our actual allocation currently looks like this:

About 70% of our portfolio is in what are often considered to be alternative assets: real estate, art, hedge funds, private equity, gold, and futures. A lot of these are listed investments or investments with daily, monthly, or quarterly liquidity, so our portfolio is not as illiquid as you might think.

We receive employer contributions to superannuation every two weeks. We are now contributing USD 10k each quarter to Unpopular Ventures Rolling Fund and less frequently there will be capital calls from Aura Venture Fund II. It was another quiet month. The only additional investment moves I made were:

  • I bought 500 PMGOLD.AX and 1778 CDO.AX (Cadence Opportunities Fund) shares.


Sunday, August 06, 2023

Superannuation Returns in the Long-Run

Following up from my post on how our SMSF is performing compared to our managed superannuation funds, here is how our superannuation in general has done over time:

Note that the y-axis is a log scale! Our superannuation has outperformed the MSCI index in AUD terms in the long-run. The big win was in the couple of years after 2002 when I rolled over my Unisuper fund to Colonial First State and invested in geared funds. Then I got too conservative leading up to the GFC - the flat top you can see on the red line. Superannuation returns crashed in the GFC because I got aggressive again too early. After that, we have followed the market more closely until after 2018 when we have gone into a bit more of a capital preservation mode again. This reduced the volatility in 2022 but returns in 2023 are a bit disappointing so far.

On the other hand, our non-superannuation assets had catastrophic performance up to 2009. After that, I got my act together, which eventually gave me the confidence to set up an SMSF. But you can see the value of handing control to an external manager early on.

Superannuation returns are pre-tax but after fees. My method of imputing tax paid for public superannuation funds probably exaggerates their performance a bit. These time based returns are quite different from dollar based returns. All the early volatility wasn't that important because total assets were small. Performing well now is much more important.

Enough Wealth followed up on my original post by comparing his SMSF over a longer period to a basket of industry funds.

Saturday, August 05, 2023

Superannuation Performance Update July 2023

Inspired by this article in the AFR, here is an update on how well our SMSF is doing compared to Unisuper and PSS(AP). after underperforming for a few months, it outperformed in June and July:


Looking at the longer term, it is still ahead of the two super funds:


It rode out the 2022 downturn with less "volatility". PSS(AP) actually has a slightly lower standard deviation of monthly returns but also a lower mean. As a result, the SMSF has an information ratio (Sharpe ratio with a zero return hurdle) of 1.1, while Unisuper is at 0.61 and PSS(AP) at 0.73. Relative to Unisuper, the SMSF has an annual alpha of 5.36% and a beta of 0.44 (Relative to PSS(AP): 4.61% and 0.61).

I compute all these returns pre-tax. This probably overestimates the taxes paid by Unisuper and PSS(AP), giving them a bit of an advantage. OTOH, I don't charge for my time in managing the investments.

Wednesday, July 26, 2023

Got a Call from Australian Unity

I blogged recently about the proposed merger between the Australian Unity Diversified Property Fund and a Cromwell office fund. Today, I was called by a representative who told me about the plan and timeline and asked if I had questions and whether I would support the proposal So, I told him that I understood the reasons for seeking a merger and that I thought this merger was better than previous proposal but also that I invested in the fund to get exposure to a diversified portfolio and now it was going to be a office dominated fund, a sector that's not doing too well. So, I wasn't really sure which way to vote. He sounded disappointed and said he understood my thinking...

Thursday, July 13, 2023

New Australian Unity Merger Proposal

Australian Unity Diversified Property Fun has a new merger proposal on the table following the failed merger in 2021-22. This is a merger with the unlisted Cromwell Direct Property Fund. This seems like a fair deal unlike the previous one. It has various advantages. The only downside is that the merged fund will have 70% of its assets in offices. The attraction of AUDPF was that it was truly diversified and not dominated by offices. 

I expect I will stay in the fund (there is only a limited near term opportunity to withdraw) and think about withdrawing in 2025 when a full liquidity event is promised. The main risk is that office properties are downvalued in 2024 and 2025 after the merger happens. I am seeing a decline in value in the TIAA Real Estate Fund even though only a quarter of their assets are in offices. I reduced my holdings near peak value, should have reduced them more. So, maybe I should try to withdraw some of our investment when allowed later this year...

Sunday, July 09, 2023

Spending 2022-23

For the last six years I've been putting together reports on our spending over the Australian financial year, which runs from 1 July to 30 June. This makes it easy to do a break down of gross income including taxes that's comparable to many you'll see online, though all our numbers are in Australian Dollars. At the top level we can break down total income (as reported in our tax returns plus superannuation contributions) into the following categories of spending:

The gross income for this year (bottom line) is just an estimate. It is based on the gross income we expect to report in our tax returns (before investment expenses etc) plus employer superannuation contributions. Tax includes local property tax as well as income tax and tax on superannuation contributions. Investing costs include margin interest. Mortgage interest is included in spending, while mortgage principal payments are considered as saving. Spending also includes the insurance premia paid through our superannuation. Current saving is then what is left over. This is much bigger than saving out of salaries because gross income includes investment returns reported in our tax returns. The latter number depends on capital gains reported for tax purposes, so is fairly arbitrary. Spending increased substantially, though we also expect income to hit a high though it's been fairly constant over the last five years. Graphically, it looks like this:

We break down spending into quite detailed categories. Some of these are then aggregated up into broader categories:

Our biggest spending category, if we don't count tax, is now childcare and education, which continues to trend upwards. As mentioned above, the income and tax numbers are all estimates. Commentary on each category follows:

Employer superannuation contributions: These include employer contributions (we don't do any salary sacrifice contributions) but not concessional contributions we paid to the SMSF this year.

Superannuation contributions tax: The 15% tax on concessional superannuation contributions. This includes tax on our concessional contributions to the SMSF.

Franking credits: Income reported on our tax returns includes franking credits (tax paid by companies we invest in). We need to deduct this money which we don't receive as cash but is included in gross income. Foreign tax paid is the same story.

Income tax is one category that has fallen since 2017-18!

Life and disability insurance: I have been trying to bring this under control and the amount paid has also fallen since 2017-18 a result.

Health: Includes health insurance and direct spending. Spending peaked with the birth of our second child. It is up this year because I had an operation early this calendar year.

Housing: Includes mortgage interest, maintenance, and body corporate fees (condo association). Rising interest rates have pushed up spending this year.

Transport: About half is spending on our car and half is my spending on Uber, e-scooters, buses etc.

Utilities: This includes water, gas, electricity, telephone, internet, and online storage etc.

Subscriptions: This is a new category this year, split out from utilities. It's been trending up strongly.

Supermarkets: Includes convenience stores, liquor stores etc as well as supermarkets. Seems crazy that it has almost doubled in five years and is now our third biggest spending category.

Restaurants: This was low in 2017-18 because we spent a lot of cash at restaurants. It was low in the last two years because of the pandemic but doubled this year as life got more back to normal and prices are climbing I feel particularly in this area.

Cash spending: This has collapsed to almost zero. I try not to use cash so that I can track spending. Moominmama also gets some cash out at supermarkets that is included in that category.

Department stores: All other stores selling goods that aren't supermarkets. No real trend here.

Mail order: This seems to have leveled out in the last three years and actually came down this year,

Childcare and education: We are paying for private school for one child, full time daycare for the other, plus music classes, swimming classes...

Travel: This includes flights, hotels etc. It was very high in 2017-18 when we went to Europe and Japan. In 2020-21 it was down to zero due to the pandemic and having a small child. This year we went to Sydney for a week and this is mostly how much the accommodation cost.

Charity: Not sure why this is trending down.

Other: This is mostly other services. It includes everything from haircuts to professional photography.

This year's increased spending was mainly driven by increased childcare and education costs and higher mortgage interest. I expect education to fall a little next year as private primary school is cheaper than daycare.


Monday, June 12, 2023

What I Get Out of Tracking Spending Categories

Ramit Sethi advocates only tracking about four categories of spending and is critical of couples who do more fine-grained tracking. For the last few years I have been tracking 15 top level spending categories and 27 more detailed spending categories. So, what do I get out of this. I think the following:

  • I can track which items have grown fast and maybe we should cut back on. This has resulted in saving money on car insurance, health insurance, and mortgage interest.
  • Some things that I think we are spending a lot on, and should cut back on are actually not that big. For example, our current spending on restaurants is AUD 3k per year or 1.7%. My spending on bus, Uber, taxis etc. is AUD 4.5k per year or 2.5%, which is less than half our spending on transport. These are two of my three areas of "luxury" or personal spending. The other is spending money on subscriptions online etc So, being able to see these numbers makes me feel more comfortable about my spending in these areas.
  • Perhaps some things seem small and we can consider raising them, like our spending on charity at only 0.4%.
  • Well, yes it's neat to see what we are spending money on and comparing to other people :)

Sunday, June 11, 2023

May 2023 Report

In May, markets were mixed. The MSCI World Index (USD gross) fell 1.00% while the S&P 500 rose 0.43% in USD terms. The ASX 200 fell 2.30% in AUD terms. All these are total returns including dividends. The Australian Dollar fell from USD 0.6605 to USD 0.6479. We lost 1.07% in Australian Dollar terms or lost 3.09% in US Dollar terms. The target portfolio lost 0.06% in Australian Dollar terms and the HFRI hedge fund index is expected to lose 0.12% in US Dollar terms. So, we under-performed all benchmarks apart from the ASX 200.

Here is a report on the performance of investments by asset class:

The asset class returns are in currency neutral returns as the rate of return on gross assets. I then add in the contributions of leverage and other costs and the Australian Dollar to the AUD net worth return. We underperformed the target portfolio benchmark mainly because of negative returns on hedge funds in particular. Private equity had the most positive returns and contributed most to the return for the month, while gold and futures also performed positively. Australian small caps were the worst performers.

Things that worked well this month:

  • 3i (III.L) gained the most (AUD 18k) followed by Cordish Dixon PE Fund 3 (CD3, 8k), and Winton Global Alpha (7k).

What really didn't work: 

  • Cadence Capital (CDM.AX), Regal Funds (RF1.AX), and Cadence Opportunities (CDO.AX) lost the most: AUD 18k, 13k, and 11k respectively.

The investment performance statistics for the last five years are: 

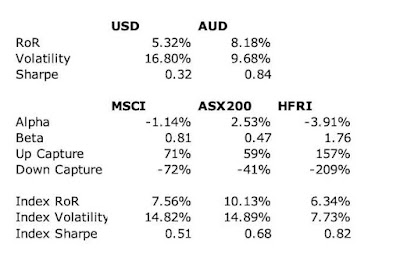
The first three rows are our unadjusted performance numbers in US and Australian dollar terms. The MSCI is reported in USD terms. The following four lines compare performance against each of the three indices over the last 60 months. The final three rows report the performance of the three indices themselves. We show the desired asymmetric capture, positive alpha, and higher Sharpe Ratio against the ASX200 but not the USD benchmarks. We are performing about 4.4% per annum worse than the average hedge fund levered 1.77 times. Hedge funds have been doing well in recently.

We are now very close to our target allocation. Our actual allocation currently looks like this:

About 70% of our portfolio is in what are often considered to be alternative assets: real estate, art, hedge funds, private equity, gold, and futures. A lot of these are listed investments or investments with daily, monthly, or quarterly liquidity, so our portfolio is not as illiquid as you might think.

We receive employer contributions to superannuation every two weeks. We are now contributing USD 10k each quarter to Unpopular Ventures Rolling Fund and less frequently there will be capital calls from Aura Venture Fund II. It was a very quiet month. The only additional investment move I made was:

  • I bought a net 250 shares of PMGOLD.AX.


Friday, June 09, 2023

Fixed My Margin Loan Interest Rate

I fixed my margin loan interest rate for the next year at 7.69% instead of a variable rate 9.15%. I am paying the interest in arrears. At the moment I can't see the RBA really cutting interest rates by an average of 1.5% over the next year. It's the first time I have done this. One reason for that is that my balance is relatively low at the moment and I expect it will increase, so I won't have the problem of early termination. I am withdrawing AUD 15k every quarter to invest in the Unpopular Ventures Rolling Fund.

Saturday, May 06, 2023

April 2023 Report

In April, stock markets continued to rise. The MSCI World Index (USD gross) rose 1.48% and the S&P 500 1.56% in USD terms, while the ASX 200 gained 2.03% in AUD terms. All these are total returns including dividends. The Australian Dollar fell from USD 0.6695 to USD 0.6605. We gained 1.09% in Australian Dollar terms but lost 0.45% in US Dollar terms. The target portfolio gained 1.98% in Australian Dollar terms and the HFRI hedge fund index is expected to gain 1.19% in US Dollar terms. So, we under-performed all benchmarks :(

Here is a report on the performance of investments by asset class:

The asset class returns are in currency neutral returns as the rate of return on gross assets. I then add in the contributions of leverage and other costs and the Australian Dollar to the AUD net worth return. We underperformed the target portfolio benchmark because of negative returns on international stocks and hedge funds, in particular. Our US stocks actually outperformed the S&P 500 this month.

Several asset classes made moderate positive contributions with private equity leading, while ROW stocks and hedge funds had negative returns

Things that worked well this month:

  • Gold was the greatest gainer at AUD 9k, but several other investments gained between AUD 6-9k including Unisuper, 3i (III.L), Hearts and Minds (HM1.AX), Regal Funds (RF1.AX), Winton Global Alpha, WAM Alternatives (WMA.AX), and PSS(AP).

What really didn't work: 

  • Tribeca Global Resources (TGF.AX) was again the biggest loser with a loss of AUD 14k. Followers up were: The China Fund (CHN, -8k) and Pershing Square Holdings (PSH.L, -6k).

The investment performance statistics for the last five years are: 

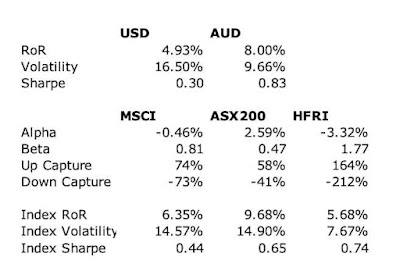
The first three rows are our unadjusted performance numbers in US and Australian dollar terms. The MSCI is reported in USD terms. The following four lines compare performance against each of the three indices over the last 60 months. The final three rows report the performance of the three indices themselves. We show the desired asymmetric capture, positive alpha, and higher Sharpe Ratio against the ASX200 but not the USD benchmarks. We are performing about 3.9% per annum worse than the average hedge fund levered 1.76 times. Hedge funds have been doing well in recently.

We are now very close to our target allocation. Our actual allocation currently looks like this:

About 70% of our portfolio is in what are often considered to be alternative assets: real estate, art, hedge funds, private equity, gold, and futures. A lot of these are listed investments or investments with daily, monthly, or quarterly liquidity, so our portfolio is not as illiquid as you might think.

We receive employer contributions to superannuation every two weeks. We are now contributing USD 10k each quarter to Unpopular Ventures Rolling Fund and less frequently there will be capital calls from Aura Venture Fund II. In addition, we made the following investment moves this month:

  • I invested USD 2,500 in a Latin-American start-up company through the Unpopular Venture Syndicate.
  • I bought 5,000 more Cordish-Dixon 3 (CD3.AX) shares.


Thursday, May 04, 2023

Moominmama's Manager Made the Whole Thing Up!

So, Moominmama talked to HR about the "voluntary redundancy". They said that there was no restructuring in progress and she would only be considered for voluntary redundancy if she literally volunteered and that basically her manager just made the whole thing up! This sounds like real incompetence or professional malpractice on his part.

Thursday, April 27, 2023

Redundancy Package

Moominmama was offered a redundancy package. Seems a bit like an offer you can't refuse. When she asked if she would be fired anyway if she rejected it, her boss told her he couldn't tell her that... We don't know the details of the package yet. Her lower level manager said that as she is only working two days a week it's hard to involve her in projects or for them to take on projects that need her skills because she doesn't work enough. But she wants to take the package and doesn't want to work more days. 

She plans to reduce the daycare days of our almost 4 year old for the second half of this year. After that he should be in full time pre-school. 

I ran a simulation and through the end of 2024 the effect is a reduction in net worth of about AUD35k before considering the value of the package and after considering the likely value of the package it is about even. After that the effect gets progressively larger, but, surprisingly, in the long run (2029 and 2044) net worth is around 2% lower than in the base case. This is in contrast to the scary numbers that we are currently spending AUD 177k per year and my after tax salary is AUD 130k.

I feel like I must have done something wrong in the simulation.

Sunday, April 09, 2023

March 2023 Report

In March, stock markets rebounded. The MSCI World Index (USD gross) rose 3.15% and the S&P 500 3.67% in USD terms, while the ASX 200 only gained 0.25% in AUD terms. All these are total returns including dividends. The Australian Dollar fell from USD 0.6740 to USD 0.6695. We gained 0.55% in Australian Dollar terms but lost 0.15% in US Dollar terms. The target portfolio gained 1.84% in Australian Dollar terms and the HFRI hedge fund index is expected to gain 1.47% in US Dollar terms. So, we only out-performed the ASX200.

Here is a report on the performance of investments by asset class:

The asset class returns are in currency neutral returns as the rate of return on gross assets. I then add in the contributions of leverage and other costs and the Australian Dollar to the AUD net worth return. We underperformed the target portfolio benchmark because of negative returns on international stocks and hedge funds as well as negative returns on Australian small caps. We lost on US stocks because of a very negative return from Hearts and Minds (HM1.AX) offsetting positive returns on other US holdings.

Gold was the main positive contributor to returns and the highest returning asset class while futures were the largest detractor and worst performing asset class. The trend-following managed futures funds got caught in the sudden movement in US bonds during the month associated with the banking crisis.

Things that worked well this month:

  • Gold gained AUD 54k - the biggest monthly gain in a single investment since I started investing.

What really didn't work: 

  • Tribeca Global Resources (TGF.AX) lost AUD 11k. Followers up were: Pershing Square Holdings (PSH.L, -10k), Aspect Diversified Futures (-9k), Hearts and Minds (HM1.AX, -9k), and Winton Global Alpha (-8k).

The investment performance statistics for the last five years are: 

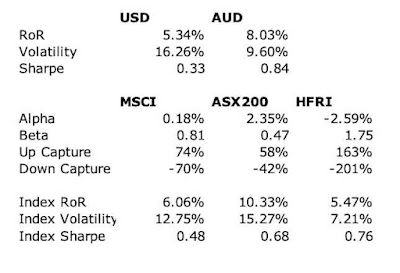
The first three rows are our unadjusted performance numbers in US and Australian dollar terms. The MSCI is reported in USD terms. The following four lines compare performance against each of the three indices over the last 60 months. The final three rows report the performance of the three indices themselves. We show the desired asymmetric capture, positive alpha, and higher Sharpe Ratio against the ASX200 but not the USD benchmarks. We are performing about 3.6% per annum worse than the average hedge fund levered 1.76 times. Hedge funds have been doing well in recently.

We are now very close to our target allocation but we mived away from it quite sharply during the month. In particular, real assets increased as we added to URF.AX and it rose, while private equity fell as we took profits in PE1.AX. Our actual allocation currently looks like this:

About 70% of our portfolio is in what are often considered to be alternative assets: real estate, art, hedge funds, private equity, gold, and futures. A lot of these are listed investments or investments with daily, monthly, or quarterly liquidity, so our portfolio is not as illiquid as you might think.

We receive employer contributions to superannuation every two weeks. We are now contributing USD 10k each quarter to Unpopular Ventures Rolling Fund and less frequently there will be capital calls from Aura Venture Fund II. In addition, we made the following investment moves this month:

  • I sold 100 China Fund (CHN) shares.
  • I sold 3,500 WAM Leaders (WLE.AX) shares.
  • I sold 10k MCP Income Opportunities (MOT.AX) when the price spiked back up to AUD 2.10.
  • I bought 12k shares net of Cordish-Dixon Private Equity Fund 3 (CD3.AX).
  • I did a losing trade in bond futures.

Friday, March 31, 2023

Comments Stuck in Moderation

I just found that a lot of comments people made in the past were stuck in moderation. I didn't know "sometimes moderation" was on. I approved all the substantive comments and turned moderation off. I apologize to everyone who commented but whose comment wasn't published up till now. I really appreciate all the comments. They made me feel less lonely on this journey.

Monday, March 27, 2023

Yield Curve Trade

 I entered a new yield curve trade - betting on a reduction in the inversion:

This executed by buying a spread that is long two year treasuries futures and short ten year treasuries futures. If we have a repeat of the late 1970s and early 1980s it will lose but inflation was much higher than now then. Last time I tried this in late 2019 to early 2020 I lost about USD 1,500. I was right but too early.

31 March

The trade went badly right from the start and it started making me more and more anxious. I didn't sleep last night and couldn't get to sleep tonight, so I closed the trade. But I still can't sleep yet. So, thought writing this update might help. I would have thought that I had learnt my lesson that I can't cope with overnight futures trades where I could decide to change the trade. It's just not something I can do. I had planned to do some more work on trading in the next few months, but now think I shouldn't do it.

Sunday, March 05, 2023

February 2022 Report

In February, stock markets fell again. The MSCI World Index (USD gross) fell 2.83% and the S&P 500 2.44% in USD terms, while the ASX 200 lost 2.25% in AUD terms. All these are total returns including dividends. The Australian Dollar fell from USD 0.7113 to USD 0.6740. We also lost money: 0.47% in Australian Dollar terms or 5.69% in US Dollar terms. The target portfolio gained 0.72% in Australian Dollar terms and the HFRI hedge fund index is expected to lose about 0.83% in US Dollar terms. So, we out-performed the ASX200 but under-performed all the other benchmarks.

Here is a report on the performance of investments by asset class:

The asset class returns are in currency neutral returns as the rate of return on gross assets. I then add in the contributions of leverage and other costs and the Australian Dollar to the AUD net worth return. One reason that we underperformed the target portfolio benchmark is the very negative returns we got for rest of world stocks and to a lesser degree hedge funds. The Australian Dollar cash price of gold was breakeven for the month, so I also don't understand why PMGOLD.AX lost value, especially as I bought some extra shares during the month at a price that was lower than the end of month price...

Real assets were the main positive contributor to returns and the highest returning asset class while hedge funds were the largest detractor.

Things that worked well this month:

  • URF.AX (US residential real estate) was the biggest gainer adding AUD 11k, followed by two managed futures funds: Winton Global Alpha (9k) and Aspect Diversified Futures (6k).

What really didn't work: 

  • Tribeca Global Resources (TGF.AX) lost AUD 30k. The next worse were the China Fund (CHN, -19k) and Australian Dollar Futures (-15k).

The investment performance statistics for the last five years are: 

The first three rows are our unadjusted performance numbers in US and Australian dollar terms. The MSCI is reported in USD terms. The following four lines compare performance against each of the three indices over the last 60 months. The final three rows report the performance of the three indices themselves. We show the desired asymmetric capture, positive alpha, and higher Sharpe Ratio against the ASX200 but not the USD benchmarks. We are performing about 3.3% per annum worse than the average hedge fund levered 1.77 times. Hedge funds have been doing well in recently.

We are now very close to our target allocation but we mived away from it quite sharply during the month. In particular, real assets increased as we added to URF.AX and it rose, while private equity fell as we took profits in PE1.AX. Our actual allocation currently looks like this:


About 70% of our portfolio is in what are often considered to be alternative assets: real estate, art, hedge funds, private equity, gold, and futures. A lot of these are listed investments or investments with daily, monthly, or quarterly liquidity, so our portfolio is not as illiquid as you might think.

We receive employer contributions to superannuation every two weeks. We are now contributing USD 10k each quarter to Unpopular Ventures Rolling Fund and less frequently there will be capital calls from Aura Venture Fund II. In addition, we made the following investment moves this month:

  • I bought 1,000 shares of the gold ETF, PMGOLD.AX.
  • I sold 4,000 shares of WAM Leaders (WLE.AX).
  • I sold 59,976 shares of Pengana Private Equity (PE1.AX).
  • I bought 29,638 shares of the Cordish-Dixon private equity fund CD3.AX.
  • I bought 25,000 shares of MCP Income Opportunities private credit fund (MOT.AX).
  • I bought 65,000 shares of URF.AX (US residential real estate).

Wednesday, March 01, 2023

January 2022 Report

In January, stock markets rebounded. The MSCI World Index (USD gross) gained 7.19% and the S&P 500 6.28% in USD terms, and the ASX 200 gained 6.23% in AUD terms. All these are total returns including dividends. The Australian Dollar rose from USD 0.6816 to USD 0.7113. We gained 2.21% in Australian Dollar terms or 6.66% in US Dollar terms. The target portfolio rose 1.45% in Australian Dollar terms and the HFRI hedge fund index around 2.8% in US Dollar terms. So, we out-performed the S&P 500, the HFRI, and our target portfolio and under-performed the others.

Here is a report on the performance of investments by asset class:

The asset class returns are in currency neutral returns as the rate of return on gross assets. I have added in the contributions of leverage and other costs and the Australian Dollar to the AUD net worth return.

All asset classes had positive returns. Private equity was the largest contributor to returns Followed by hedge funds, while RoW stocks had the highest return.

Things that worked well this month:

  • 3i (III.L) rose strongly, gaining AUD 22k. Tribeca (TGF.AX 18k), Unisuper (15k), PSSAP (14k), China Fund (CHN, 13k), and Hearts and Minds (HM1, 10k) all contributed more than AUD 10k.

What really didn't work: 

  • Three managed futures funds all lost money, with Winton Global Alpha losing the most (AUD 4k).

The investment performance statistics for the last five years are: 

The first three rows are our unadjusted performance numbers in US and Australian dollar terms. The MSCI is reported in USD terms. The following four lines compare performance against each of the three indices over the last 60 months. The final three rows report the performance of the three indices themselves. We show the desired asymmetric capture and positive alpha against the ASX200 and the MSCI but not against the hedge fund index. We have a higher Sharpe Index than the ASX200 but lower than the MSCI in USD terms. We are performing about 2.6% per annum worse than the average hedge fund levered 1.75 times. Hedge funds have been doing well in recently.

We are now very close to our target allocation. Our actual allocation currently looks like this:

About 70% of our portfolio is in what are often considered to be alternative assets: real estate, art, hedge funds, private equity, gold, and futures. A lot of these are listed investments or investments with daily, monthly, or quarterly liquidity, so our portfolio is not as illiquid as you might think.

We receive employer contributions to superannuation every two weeks. We are now contributing USD 10k each quarter to Unpopular Ventures Rolling Fund and less frequently there will be capital calls from Aura Venture Fund II. In addition, we made the following investment moves this month:

  • I bought 1,000 shares of the China Fund, CHN.
  • I bought 3,000 shares of Ruffer Investment Company, RICA.L.

Friday, February 24, 2023

New Investment or Trade

I sold some Pengana Private Equity (PE1.AX) shares as they are trading above NTA and bought some Cordish Dixon Private Equity Fund III (CD3.AX) shares, which are trading more than 30% below NTA. Of the three traded Cordish-Dixon funds, I selected this one as it is youngest and so I figured has the most potential. Maybe the oldest fund maybe has only more problematic companies left in it, which are harder to sell? It is also the biggest of the three funds because it has made fewer distributions to date.

This was spurred by news that PE1 has made offers to acquire the CD funds, though these have been rejected to date.

In other updates, I have been tied up in other projects and haven't had time to reconcile the accounts for the last couple of months. When I do, I will post reports.

Friday, February 03, 2023

Rates of Return Over 20 Years


The graph shows the average annual rate of return over the previous 20 years up to that date. Our target diversified portfolio has had a very consistent 20 year return, as has the ASX 200. The MSCI World stock market index and the S&P 500 have been less consistent. My own performance was not good up to 2020 when seen from a 20 year perspective. By January this year, though, it's almost matching the target portfolio and is near the MSCI World Index (which doesn't deduct management fees). One reason for this, is I did really badly in 2000-2003 in the dot.com crash or tech wreck and so performance is now measured from the low point of March 2023. The chart is measured in Australian Dollars.

Saturday, January 14, 2023

Annual Report 2022

Overview 
This was the first year that our net worth fell since 2008. Investment returns were negative but the value of our house increased a bit and we did save some money.* We were far short of the best case projection I made at the beginning of the year of a net worth of AUD 6.7 million. In my academic career, I spent a lot of time this year working on preparing and then teaching a new course, though I did get at least one newish research project completed. I was supposedly on long service leave for the first three months of the year but didn't really get to take any time off. This year, I plan on taking it a bit easier in the first half of the year before focusing on teaching in the second half of the year. Teaching was more in person this year and so a bit more enjoyable. I didn't leave the Canberra region all year since getting back from the coast right after New Year's Day.
 
All $ signs in this report indicate Australian Dollars. I'll do a separate report on individual investments. I do a report breaking down of spending after the end of the financial year.
 
Investment Returns 
In Australian Dollar terms we lost 3.7% for the year but in USD terms we lost 9.6% because of the fall in the Australian Dollar over the year. The MSCI lost 18.0% in USD terms but the ASX 200 gained 0.9% in AUD terms. The HFRI hedge fund index lost 1.5% in USD terms. Our target portfolio lost 4.2% in AUD terms. So, we beat the MSCI and the target portfolio benchmarks this year but not the ASX 200 or HFRI Index. 
 
This chart compares our portfolio to the benchmarks in Australian Dollar terms over the year:
 

We tracked the target portfolio quite closely. It acted as a less volatile weighted average of Australian and international equity markets. Here are the same indices in US Dollar terms with the target portfolio replaced by the HFRI hedge fund index:
 
The HFRI had very low volatility and the strongest relative performance. In USD terms, our portfolio was much more volatile than in Ausrtalian Dollar terms as intended.
 
Here are annualized returns over various standard periods:

Benchmark returns have now mostly decreased over time. We have similar performance to the ASX 200 over ten years but much worse over twenty. We beat the HFRI over all the longer time horizons. We had particularly good relative performance over the three year horizon. Whether you think our performance is good or bad depends on what you think the default alternative investment is. If it is an ASX 200 index fund, then we are doing in the last ten years. If it is a global stock index fund then not so good over horizons longer than three years. If you think it is our target portfolio then we are doing well.

Here are the investment returns and contributions of each asset class in 2022:
The contributions to return from each asset class sum to the total portfolio return in gross asset and currency neutral terms. I then add on the contributions of leverage and the Australian Dollar to get the AUD net worth return. The portfolio shares are at the beginning of the year. Futures and gold did best and contributed most to the return. Private equity and real assets had small positive returns. Australian small cap stocks and foreign equities all did very badly.

Investment Allocation 
There weren't large changes in asset allocation over the year:
 

Mainly, real assets fluctuated with our exposure to URF.AX, which is a very levered (effectively) US residential real estate fund.

Accounts
Here are our annual accounts in Australian Dollars: 
 

Percentage changes are for the total numbers. There are lots of quirks in the way I compute the accounts, which have gradually evolved over time. There is an explanation at the end of this post. 

We earned $153k after tax in salary etc. Total non-investment earnings including retirement contributions were $183k, down 9% on 2021. This was due to increased tax payments, fewer non-salary earnings, and fewer employee contributions to Moominmama's employer superannuation fund. We lost (pre-tax including unrealized capital gains) $166k on non-retirement account investments. A small amount of the gains were due to the fall in the Australian Dollar (forex). We lost $15k on retirement accounts with $30k in employer retirement contributions. The value of our house is estimated to have risen by $133k. As a result, the investment loss totaled -$45k and total income $139k.
 
Total spending (doesn't include mortgage payments) of $152k was again up 12% for the year. Spending was almost exactly equal to after-tax non-investment income. We saved just $488 from salaries etc.

$25k of the current pre-tax investment income was tax credits – we don't actually get that money so we need to deduct it to get to the change in net worth. We transferred $120k into retirement accounts the SMSF from existing savings. This included $20k as a concessional contribution for Moominmama. Therefore, looking at just saving from non-investment income, we dissaved $120k. The change in current net worth, was therefore -$306k.

Taxes on superannuation returns are just estimated because apart from tax paid by the SMSF all we get to see are the after tax returns. I estimate this tax to make retirement and non-retirement returns comparable.
The total implicit tax on supernnuation was a negative $1k because we lost money. Net worth of retirement accounts increased by $136k after the transfer from current savings.
 
Finally, total net worth fell by $37k.

Projections
Last year my baseline projection for 2022 was for a 16% rate of return, no increase in the value of our home, flat other income, and 6% growth in spending. This resulted in projected net worth increasing by $800k to around $6.7 million. Obviously, we came nowhere near this projection.
 
This year the baseline projection (best case scenario) is for an 11.2% investment rate of return in AUD terms (assuming the Australian Dollar rises to 75 US cents), inflation of 7.6% and an 11% nominal increase in spending, and about a 3% increase in other income, leading to an $550k increase in net worth to around $6.5 million or a 9% increase. This would be very little gain in real terms after inflation. But, again, anything could happen.
 
Notes to the Accounts
Current account includes everything that is not related to retirement accounts and housing account income and spending. Then the other two are fairly self-explanatory. However, property taxes etc. are included in the current account. Since we notionally converted the mortgage to an investment loan, mortgage interest is counted in current investment costs. So, the only item in the housing account now is increases or decreases in the value of our house. This simplified the accounts a lot but I still keep a lot of cells in the spreadsheet that might again be used in the future.
 
Current other income is reported after tax, while investment income is reported pre-tax. Net tax on investment income then gets subtracted from current income as our annual tax refund or extra payment gets included there. Retirement investment income gets reported pre-tax too while retirement contributions are after tax. For retirement accounts, "tax credits" is the imputed tax on investment earnings which is used to compute pre-tax earnings from the actual received amounts. For non-retirement accounts, "tax credits" are actual franking credits received on Australian dividends and the tax withheld on foreign investment income. Both of these are included in the pre-tax earning but are not actually received month to month as cash.... 
 
For current accounts "core expenditure" takes out business expenses that will be refunded by our employers and some one-off expenditures. This year, there are none of those one-off expenditures. "Saving" is the difference between "other income" net of transfers to other columns and spending in that column, while "change in net worth" also includes the investment income.
 
* Venture capital returns haven't been reported yet for the December 2022 valuation, but I don't expect them to make a big difference.

Sunday, January 08, 2023

December 2022 Report

Venture capital returns won't be reported for another month, but I expect them to be flat, so that the final numbers are not far from what they are now. In December, stock markets fell. The MSCI World Index (USD gross) lost 3.90%, the S&P 500 5.76% in USD terms, and the ASX 200 3.13% in AUD terms. All these are total returns including dividends. The Australian Dollar rose from USD 0.6788 to USD 0.6816. We lost 1.24% in Australian Dollar terms or 0.83% in US Dollar terms. The target portfolio is expected to lose 2.43% in Australian Dollar terms and the HFRI hedge fund index around 1.3% in US Dollar terms. So, we out-performed all benchmarks.

Here is a report on the performance of investments by asset class:

The asset class returns are in currency neutral returns as the rate of return on gross assets. I have added in the contributions of leverage and other costs and the Australian Dollar to the AUD net worth return.

Only gold and private equity had positive returns. Gold was the biggest contributor to returns and hedge funds the greatest detractor.

Things that worked well this month:

  • Gold gained AUD 14k and Pengana Private Equity (PE1.AX), 9k.

What really didn't work: 

  • Regal Funds (RF1.AX) lost AUD 12k followed by Hearts and Minds (HM1.AX) and Tribeca Global Resources (TGF.AX), which each lost 10k.

The investment performance statistics for the last five years are: 

The first three rows are our unadjusted performance numbers in US and Australian dollar terms. The MSCI is reported in USD terms. The following four lines compare performance against each of the three indices over the last 60 months. The final three rows report the performance of the three indices themselves. We show the desired asymmetric capture and positive alpha against the ASX200 and the MSCI but not against the hedge fund index. We have a higher Sharpe Index than the ASX200 but lower than the MSCI in USD terms. We are performing about 2.5% per annum worse than the average hedge fund levered 1.7 times. Hedge funds have been doing well in recently.

We are now very close to our target allocation. Our actual allocation currently looks like this:

About 70% of our portfolio is in what are often considered to be alternative assets: real estate, art, hedge funds, private equity, gold, and futures. A lot of these are listed investments or investments with daily, monthly, or quarterly liquidity, so our portfolio is not as illiquid as you might think.

We receive employer contributions to superannuation every two weeks. We are now contributing USD 10k each quarter to Unpopular Ventures Rolling Fund and less frequently there will be capital calls from Aura Venture Fund II. In addition, we made the following investment moves this month:

  • I bought 1,000 shares of PMGOLD.AX.
  • I tried to do a trade with around 12k shares of Regal Funds (RF1.AX). It wasn't successful.
  • I closed a tiny position of WLS.AX shares pending the merger of WLS into WCMQ.AX.
  • The remainder of our WLS shares will convert to WCMQ and our URFPA shares will convert to URF at the turn of the year.

Monday, January 02, 2023

How Can They Afford It?

One of Moominmama's friends (from undergrad days in the world's most populous country) told her they have bought a house in one of the most expensive neighborhoods here. They plan to knock it down and build their dream home including a swimming pool. It is in walking distance of their two children's school, the most expensive private school here.  Her reasoning is that it costs AUD 4 million to buy an existing house like they want, and this will be cheaper. Still, a crappy house there costs almost AUD 2 million. They haven't sold their existing town house in our neighborhood yet and they apparently also bought her parents an apartment here. She is an administrator at my workplace on probably AUD 100-110k a year and her husband was an associate professor (AUD 150-158k). He recently moved to Moominmama's employer.


My immediate reaction was: "How can they afford to do that?" I think Moominmama gets a lot of her aspirations from following this family, including sending our children to private school. 


Sunday, January 01, 2023

Subscriptions

Our utilities spending category had been rising strongly over time and so I decided to split out the "subscriptions" component:

The graph is in Australian Dollars per year. Data for 2022-23 is for calendar year 2022 and previous years are 1 July to 30 June to match the Australian tax year. Back in 2017-18, subscriptions were less than AUD 1k and so I included them together with phone and internet access bills in a "phone and internet" subcategory that got then bundled into "utilities". But they underwent a step change in 2020-21. Now I am only including "infrastructure" costs - phone bills, internet access, data storage etc. in the phone and internet subcategory. All the subscriptions and payments for electronic services are now in "subscriptions". I moved web-hosting to the "professional" category.

At least "subscriptions" aren't increasing much since the pandemic step change took place. Utilities have increased 36% since 2017-18, which is less than our overall 58% increase in spending. So, there isn't really a problem there. Childcare and education has increased most, by 483%. It was AUD 55k in the 2022 calendar year compared to only AUD 9k in the 2017-18 financial year. Calendar year 2022 spending was AUD 170k (USD 115k).


Friday, December 23, 2022

Domacom Reinstated to ASX Quotation

On the last trading day before Christmas, Domacom has been reinstated to quotation. I wonder where the price will end up?

7:27pm

It went up! Closing at 7 cents a share. It was last quoted at 6.5 cents before being suspended. There were more shares on the buy side than the sell side most of the day.