Wednesday, October 02, 2019

September 2019 Report

In September the Australian Dollar fell from USD 0.6729 to USD 0.6752. The MSCI World Index rose 2.15% and the S&P 500 1.87%. The ASX 200 rose 2.08%. All these are total returns including dividends. We gained 0.52% in Australian Dollar terms and 0.87% in US Dollar terms. The target portfolio lost 0.28% in Australian Dollar terms and the HFRI hedge fund index lost 0.27% in US Dollar terms. So, though we under-performed all three stock indices we out-performed our target portfolio and the HFRI. Updating the monthly returns chart:


Here is a report on the performance of investments by asset class (futures includes managed futures and futures trading):
Private equity and hedge funds did very well while gold and futures did poorly. The largest positive contribution to the rate of return came from hedge funds greatest detractor was gold, which was the exact reverse of the previous month. The returns reported here are in currency neutral terms.

Things that worked well this month:
  • Hedge funds shined as Platinum Capital, Regal, and Cadence gained significantly but Tribeca lost more money.
  • Pengana Private Equity gained.
What really didn't work:
  • Gold and Winton Global Alpha lost significantly, partly reversing recent gains.
  • Tribeca lost as noted above.
Trading: We gained modestly in Bitcoin and US treasuries futures and lost moderately in Palladium and big time in gold. Using a narrower definition including only futures and CFDs we gained 0.48% on capital used in trading. Including ETFs we lost 1.53%. Using both definitions we are a bit ahead of where we were at this point last year. This graph shows cumulative trading gains year to date:


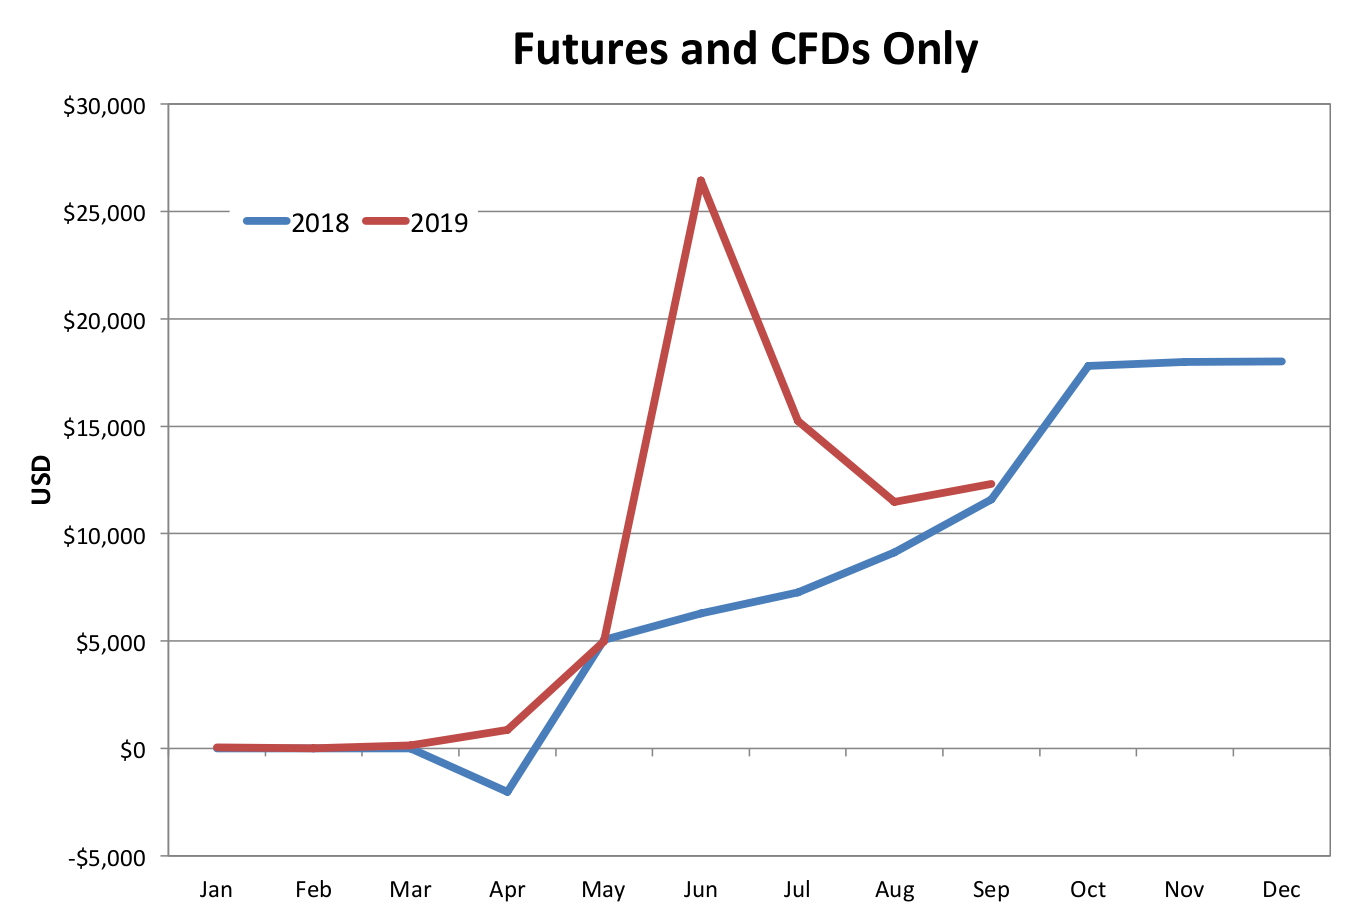
The picture is better using the broader definition.

We moved a further towards our new long-run asset allocation.* Cash increased most and private equity and bonds decreased most as we received the proceeds from the IPE.AX delisting:


On a regular basis, we also invest AUD 2k monthly in a set of managed funds, and there are also retirement contributions. Then there are distributions from funds, dividends, and interest. Other moves this month:
  • We sold $50k of Tenet Health Care bonds when they were called and $50k of Discovery Bonds matured. We bought $50k of HSBC bonds So, our direct bond holdings declined by $50k.
  • We traded with moderate success, as discussed above.
  • I bought a small number of Platinum Capital shares as their price was a lot below net asset value.
  • We started buying Australian Dollars again, buying AUD 20k this month.
  • We received the proceeds from the delisting of Oceania Capital.
  • As a result of all this our cash holdings increased by around AUD 120k.
* Total leverage includes borrowing inside leveraged (geared) mutual (managed) funds. The allocation is according to total assets including the true exposure in leveraged funds. We currently don't have any leveraged funds.

Saturday, September 28, 2019

ASX200 Futures

I put together a dataset for the ASX 200 futures for the past 5 years - Barchart have this data. Every possible "Turtle" strategy I tested lost money. So, we're definitely not going to trade this! I tested breakouts from 1 to 40 day periods and they all have similar poor performance. Position sizing to always trade the same percentage risk made things much worse.

Here is a 2,2 strategy without position sizing assuming no slippage – The best case scenario:


The blue line is the continuous futures contract price I constructed and black is the equity line of the strategy. This actually makes a slight gain over the 1200 trading days. But including reasonable slippage, it will turn into a loss. A 2,2 strategy means that you buy or sell breakouts from the previous two days highs or lows and exit those positions on breakouts from the same number of trading days in the opposite direction.

I have now put on a small (10 ounce) Palladium trade using CFDs. I'll probably test trading oil next.

Monday, September 23, 2019

Data Quality Matters

I did an analysis of the optimal trading strategy for Palladium futures using Barchart data. Previously, using free data, I had found that we should make trading decisions based on very short periods of past prices. For example we might go long (short) if prices broke out above (below) the previous day's high (low), or maybe the high or low of the previous two days. Now I find that the optimal strategies use periods of 7 to 18 days for breakouts. This shows that using good quality data really matters in trading, and not just a little bit. Using one day breakouts would actually lose money over the last five years of data that I tested. I lost money on all the Palladium trades I previously made... though four trades is not a large sample.


At the moment Palladium is in a winning long trade, but I am reluctant to go long at this point. So, I put in a short trade which will activate if the market reverses.

I also found out today that Barchart has past ASX 200 futures prices. I don't know if these are as high quality as their US futures data.  I will download them next.

Sunday, September 15, 2019

Variable Position Size, Again

I signed up for the Barchart Premier subscription. Among other things, this gives access to daily open, high, low, close etc. data for all US based futures contracts back to 2000. The data seems to be much more accurate than the various free sources. To start with, I downloaded all Bitcoin futures contracts data. I constructed a continuous series of prices going back to the beginning of trading in Bitcoin futures. I use proportional splicing that preserves percentage changes rather than absolute dollar changes. I also saved the actual futures prices for computing trading costs.

When we include the very volatile period right after the all time high in Bitcoin, the optimal trading strategy changes:


This graph shows the drawdown for a simple strategy that always buys the same number of contracts (in red) with a strategy that always has the same initial risk in percentage terms (in green). The latter targets a constant maximum 5% potential loss of the face value of the Bitcoin contracts before stopping out. The simple strategy soon finds itself 40% down at the end of January 2018. On the other hand, it manages to claw back that loss by late March... The constant risk strategy only loses a maximum of 15% over this period. On the other hand it performed worse during the string of 11 losing trades in a row in late 2018. But the Sharpe ratio for the constant risk strategy (2.45) is quite a lot higher than for the constant position size strategy (2.21). So, I am going to start varying position size, targeting a maximum loss of USD 5,000.

I will also start to revisit other markets to see where there is potential.

Previously, I found that there was a positive relationship between the initial risk of a trade and its return. When volatility is low moves seem to be more noise than signal. Looking at the relationship between initial risk and return, there is now a negative correlation between them, though it isn't statistically significant:


On the other hand,  the "lowest risk" trades here mostly had negative outcomes.