I've now tested Bitcoin, ASX200, palladium, and crude oil futures trading using Barchart data. So far, only ASX200 futures were not profitable. I'm now trading one contract long or short of Bitcoin futures, trading palladium with position sizing using CFDs, and have put in an order to short crude oil futures.
With palladium I am aiming to risk about 10% of the CFD account on each trade. My current position is long 10 ounces of palladium and I have an order to short 20 ounces of palladium. The typical risk for trading a 100 ounce palladium futures contract is too big at this stage. The contract face value is around USD 160k. So, even if the stop is 5% from the current price you are risking USD 8000.
On the other hand, a crude oil contract has a face value of around USD 50k (1000 barrels of oil). I am targeting 5% of the face value as the risk we can take on. To compute the number of contracts we can trade we calculate: 0.05*price/abs(price-stop) and round it up or down to the nearest integer. If that is zero then we don't put an order in. This is why I only have a short order at the moment and no order to go long.
Both oil and palladium have longer optimal periods for measuring breakouts against than Bitcoin does. My palladium strategy looks for breakouts from the last seven days of prices in either direction. My oil strategy uses breakouts from the last eleven days. However, it will exit a long (short) position if the price falls below (rises above) the previous day's low (high).
Palladium has about the same risk/return trade off as Bitcoin, but oil isn't as good a risk/return ratio. Here are the average maximum potential loss and the average trade profit for trading with a single contract:
Bitcoin: Risk = USD 3,722, profit = USD 1,036, ratio = 0.28
Palladium: Risk = USD 4,910, profit = USD 1.462, ratio = 0.30
Crude oil: Risk = USD 2,030, profit = USD 225, ratio = 0.11
Compared to face value of the contract, the average Bitcoin profit is a 2.7% return, while for palladium and oil it is 0.9% and 0.4%, respectively. Relative to required margin, though, Bitcoin is not so good compared to the others.
The reason for trading all three of them at this stage is for diversification. I want to have more consistent returns rather than boom and bust. That's why I am still allocating the largest amount of risk to Bitcoin. I also still have a treasuries futures trade on and am long more than 100 ounces of gold via the IAU ETF.
At this point, I think I got beyond the experimental stage of trading and am now in a more developmental period. My backtesting programs work pretty well, I have good quality data, am more used to trading in a disciplined way, and am now testing which markets and position sizes make most sense.
Showing posts sorted by relevance for query palladium. Sort by date Show all posts
Showing posts sorted by relevance for query palladium. Sort by date Show all posts
Monday, October 07, 2019
Monday, September 23, 2019
Data Quality Matters
I did an analysis of the optimal trading strategy for Palladium futures using Barchart data. Previously, using free data, I had found that we should make trading decisions based on very short periods of past prices. For example we might go long (short) if prices broke out above (below) the previous day's high (low), or maybe the high or low of the previous two days. Now I find that the optimal strategies use periods of 7 to 18 days for breakouts. This shows that using good quality data really matters in trading, and not just a little bit. Using one day breakouts would actually lose money over the last five years of data that I tested. I lost money on all the Palladium trades I previously made... though four trades is not a large sample.

At the moment Palladium is in a winning long trade, but I am reluctant to go long at this point. So, I put in a short trade which will activate if the market reverses.
I also found out today that Barchart has past ASX 200 futures prices. I don't know if these are as high quality as their US futures data. I will download them next.
Friday, December 06, 2019
Trading Update
Well, that didn't last long. In November's report I said I would raise the risk allocation to palladium and soybeans. I just got stopped out of palladium futures though the contract is ending the day more or less where it began. I actually made a little money on the trade, but I'm not willing to take so much risk. So, I'm going to go back to trading palladium CFDs with a smaller amount of risk. I'll cut soybeans back to USD 2,500 risk as well. Yesterday, Bitcoin had a double stop out. First the long position was closed for a loss and a short opened and then the short was stopped out intraday. After all that, the contract ended near where it started:

I'm seriously thinking again of giving up on trading. Yes, you can make money doing this and I am now disciplined enough to always do the trades the algorithm says to do. But in practice there is still quite a lot of anxiety and mood swings. If I keep trading so small that I only make say a thousand dollars a month at it, it's not really worth the hassle. But if I make it big enough to make a difference I will have too much anxiety. That's the dilemma at this point. So far this financial year I am just losing money. I've given back all of last month's profit in the first week of this month.

I'm seriously thinking again of giving up on trading. Yes, you can make money doing this and I am now disciplined enough to always do the trades the algorithm says to do. But in practice there is still quite a lot of anxiety and mood swings. If I keep trading so small that I only make say a thousand dollars a month at it, it's not really worth the hassle. But if I make it big enough to make a difference I will have too much anxiety. That's the dilemma at this point. So far this financial year I am just losing money. I've given back all of last month's profit in the first week of this month.
Monday, October 14, 2019
Optimizing Trading Portfolios and Shifting to Return on Risk Metric
I started exploring testing portfolios of trading strategies. For this, I decided that in looking at return on capital where capital is the face value of a futures contract doesn't make much sense. It seems to make more sense to look at the return on money at risk. It makes the most sense to measure that in dollars as a share of a total risk budget. This then leads me to making the primary measure of return also to be in dollars. Here is an optimized portfolio of Bitcoin, oil, and palladium:

The portfolio has a total risk budget of USD 5,000. This is then allocated across the three markets with the resulting profit curves. The analysis assumes that you can trade fractional futures contracts. Oil and palladium help diversify Bitcoin and increase the information ratio. Using a zero benchmark and daily returns on risk the portfolio IR is 2.96 rising from 2.17 for Bitcoin alone.
Oil hasn't gone anywhere in the last year, but did well in 2018 when Bitcoin struggled. Going forward, I will test whether each new market I look at improves the portfolio IR or not.
This approach then also leads to computing the prices for continuous futures contracts additively rather than multiplicatively – so that differences in dollars are preserved -– and to focusing on a constant risk budget in dollars. It also allowed me to simplify the back-testing program quite a bit. In the following chart the blue line is the daily profit curve for trading one contract of Bitcoin futures:

The red curve is based on completed trades only. The green curve has a constant dollar risk equal to the average of the single contract. To be more realistic I have rounded the number of contracts to the nearest whole number, which could be zero. This keeps the strategy out of the market in late 2017 and early 2018, when the single contract strategy had a big drawdown. The constant risk strategy has a higher return and a smaller maximum drawdown than trading a single contract. So, this is the strategy I am adopting for Bitcoin going forward. This morning, we switched from one contract long to one contract short...
Thursday, December 12, 2019
Pulling the Plug on Short-Term Trading

I've decided to stop short-term trading. In recent months it hasn't made any money, it takes up a lot of time, and it gives me a lot of anxiety. Even though I am doing systematic trading I find myself looking at the market a lot and worrying about my positions. I can't seem to stop it. And my current position sizes are quite small. After a sleepless night, I've had enough. I already cancelled my orders that were waiting to execute. I will keep the existing Bitcoin and palladium positions until they exit naturally
Going forward, I will need to think about our overall financial plan again. Trend following funds aren't doing well in recent years, so we won't want to allocate that much to them compared to the current target allocation to "futures". What should we invest in instead? Should I still plan to set up an SMSF? I delayed that while I waited to see if trading was going to be a big part of it.
I've been here a couple of times before.
Wednesday, October 02, 2019
September 2019 Report
In September the Australian Dollar fell from USD 0.6729 to USD 0.6752. The MSCI World Index rose 2.15% and the S&P 500 1.87%. The ASX 200 rose 2.08%. All these are total returns including dividends. We gained 0.52% in Australian Dollar terms and 0.87% in US Dollar terms. The target portfolio lost 0.28% in Australian Dollar terms and the HFRI hedge fund index lost 0.27% in US Dollar terms. So, though we under-performed all three stock indices we out-performed our target portfolio and the HFRI. Updating the monthly returns chart:

Here is a report on the performance of investments by asset class (futures includes managed futures and futures trading):

Things that worked well this month:
- Hedge funds shined as Platinum Capital, Regal, and Cadence gained significantly but Tribeca lost more money.
- Pengana Private Equity gained.
- Gold and Winton Global Alpha lost significantly, partly reversing recent gains.
- Tribeca lost as noted above.
The picture is better using the broader definition.
We moved a further towards our new long-run asset allocation.* Cash increased most and private equity and bonds decreased most as we received the proceeds from the IPE.AX delisting:

On a regular basis, we also invest AUD 2k monthly in a set of managed funds, and there are also retirement contributions. Then there are distributions from funds, dividends, and interest. Other moves this month:
- We sold $50k of Tenet Health Care bonds when they were called and $50k of Discovery Bonds matured. We bought $50k of HSBC bonds So, our direct bond holdings declined by $50k.
- We traded with moderate success, as discussed above.
- I bought a small number of Platinum Capital shares as their price was a lot below net asset value.
- We started buying Australian Dollars again, buying AUD 20k this month.
- We received the proceeds from the delisting of Oceania Capital.
- As a result of all this our cash holdings increased by around AUD 120k.
Saturday, November 02, 2019
October 2019 Report
This month we "inverted" our mortgage, paying off the mortgage and then redrawing it for investment purposes. As a result the mortgage interest should now be tax deductible. I carried out quite a lot of trades and money shuffling to carry this out.
The Australian stockmarket fell a bit in October and the Australian Dollar rose, but overseas markets rose. The Australian Dollar rose from USD 0.6752 to USD 0.6894. The MSCI World Index rose 2.76% and the S&P 500 2.17%. The ASX 200 fell 0.35%. All these are total returns including dividends. We lost 0.20% in Australian Dollar terms but gained 1.90% in US Dollar terms. The target portfolio lost 1.03% in Australian Dollar terms and the HFRI hedge fund index is expected to have gained 0.83% in US Dollar terms. So, we out-performed our target portfolio, the HFRI, and the ASX, while underperforming compared to the MSCI World Index and the S&P 500 (a bit). Updating the monthly AUD returns chart:

Hmmm... It is looking like my performance is an average of the MSCI and the target portfolio in recent months.The Australian stockmarket fell a bit in October and the Australian Dollar rose, but overseas markets rose. The Australian Dollar rose from USD 0.6752 to USD 0.6894. The MSCI World Index rose 2.76% and the S&P 500 2.17%. The ASX 200 fell 0.35%. All these are total returns including dividends. We lost 0.20% in Australian Dollar terms but gained 1.90% in US Dollar terms. The target portfolio lost 1.03% in Australian Dollar terms and the HFRI hedge fund index is expected to have gained 0.83% in US Dollar terms. So, we out-performed our target portfolio, the HFRI, and the ASX, while underperforming compared to the MSCI World Index and the S&P 500 (a bit). Updating the monthly AUD returns chart:

Here is a report on the performance of investments by asset class (futures includes managed futures and futures trading):

Things that worked well this month:
- Pengana Private Equity and Bluesky Alternatives did very well, gaining AUD 8.7k and AUD 10k, respectively. Hearts and Minds gained AUD 5.3k.
- Gold gained (AUD 7.3k).
- Winton Global Alpha lost significantly, reversing recent gains.
- Pershing Square, Cadence Capital, and Tribeca Natural Resources all lost money.

We moved further towards our new long-run asset allocation.


On a regular basis, we invest AUD 2k monthly in a set of managed funds, and there are also retirement contributions. Other moves this month:
- USD 21K of Kraft-Heinz bonds were called early and we didn't buy any new bonds So, our direct bond holdings declined by USD 21k.
- We traded at a small loss, as discussed above.
- I sold 100k of Domacom (DCL.AX), 40k of Tribeca Global Natural Resources (TGF.AX), and 79k of Cadence Capital (CDM.AX) shares to harvest tax losses and obtain cash for the mortgage inversion. I subsequently bought back 40k of Tribeca and 80k of Cadence. I now have the funds which are marginable and/or are likely to pay large franking credits in my account and the non-marginable funds, which mostly also are likely to pay out fewer franking credits in Snork Maiden's account. As franking credits are applied to the tax bill it doesn't actually matter which account they are in, but I like to see my larger tax bill cut more :) I have a margin account with Commonwealth Securities, while Interactive Brokers don't offer margin loans to Australian customers.
- I bought 20k shares of Hearts and Minds (HM1.AX) before the upcoming annual Sohn Conference. The fund is currently winding down the investments in the stocks recommended at the last conference and will invest in new recommendations following this year's conference. The share price is very close to NAV and I think following the conference there could be a boost in price. The fund has done very well since inception.
- I went to Regal Fund's presentation here and was impressed and bought 20k more shares of RF1.AX.
- I sold 50k of Pengana Private Equity (PE1.AX) shares because the price seemed unsustainably high but then bought back 50k at lower prices. This is not looking like a good move given the tax implications
- We bought AUD 40k of Australian Dollars.
- We moved around AUD 1/4 million to our offset account and paid off the mortgage. We then redrew AUD 1/2 million and sent it to my CommSec account and Moominmama's Interactive Brokers account. This reduced my margin loan a lot and increased the cash in her account a lot. The latter is deemed to be "futures" in the pie chart above. Cash in our offset account fell to AUD 40k.
Friday, May 24, 2019
May 2019 Report
In May the Australian Dollar fell from USD 0.7047 to USD 0.6930. The MSCI World Index fell 5.85% and the S&P 500 6.35%. The ASX 200 rose 1.96%. All these are total returns including dividends. We gained 0.37% in Australian Dollar terms and lost 1.30% in US Dollar terms. Our currency neutral rate of return was -0.53%. I estimate that the target portfolio gained 0.01% in Australian Dollar terms and the HFRI hedge fund index lost 1.75% in US Dollar terms. So, we under-performed the Australian stock market but outperformed our other benchmarks.
Here again is a detailed report on the performance of all investments:

The table also shows the shares of these investments in net worth. At the bottom of the table I also include the Australian Dollars return from foreign currency movements, other net investment gains and losses - net interest and fees, and futures trading. At the asset class level, private equity was the best performing asset class gaining 1.56%. The worst asset class was rest of the world stocks.
Things that worked very well this month:
We moved further away from our new long-run asset allocation * as we continued to accumulate bonds. But this is probably "peak bonds" in terms of their share in our portfolio, as we have finished moving money from my US bank account to Interactive Brokers:

Buying Australian Dollars is also on hold for a while as we bought a lot last month.
On a regular basis, we also invest AUD 2k monthly in a set of managed funds, and there are also retirement contributions. Then there are distributions from funds and dividends. Other moves this month:
Here again is a detailed report on the performance of all investments:

Things that worked very well this month:
- Trading Bitcoin. The beginning of the month we made big profits and then towards the end of the month started losing.
- Medibank Private. We sold out of it in the post-election rally.
- Oceania Capital. They announced a buyback at a premium to the last share price prior to planned delisting. See below...
- Hearts and Minds. Continued to outperform the markets.
- Our corporate bond portfolio began to have net positive returns.
- Bluesky Alternatives. The parent company of the fund manager went bankrupt... See below...
- China Fund. Got hit by the trade war.
We moved further away from our new long-run asset allocation * as we continued to accumulate bonds. But this is probably "peak bonds" in terms of their share in our portfolio, as we have finished moving money from my US bank account to Interactive Brokers:

On a regular basis, we also invest AUD 2k monthly in a set of managed funds, and there are also retirement contributions. Then there are distributions from funds and dividends. Other moves this month:
- USD 50k of corporate bonds matured (General Motors) and I bought USD 147k of USD bonds (Tenet Health, Anglogold, Deutsche Bank, and Yum Brands).
- We traded successfully, as discussed above.
- We sold 3521 Medibank Private shares when the price spiked after the election. We now have no individual company stocks.
- I bought 25,000 BAF.AX shares following the manager BLA.AX being put into administration. The board of the LIC is trying to engage Wilson Asset Management as the new manager and I think the chances of that are now better. The discount to NAV is about 36%, so even if assets managed by BLA are liquidated, I think there is a margin of safety.
- I bought 8000 OCP.AX shares after the manager announced that they would delist and buy out minority shareholders. The announced buy out price of AUD 2.30 is much less than NAV of AUD 2.83 though higher than NTA of 1.50. So, I am still hoping that they will raise the buyout price. On the other hand, the largest shareholder owns 60% of the shares and so it seems that they can do anything they like. Only around 25% are held by non-insiders/managers. Even if they don't raise the price, it is about a 12% p.a. rate of return from my entry price to redemption.
- I bought 2000 shares of the IAU gold ETF.
- We applied for the Regal Funds IPO.
Saturday, October 26, 2019
Silver, Six Losing Bitcoin Trades in a Row...
I tested silver futures as a possible addition to the trading portfolio. When combined with Bitcoin, palladium, and crude oil its optimal portfolio weight was 2%. So, I'm not going to be trading that.

Overnight and in today action in Bitcoin has been insane. I was up around USD 5k on my last Bitcoin trade and then it became a USD 1k losing trade, the sixth in a row. We switched to long from short and subsequently bitcoin skyrocketed to over 10,000 from around 7,500. This long trade is only one contract though compared with two contracts on the previous short. It seems like this spike might have been generated by Xi Jinping's new enthusiasm for blockchain. He told party members to study blockchain. This is despite China banning cryptocurrency exchanges, though a lot of Bitcoin mining takes place in China.

Overnight and in today action in Bitcoin has been insane. I was up around USD 5k on my last Bitcoin trade and then it became a USD 1k losing trade, the sixth in a row. We switched to long from short and subsequently bitcoin skyrocketed to over 10,000 from around 7,500. This long trade is only one contract though compared with two contracts on the previous short. It seems like this spike might have been generated by Xi Jinping's new enthusiasm for blockchain. He told party members to study blockchain. This is despite China banning cryptocurrency exchanges, though a lot of Bitcoin mining takes place in China.
Saturday, September 28, 2019
ASX200 Futures
I put together a dataset for the ASX 200 futures for the past 5 years - Barchart have this data. Every possible "Turtle" strategy I tested lost money. So, we're definitely not going to trade this! I tested breakouts from 1 to 40 day periods and they all have similar poor performance. Position sizing to always trade the same percentage risk made things much worse.
Here is a 2,2 strategy without position sizing assuming no slippage – The best case scenario:
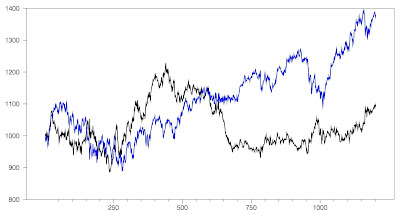
The blue line is the continuous futures contract price I constructed and black is the equity line of the strategy. This actually makes a slight gain over the 1200 trading days. But including reasonable slippage, it will turn into a loss. A 2,2 strategy means that you buy or sell breakouts from the previous two days highs or lows and exit those positions on breakouts from the same number of trading days in the opposite direction.
I have now put on a small (10 ounce) Palladium trade using CFDs. I'll probably test trading oil next.
Monday, December 02, 2019
November 2019 Report
A less frenetic month financially but somehow I didn't get to make any blogposts since October's monthly report. We started on refinancing our mortgage at a lower interest rate, but the transaction is not yet complete.
The Australian Dollar fell from USD 0.6894 to USD 0.6764. The MSCI World Index rose 2.48% and the S&P 500 3.63%. The ASX 200 gained 3.51%. All these are total returns including dividends. We gained 2.17% in Australian Dollar terms but only 0.25% in US Dollar terms. The target portfolio is expected to have gained 1.53% in Australian Dollar terms and the HFRI hedge fund index is expected to have gained 0.75% in US Dollar terms. So, we out-performed our target portfolio but lagged other benchmarks. Updating the monthly AUD returns chart:

The Australian Dollar fell from USD 0.6894 to USD 0.6764. The MSCI World Index rose 2.48% and the S&P 500 3.63%. The ASX 200 gained 3.51%. All these are total returns including dividends. We gained 2.17% in Australian Dollar terms but only 0.25% in US Dollar terms. The target portfolio is expected to have gained 1.53% in Australian Dollar terms and the HFRI hedge fund index is expected to have gained 0.75% in US Dollar terms. So, we out-performed our target portfolio but lagged other benchmarks. Updating the monthly AUD returns chart:

Here is a report on the performance of investments by asset class (futures includes managed futures and futures trading):

Stocks and real estate did well while hedge funds, private equity, and gold did poorly. The largest positive contribution to the rate of return came from large cap Australian stocks and the greatest detractor was gold. The returns reported here are in currency neutral terms.
Things that worked well this month:
- The Unisuper superannuation fund gained more than any other investment in dollar terms.
- Soybeans and Bitcoin were the next best performers.
- Crude oil and gold lost heavily.
- Regal Funds (RF1.AX) fell sharply after it was reported that the firm was under investigation by the regulator, ASIC.
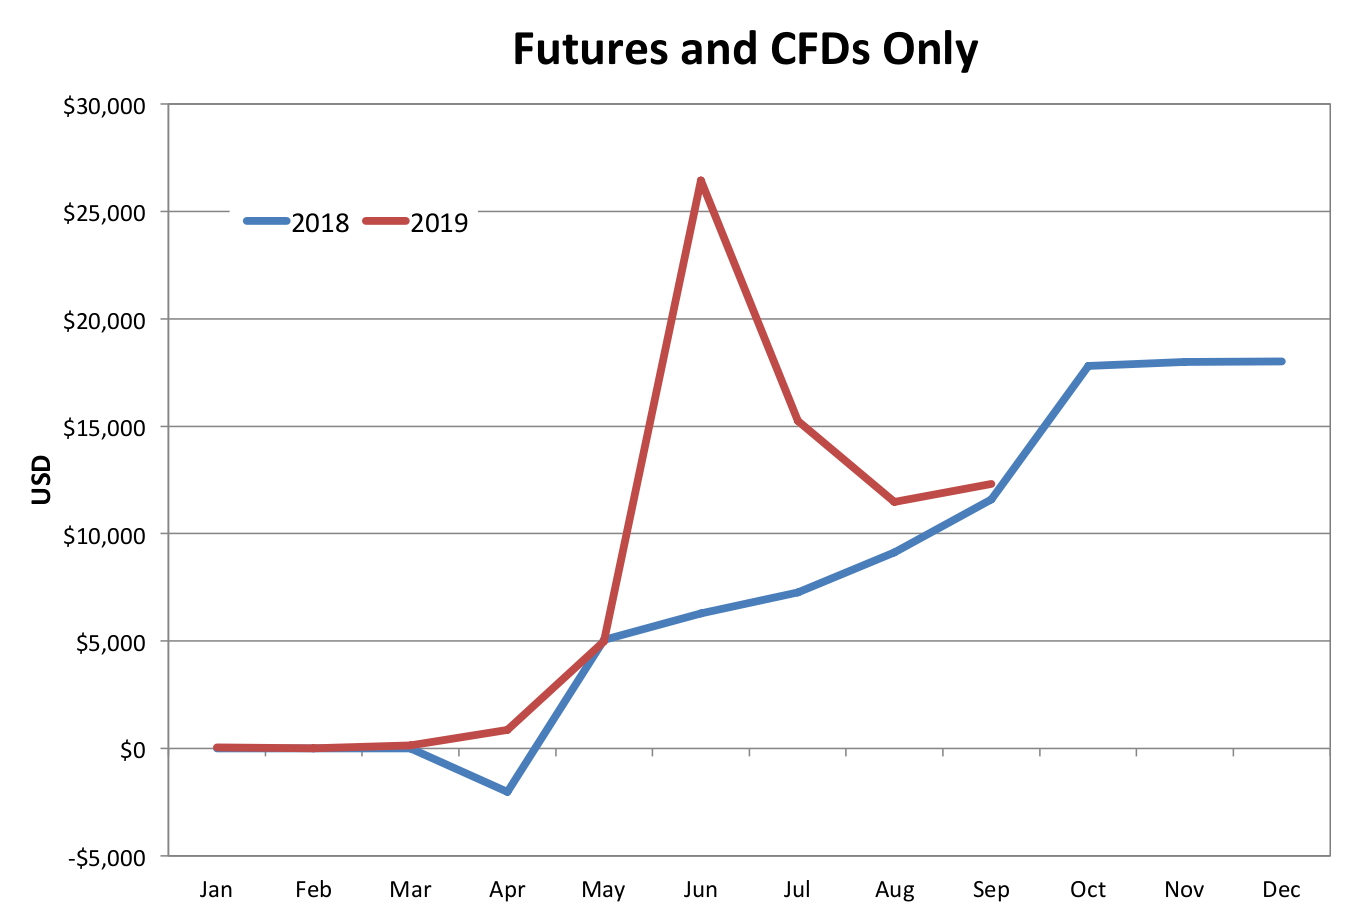
Using a narrower definition including only futures and CFDs we made 3.55% on capital used in trading or USD 6.5k. Including ETFs we lost just 0.01% or AUD 46. Using the narrow definition, we are catching up to last year's returns. This graph shows cumulative trading gains using the narrower definition year to date:

I think I should increase the risk allocations to soybeans and palladium to USD 5,000 each from USD 2,500 and AUD 1,250 currently. These would be roughly the allocations suggested by the portfolio optimization given current allocations to Bitcoin and oil (USD 3,670 and 2,500). Risk allocation is the maximum potential loss on a single trade.
We moved further towards our new long-run asset allocation.

On a regular basis, we invest AUD 2k monthly in a set of managed funds, and there are also retirement contributions. Other moves this month:
- I rebought 100,000 shares of Domacom (DCL.AX).
- I bought 10,000 shares of Regal Funds (RF1.AX) after the price fell sharply following an ASIC investigation of the firm.
- USD 100k of bonds (Virgin Australia & Viacom) matured. I bought USD 25k of Dell, 16k of Nustar, and 25k of Tupperware bonds. So our direct exposure to corporate bonds fell by USD 34k.
- I transferred AUD 45k to my Colonial First State superannuation account, investing in the Conservative Fund.
- I bought around AUD 43k and GBP 7k, selling US dollars.
- I bought 750 shares of 3i.
Monday, October 28, 2019
Capitalise
Capitalise is an automated trading platform that uses commands written in near natural English at a very high level. I heard about it when Interactive Brokers told us that we now have access to it. At the moment the service is free. You can put in commands where buy/sell levels and stops depend on functions of past prices and also various technical indicators. There is no need to learn a formal programming language like Python or understand any of the intricacies of actually executing strategies. They are based in Israel.
This would be great for me except at the moment it doesn't allow position sizing based on functions of prices. You have to give it a numerical position size. I chatted with Arica on their platform and she said that they might develop that functionality in the future. For now I can handle updating my orders each morning (Australian time) as I am only systematically trading in 3 markets (Bitcoin, palladium, and oil). Maybe they will have this functionality by the time I can't handle trading manually anymore and I won't need to learn Python etc or collaborate with someone who does know that stuff.
This would be great for me except at the moment it doesn't allow position sizing based on functions of prices. You have to give it a numerical position size. I chatted with Arica on their platform and she said that they might develop that functionality in the future. For now I can handle updating my orders each morning (Australian time) as I am only systematically trading in 3 markets (Bitcoin, palladium, and oil). Maybe they will have this functionality by the time I can't handle trading manually anymore and I won't need to learn Python etc or collaborate with someone who does know that stuff.
Saturday, November 30, 2019
Performance of Optimal Portfolio

The graph shows the monthly profits from idealized trading of an optimal portfolio of Bitcoin, palladium, crude oil, and soybeans futures. The risk budget is the maximum loss possible in one day under ideal conditions.
My results this year somewhat track these. My trading hasn't always been ideal, I have been developing my methods, and my portfolio doesn't have the optimal weights yet. Midyear there were strong returns available and I also did well. Then, in the last four months returns were lower or negative and I also lost money. November was again a good month though not as good as April-June.
Next month I am looking to move closer to the optimal weights and increase the risk budget so that the average return would in theory be around the same amount as my salary, which is one of the goals I have set.
Subscribe to:
Posts (Atom)