In March, stock markets rebounded. The MSCI World Index (USD gross) rose 3.15% and the S&P 500 3.67% in USD terms, while the ASX 200 only gained 0.25% in AUD terms. All these are total returns including dividends. The Australian Dollar fell from USD 0.6740 to USD 0.6695. We gained 0.55% in Australian Dollar terms but lost 0.15% in US Dollar terms. The target portfolio gained 1.84% in Australian Dollar terms and the HFRI hedge fund index is expected to gain 1.47% in US Dollar terms. So, we only out-performed the ASX200.
Here is a report on the performance of investments by asset class:

Gold was the main positive contributor to returns and the highest returning asset class while futures were the largest detractor and worst performing asset class. The trend-following managed futures funds got caught in the sudden movement in US bonds during the month associated with the banking crisis.
Things that worked well this month:
- Gold gained AUD 54k - the biggest monthly gain in a single investment since I started investing.
What really didn't work:
- Tribeca Global Resources (TGF.AX) lost AUD 11k. Followers up were: Pershing Square Holdings (PSH.L, -10k), Aspect Diversified Futures (-9k), Hearts and Minds (HM1.AX, -9k), and Winton Global Alpha (-8k).
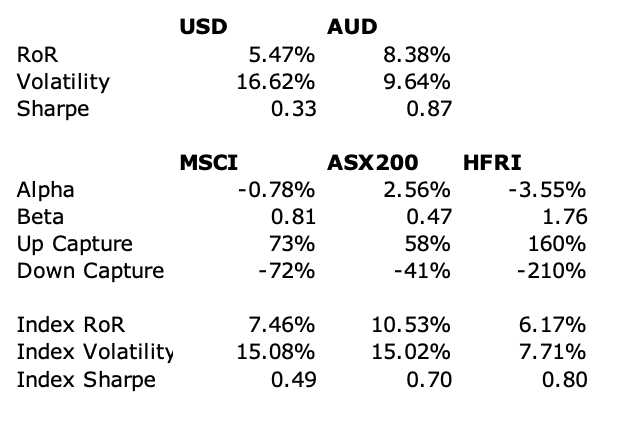
The investment performance statistics for the last five years are:
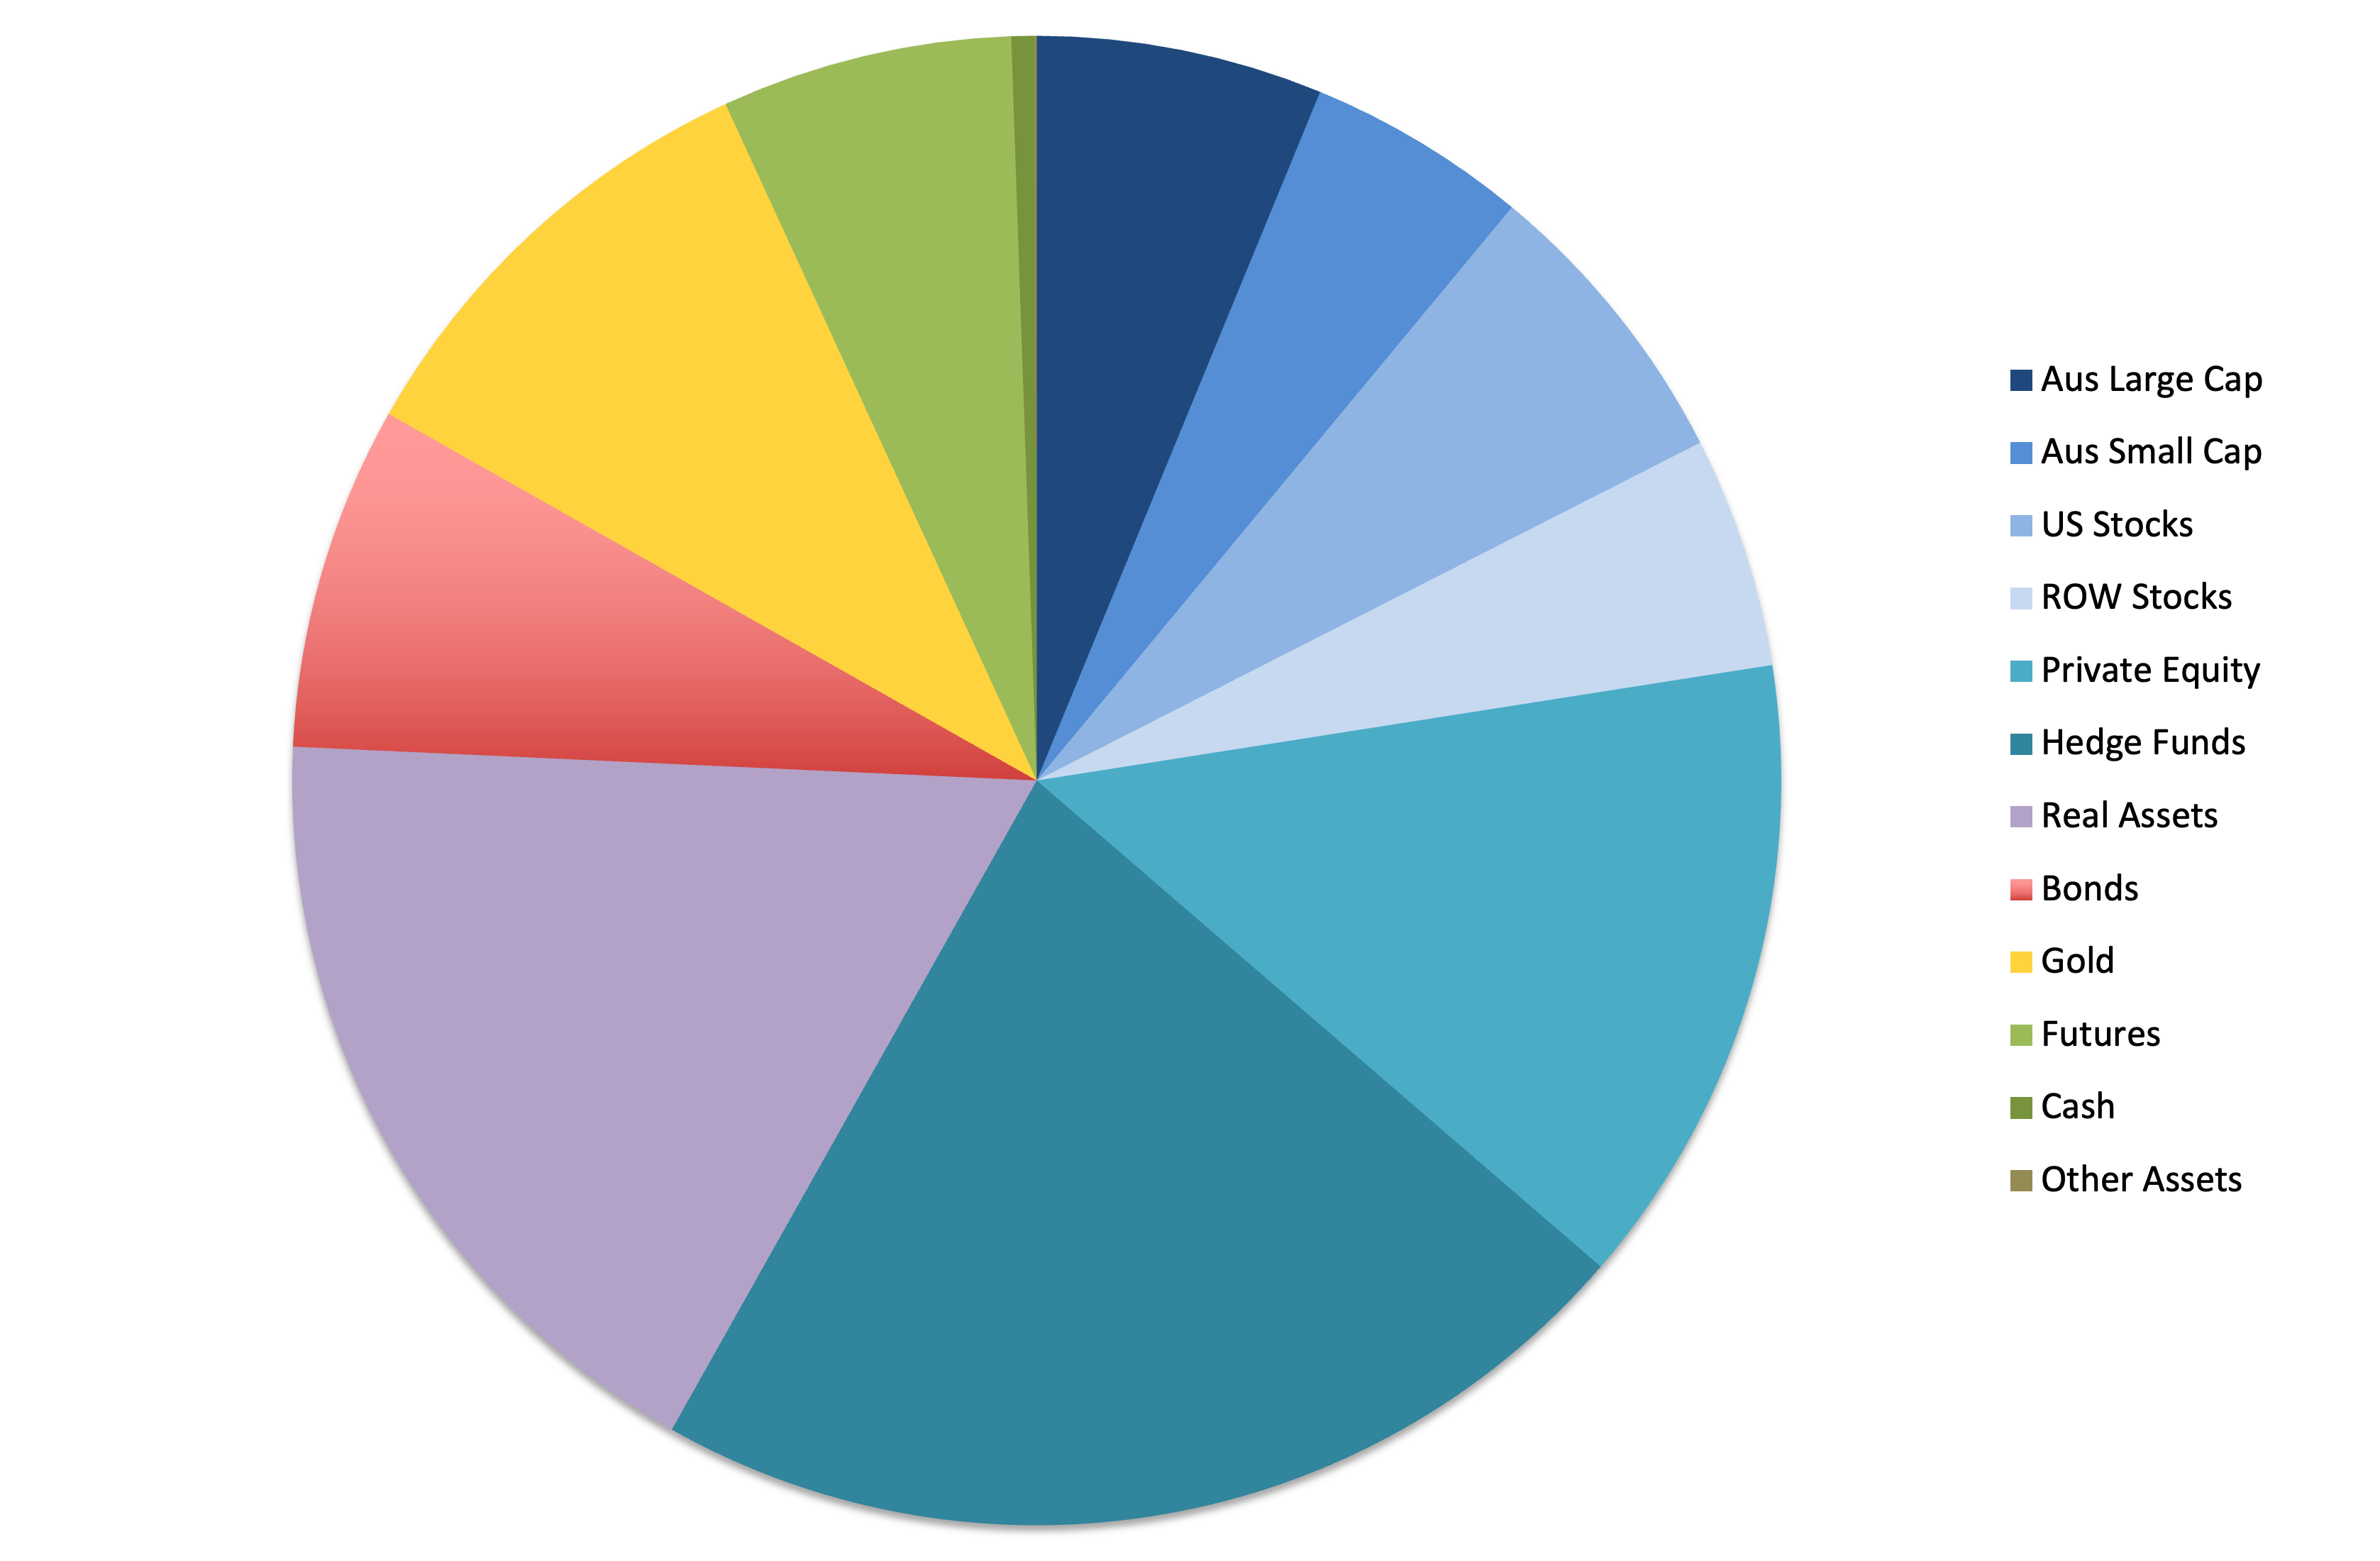
We are now very close to our target allocation but we mived away from it quite sharply during the month. In particular, real assets increased as we added to URF.AX and it rose, while private equity fell as we took profits in PE1.AX. Our actual allocation currently looks like this:
We receive employer contributions to superannuation every two weeks. We are now contributing USD 10k each quarter to Unpopular Ventures Rolling Fund and less frequently there will be capital calls from Aura Venture Fund II. In addition, we made the following investment moves this month:
- I sold 100 China Fund (CHN) shares.
- I sold 3,500 WAM Leaders (WLE.AX) shares.
- I sold 10k MCP Income Opportunities (MOT.AX) when the price spiked back up to AUD 2.10.
- I bought 12k shares net of Cordish-Dixon Private Equity Fund 3 (CD3.AX).
- I did a losing trade in bond futures.


