In USD terms. Currently I have us up 12.65% in USD terms and 6.62% in AUD terms - likely that the final numbers could be slightly higher - Snork Maiden's retirement account has a scheduled outage till Monday morning... Of course we won't have a real final number for April till the end of May when Everest and Man get around to reporting their unit prices for April...
The MSCI is up just 0.07% YTD. Been a bumpy path.
Showing posts sorted by relevance for query everest. Sort by date Show all posts
Showing posts sorted by relevance for query everest. Sort by date Show all posts
Friday, May 01, 2009
Wednesday, August 12, 2020
Investing During the Pandemic
Financial Samurai's blogpost got me wondering how much I had taken advantage of the decline in asset prices earlier this year to add to my investments. So, I put together a table of all my exchange traded investments that aren't bonds plus the APSEC fund I recently invested in. Not included are bonds, other unlisted funds such as Winton Global Alpha, Aura Venture Capital, our Colonial First State Funds, the Everest Fund that recently wound up, and all our superannuation funds. The idea is to capture where I have made deliberate rather than automatic investments.


The table presents snapshots on 1 February, before the pandemic had effects in Western countries, and today. The number of shares held is self-explanatory. Investment is the net cash invested in that investment. So, making an investment increases the number and withdrawal reduces it, but dividends and distributions that aren't re-invested also reduce it. All the numbers are in Australian Dollars and so the numbers also declined for 3i, Boulder, China Fund, and Pershing as the Australian Dollar rose. Investment per share is the investment number divided by the number of shares.
In total, I added $334k to these investments over this period. Most of this money came from maturing bonds. There are a lot of different patterns though. I might have made a mistake in investing the most in funds that were trading at the biggest discount to net asset value rather than what turned out to be the strongest funds. I didn't invest anything in Hearts and Minds and not much in Regal. I got a lot of extra shares in Cadence and Tribeca, which is a bet that they'll do better in the future. I increased my Pengana investment mostly because I thought I needed to invest more in private equity and because the fund had been trading at a big premium to net asset value. It's partly a bet that the premium will come back.
In general though, I have been cautious investing during this period because I invested a lot in early 2008 after the initial fall in the market, only to lose big later in the year.
Monday, June 02, 2008
May 2008 Report
A good month, though returns were not as spectacular as in April. Mid month, investment returns were more than double what they were by the end of the month following a pullback in the markets. In the chart, month's above the red line have risk adjusted excess returns, while those above the blue line have above average risk adjusted returns:

The gap between the blue and red lines is alpha. May had returns that are typical of good months.
But we are on track to meeting all our annual goals, which are assessed in the first part of this report. Other statistics appear towards the end of the report. All amounts are in U.S. Dollars unless otherwise stated.
1. Net Worth Goal: Reaching $500k We made progress on this goal as net worth rose by $17.7k to $482.3k and in Australian Dollars rose $A11.7k to $A505k. USD results were again boosted by the continued rise in the Australian Dollar.
2. Alpha Goal: Alpha of 8.5% The point of this goal is to earn at least an average wage from risk-adjusted excess returns. Using my preferred time-series method our returns had a beta of 0.85 and an alpha of 10.0% with respect to the MSCI World index, which meets our annual goal. The risk adjusted excess return for May based on this analysis was 1.71%. Multiplying this by net worth gives an income of $8,090. For the year so far the risk-adjusted excess return in dollar terms has been $26,222. Using the estimate of alpha the smoothed annual income is $47,303. In Australian Dollars terms returns are somewhat lower, while they are higher using the S&P 500 as a benchmark.
3. Increasing Non-Retirement Net Worth by More than the MSCI Index The point of this goal is to make sure that we only spend out of non-investment income and excess returns and don't use the normal market return on investments to fund spending. In other words, this makes sure we have positive saving. Non-retirement accounts rose by 5.02%, while the MSCI index rose by 1.68%. So far this year these accounts have grown by 6.51% in excess of the MSCI return.
4. Achieving Break-Even on U.S. Taxable Accounts This goal was achieved. At the end of the month we were $751 above the breakeven point with a gain of $1,311 for the month. The rate of return on these accounts was 1.87%.
5. Make at Least $15,000 from Trading Realised gains this month were $1,586 and so far this year $3,584. I've now had four positive months in a row, which is a record. Earlier today I raised the annual trading goal to $15,000.
Background Statistics
Income and Expenditure

Expenditure was $3,472 in line with recent numbers. Spending included $76 of implicit car expenses - interest only as the car didn't depreciate this month according to RedBook. In addition to her ordinary pay Snork Maiden received her IRS tax refund and stimulus check and Moom was paid a small consulting fee, which raised non-investment income to $6,225.
Non-retirement accounts gained $9,091 with the rise in the Australian Dollar contributing $1,969. Retirement accounts gained $5,613 but would have gained only $3,319 without the change in exchange rates.
Investment Performance
Investment return in US Dollars was 7.75% vs. a 5.65% gain in the MSCI (Gross) All Country World Index, which I use as my overall benchmark and a 4.87% in the S&P 500 total return index. Returns in Australian Dollars and currency neutral terms were 4.47% and 5.21% respectively. So far this year we have gained 2.58%, while the MSCI and S&P 500 have lost 4.04% and 5.03%, respectively.
The contributions of the different investments and trades are as follows:

The returns on all the individual investments are net of foreign exchange movements. Again the biggest gain was in the CFS Geared Share Fund which is our biggest investment. Australian listed fund of hedge funds Everest Brown and Babcock continued to recover from a steep discount to book value but my other "deep value" Australian investments showed little movement or like Challenger Infrastructure and Clime Capital, declined.
Asset Allocation
Allocation was 41% in "passive alpha", 71% in "beta", 3% allocated to trading, 6% to industrial stocks, 3% to liquidity, 3% to other assets and we were borrowing 27%. Our currency exposures were roughly 56% Australian Dollar, 21% US Dollar, and 23% Other and Global. In terms of asset classes, the distribution was:

Due to the use of leveraged funds, our actual exposure to stocks was 118% of net worth. I slightly trimmed exposure to stocks as the market rose while increasing exposures to bonds and alternative assets by a little more, resulting in an increase in borrowing. Cash also increased, mainly due to setting up a new trading account with City Index.
Tuesday, April 03, 2007
March 2007 Report
All figures are in US Dollars unless otherwise stated.
Income and Expenditure

Expenditure was $2625 - 80% of take home pay ($3,299). Spending on travel boosted this month's level. 403b contributions totaled $1,792 and Roth contributions $333.33. Non-retirement investment returns were very strong again this month ($10,348). Retirement investment returns were also nicely positive ($4,315). The rise in the Australian Dollar again contributed significantly to returns.
Net Worth Performance
Net worth rose by $US16849 to $US406,544 and in Australian Dollars gained $A7812 to $A501,658. I am way ahead of my goals for this point in the year. Each month I think that I will suffer a loss and things instead keep turning out positively. The Australian Dollar again rose this month resulting in a relatively large gap between performance in the two currencies. Non-retirement accounts reached $US223,017. Retirement accounts also saw nice gains to $US183,527.
Investment Performance
Investment return in US Dollars was 3.76% vs. a 2.05% gain in the MSCI (Gross) World Index, which I use as my overall benchmark and a 1.12% gain in the S&P 500 total return index. Non-retirement accounts gained 4.87%. Returns in Australian Dollars terms were 1.04% and 2.11%. U.S. Dollar returns also beat the indices over the last 12 months:

The contributions of the different investments and trades is as follows:

The returns on all the individual investments are net of foreign exchange movements. Foreign currency gains appear at the bottom of the table together with the sum of all other investment income and expenses - mainly net interest. This month, trading conditions were tough and I made some stupid mistakes. But I still eked out a positive result for QQQQ/NQ trading ($794). The biggest gain was from Everest Brown and Babcock - an Australian listed fund of hedge funds and hedge fund management company - and from a balanced mutual fund - the CFS Conservative Fund.
Progress on Trading Goal
Trading in my US accounts netted $1,021 a 3.3% return on trading capital. The model gained 6.7% while the NDX rose 0.6%. My goal for the year is to end up with at least as much in my three accounts - regular trading, Roth IRA, and IB - as I've put into them. The accounts in total gained a net $1,096 and I have now achieved $9,048 of the annual goal of about $19,000. Since the beginning of the year the trading capital gained 41.7%, the NDX has gained less than 1% and the theoretical model gained 28.4%.
Asset Allocation
At the end of the month the portfolio had a beta of 0.33. 40% of the portfolio was in stocks, 42% in bonds, 13% in cash, and loans totalled -7%. The remainder was in hedge fund type and real estate investments, futures value etc. Looking at asset allocation the way I prefer, 22% was in "passive alpha", 66% in "beta", 8% allocated to trading, 7% to industrial stocks, 4% to liquidity, and I was borrowing 7%.
Friday, March 09, 2007
February Report
All figures are in US Dollars unless otherwise stated. Income and Expenditure
Expenditure was $1771 - 54% of take home pay ($3,299). This is the normal background level of expenditure. 403b contributions again totaled $1,795 and Roth contributions $333.33. Non-retirement investment returns were quite strong again this month ($5,777). Retirement investment returns were also nicely positive ($3,202). The rise in the Australian Dollar contributed significantly to returns.

Net Worth Performance
Net worth rose by $US12,301 to $US389,704 and in Australian Dollars gained $A8,017 to $A493,859. This is $US7,000 more than needed to be on track for my 2007 goal of a net worth of $US470k. The Australian Dollar rose this month resulting in a relatively large gap between performance in the two currencies. Non-retirement accounts reached $US212,618 or $A269,444. Retirement accounts also saw nice gains to $US177,086.
Investment Performance
Investment return in US Dollars was 2.38% vs. a 0.49% fall in the MSCI (Gross) World Index, which I use as my overall benchmark and a 1.96% fall in the S&P 500 total return index. Non-retirement accounts gained 2.81%. Returns in Australian Dollars terms were 0.78% and 1.21%. U.S. Dollar returns also beat the indices over the last 12 months:

The contributions of the different investments and trades is as follows:

The returns on all the individual investments are net of foreign exchange movements. Foreign currency gains appear at the bottom of the table together with the sum of all other investment income and expenses - mainly margin interest. QQQQ/NQ trading again yielded very strong returns ($4,026). Apart from trading and foreign currency diversification the monthly return would have been flat. The most positive contributions from investments were from Everest Brown and Babcock - an Australian listed fund of hedge funds and hedge fund management company - and from two bond or balanced mutual funds. If all my investments were in US stocks I would have had a negative month. Diversification across currencies, asset classes, and trading vs. investing generated the positive return.
Progress on Trading Goal
Trading in my US accounts netted $3,826 a 13.9% return on trading capital. The model gained 9.4% while the NDX fell 1.7%. My goal for the year is to end up with at least as much in my three accounts - regular trading, Roth IRA, and IB - as I've put into them. The accounts in total gained a net $3,374 and I have now achieved $7,702 of the annual goal of about $19,000. Since the beginning of the year the trading capital gained 36% while the NDX was essentially flat.
Asset Allocation
At the end of the month the portfolio had a beta of 0.40. 40% of the portfolio was in stocks, 43% in bonds, 13% in cash, and loans totalled -7%. The remainder was in hedge fund type and real estate investments, futures value etc.
Sunday, February 15, 2009
Commonwealth Securities Service Deteriorating
After ranting yesterday about Ford, today it's Commonwealth Securities turn. I don't like putting down companies but I feel that criticizing companies on blogs is one way consumers can pressure them to perform better. CommSec's service has shown a very sudden deterioration since the beginning of this calendar year. It's almost as bad as Citibank now:
1. I sent in a request to buy units in a Colonial First State fund (another subsidiary of the Commonwealth Bank) through CommSec. Nothing happened. I contacted CommSec and was told to contact CFS. I contacted CFS and was told to contact CommSec. They told me they had no record of my application and instructed me to send in a new application. Which I did. Two weeks later, I get a call from CommSec: "Mr Moom - the form you sent in to buy CFS funds had a different account number than that of the funds which are on your margin loan". "Um, yes, that was on purpose, I sent the application to you to avoid the 4% load I'd have to pay if I sent the form direct to CFS. But as I've already sent in another application please just cancel this one...".
2. Still nothing has happened with my second application I sent in around 2 weeks ago...
3. I requested to withdraw x thousand units of my total shareholding of y thousand EBI.AX to the new unlisted EAIT. I see online that all y thousand of my units have disappeared from my CommSec account. I phone them up and am reassured that that is just a formality and the y-x thousand units will appear back in my account after the deal closes. I just opened the letter from Everest Financial welcoming me as a new unitholder of y thousand shares in EAIT... I guess not such a big deal, except all that money is now locked up for one year...
Wednesday, July 07, 2010
June 2010 Report
The true numbers for this month will be slower to arrive than ever. Everest Financial still hasn't reported fund results for May. So I might as well go ahead with the numbers as they stand at the moment. As usual everything is in US Dollars unless otherwise stated:

Non-investment income was fairly good this month as I earned a chunk of consulting income. This month exchange rates were relatively stable. Global stock markets were down another 2.95% (MSCI World Index) and US markets 5.23% (S&P 500). In currency neutral terms we lost 5.24% and in Australian Dollar terms 5.25% in terms of investment returns, whereas investment losses in USD terms amounted to 4.53%. So exchange rate movements improved USD returns relative to AUD returns. A loss of $17-20k either way you look at it though.
Expenditure was a little high as we continued with some travel expenses. But nothing like the massive spending of last month.
Net worth fell by $US13k to $US364k (or by $A18k to $A429k). The allocation to Australian large cap stocks fell by 1.5% of assets due to the bad market. Our "private equity" investments were also badly hit. A -22% rate of return. The only positive area was real estate, finally showing some gains.
Sunday, January 07, 2007
December Report
Got back Friday from a long trip to Vermont and am getting up to speed - the coming week will be spent mainly on preparations for teaching the next semester. Good news is that Thursday I got an e-mail from my lawyer that she has received the documents to go to the next stage in my green card application - the actual application for the visa itself. The process started in 2003 and looks like being finally concluded this year. With a green card I will have much more freedom of employment and location than I do now as an H1-B holder.
Income and Expenditure

The monthly report for February explained the basic layout of these monthly statements. This month there is a new line for "tax credits". The current (non-retirement) investment returns are reported on a pre-tax basis. Part of the total return on investment includes foreign (mainly Australian taxes) paid on dividends. I get to claim these back on my annual US tax return. The "current other income" includes my net tax refunds (this category is mainly salary). If it wasn't for these credits my reported "other income" would be lower as my tax bill would be higher. Up till now I have been doing a kind of double-counting on these reports and slightly exaggerating my actual saving and income. For the moment I've chosen to compute saving by deducting both expenditure and tax credits from total income. I guess I should report all income on a pre-tax basis and then include a line for taxes. This would mean changing my accounting systems to actually record gross income monthly and then include stuff like health insurance in spending. At the moment my reported salary figures are take home pay after all deductions. So my expenditure is also somewhat under-reported too I guess...
Anyway, getting to this months results:
Expenditure was $US2,092 - $500 more than last month partly due to travel and spending on my trip to visit my girlfriend in Vermont - 64% of take home pay ($3,290) which is much reduced due to maxing out my 403(b) contributions from this month forward. Only one of my two new higher retirement contributions posted to my account and so expect to see retirement contributions ($1,180) higher next month. Non-retirement invesment returns were very strong this month ($6,564) and were the most significant factor in increasing net worth by $10,149.
Net Worth Performance
Net worth rose by $US10,149 to $US364,714 and in Australian Dollars gained $A13,322 to $A462,366. A net worth of half a million Aussie Dollars is now clearly in sight but one never knows what fluctuations could occur on the way there...
Investment Performance
Investment return in US Dollars was 2.21% vs. a 2.26% gain in the MSCI World Index, which I use as my overall benchmark and a 1.40% gain in the S&P 500. Non-retirement accounts gained 3.51%. The contributions of the different investments and trades is as follows:

The returns on all the individual investments are net of foreign exchange movements. Foreign currency losses appears at the bottom of the table together with the sum of all other investment income and expenses - mainly margin interest. Powertel again had one of the best percentage gains. The Everest Brown and Babcock entry covers returns on a listed fund of hedge funds and the management company itself which are both listed on the Australian Stock Exchange.
Asset Allocation
At the end of the month the portfolio had a beta of 0.90. 58% of the portfolio was in stocks, 45% in bonds, 7% in cash, and loans totalled -21%. The remainder was in the hedge fund type and real estate investments, futures value etc.
Tuesday, August 07, 2007
EBI Management Ponder a Buyback
I'm not the only one who thinks this investment is a bargain:
7 August 2007
ASX RELEASE
Everest Babcock & Brown Alternative Investment Trust (EBI)
EBI applies to ASIC for relief to conduct buy-back
Following the announcement of an unaudited net tangible asset backing per unit (NTA) of $4.06 as at 31 July 2007, the responsible entity of EBI announces that it is considering conducting an on-market buy-back of EBI units. It has today applied to ASIC for the appropriate relief.
As at close of 6 August 2007 the market price of an EBI unit was $3.18 being a 22% discount to the July NTA and EBI believes that a buy-back would be an efficient use of capital which would generate unitholder value.
Any buy-back is subject to ASX consultation, ASIC relief and potentially (depending on size) unitholder approval. At the time ASIC relief is obtained, the responsible entity of EBI will review the discount between the EBI unit price and its NTA and will determine its next course of action.
************************************************************************************************
The current undervaluation started with the botched capital raising in April. The capital raising raised the desired funds but resulted in a loss of net asset value to those who did not participate. This included me - I wasn't allowed to participate because I was a foreign investor. The loss of value as a result of the capital raising was very unfair. The stock price plummeted even further. More recently as hedge funds have changed from being the investment du jour to being very out of favor the discount to net tangible assets (NAV) has widened considerably.
Thursday, August 16, 2007
Carry Trade Unwinding
The "carry trade" is where investors borrow in low interest currencies and invest in currencies with high interest rates, pocketing the spread. The main low interest rate currency has been the Japanese Yen and one of the main high interest currencies the Australian Dollar (AUD). In recent months the Australian Dollar soared higher and higher and the Yen mostly lower. In the current financial crisis the process is reversing and the Aussie has fallen around 10 US cents from its peak. It's down 3.5 US cents overnight, which is a massive move in a currency:

This is having a massive impact on my net worth measured in US Dollars as around 2/3 of my net assets are in AUD related investments. At this point in the month my rate of return on investment is -9.7% and net worth has fallen $US 47,000 from last month. In AUD terms, though, the return is -1.6% and net worth is off only $A 12,000. In USD terms this is the worst drawdown since the big bear market in the early part of this decade. But in Australian Dollar terms it is nothing remarkable. I lost more in June 2006 for example: -3.3%.
I am sufferring some big losses on investments, however, especially in the Everest Brown and Babcock Hedge Fund of Funds (EBI.AX) and the management company (EBB.AX). The latter has halved from its peak. I really should have sold some when it was so overvalued. I guess irrational exuberance and a dislike of paying taxes overtook me.

As for the fund of funds itself - it trades as a closed end fund on the Australian Stock Exchange and so the stock price can trade at a discount to NAV which is only announced monthly. Undoubtedly some of the hedge funds in the portfolio have suffered losses in the current market conditions. But I doubt this justifies the steep fall in price relative to the end of July net asset value. NAV was $A4.06 on July 31st. Yesterday, the fund traded as low as $A2.48 before ending up.
Many people claim they wish to emulate Warren Buffett and buy like crazy when prices are below intrinsic values. I have been doing some of that in recent weeks but have been wary that prices could fall lower. So I haven't been "buying like crazy". It's hard in practice to actually put such a plan into action when the time comes.
Saturday, February 03, 2007
January Report
Income and Expenditure
Expenditure was $US2,515 - 76% of take home pay ($3,299). Expenditure is up this month because of paying for flights and hotels in Florida for our upcoming trip. 403b contributions now total $1,795 and Roth contributions $333.33. Non-retirement investment returns were very strong this month ($8,989) and were the most significant factor in increasing net worth by $10,941. Retirement investment returns were negative.

Net Worth Performance
Net worth rose by $US10,941 to $US377,402 and in Australian Dollars gained $A21,262 to $A485,842. This is $US3000 more than needed to be on track for my 2007 goal of a net worth of $470k. The Australian Dollar fell this month resulting in a relatively large gap between performance in the two currencies. Non-retirement accounts reached $US205,646 or $A264,735. The growth of non-retirement accounts has been very strong relative to retirement accounts recently:

The brown line shows non-retirement accounts and the green line retirement accounts. The emerging rapid acceleration in the non-retirement accounts is the reason I started maxing out my 403b. Hopefully, the strong investment and trading performance will continue but I also need to think about how to increase returns on the retirement accounts.
Investment Performance
Investment return in US Dollars was 2.28% vs. a 1.02% gain in the MSCI World Index, which I use as my overall benchmark and a 1.51% gain in the S&P 500. Non-retirement accounts gained 4.58%. Returns in Australian Dollars terms were 3.86% and 6.19%. U.S. Dollar returns also beat the indices over the last 12 months:

The contributions of the different investments and trades is as follows:

The returns on all the individual investments are net of foreign exchange movements. Foreign currency losses appears at the bottom of the table together with the sum of all other investment income and expenses - mainly margin interest. Finally QQQQ/NQ trading yielded very strong returns. The Everest Brown and Babcock entry covers returns on a listed fund of hedge funds and the management company itself which are both listed on the Australian Stock Exchange. The management company saw a large increase in share price this month. Merger candidates Powertel and Symbion also performed strongly. I also made $1170 trading Apple on the day of the evening of the earnings release. I still hold the short IYR position which is performing very badly for me.
Progress on Trading Goal
Trading in my US accounts netted $4525 a 19.7% return on trading capital. The model gained 9.1% while the NDX rose 2.0%. My goal for the year is to end up with at least as much in my three accounts - regular trading, Roth IRA, and IB - as I've put into them. The accounts in total gained $4578 which is about a quarter of the annual goal of adding $19,000. So here too, I am well ahead of my goals for this point in the year.
Asset Allocation
At the end of the month the portfolio had a beta of 0.76 56% of the portfolio was in stocks, 44% in bonds, 8% in cash, and loans totalled -18%. The remainder was in hedge fund type and real estate investments, futures value etc.
Thursday, August 02, 2007
Is That a Hedge Fund? Ouch!
Anything that might be a hedge fund, mortgage fund, or have leverage is getting sold. In some cases this is somewhat rational. Case in point: Newcastle. This is a mortgage fund run by a hedge fund company. They do have sub-prime loans and lots of leverage. But subprime loans are a minority of what they have and they have sold off a lot of what they bought in CDOs (but retained some of the worst bits). The majority of their mortgages though are commercial mortgages. Cramer listed NCT in his "dirty dozen" and a Citigroup analyst downgraded the stock yesterday. It's dividend yield has gone up to 16%. Today, the company will report its second quarter earnings. Hopefully, they will give some forward guidance.
Less rational is the selling of the Everest Brown and Babcock fund of hedge funds listed in Australia. This stock is a closed end mutual fund invested in around 20 hedge funds via a total return swap that includes leverage that is equivalent to taking on a one to one margin loan for each dollar invested. The last reported net tangible assets was $A4.07 a share and last night the stock closed at $A3.05. The company has announced that the funds they invest in have no exposure to the subprime market. The yield is 22%.
Less rational is the selling of the Everest Brown and Babcock fund of hedge funds listed in Australia. This stock is a closed end mutual fund invested in around 20 hedge funds via a total return swap that includes leverage that is equivalent to taking on a one to one margin loan for each dollar invested. The last reported net tangible assets was $A4.07 a share and last night the stock closed at $A3.05. The company has announced that the funds they invest in have no exposure to the subprime market. The yield is 22%.
Wednesday, April 04, 2007
Ex-Rights Price Correction
That's the reason for the halt in trading in EBI.AX:
"Everest Babcock & Brown Alternative Investment Trust (EBI) requested a trading halt in relation to its units earlier today following an irregularity in the theoretical ex-rights price published this morning. The price published was $3.785. EBI confirms that the theoretical ex-rights price of EBI units is $4.165 based on the close of 3 April 2007 price of $4.26 and the entitlement issue price of $4.07."
So my bet was correct. I didn't see this theoretical price. But I thought the market price was too low. A nice $A1600 in profit as a result with very little downside risk. Seems trading has restarted and the price is still at $A3.85. Hmmm.
Wednesday, May 02, 2007
April 2007 Report
All figures are in US Dollars unless otherwise stated. This month saw very strong performance, which has been the case for the last several months.
Income and Expenditure

Expenditure was $3525 - more than take home pay ($3,299) due to spending on my brother's upcoming visit to the US. 403b contributions totaled $1,792 and Roth contributions $333.33 as usual. Non-retirement investment returns were again very strong this month ($10,363). Retirement investment returns were also nicely positive ($5,615). The rise in the Australian Dollar again contributed significantly to returns.
Net Worth Performance
Net worth rose by $US17544 to $US423,791 and in Australian Dollars gained $A7451 to $A509,058. The Australian Dollar again rose this month resulting in a relatively large gap between performance in the two currencies. Non-retirement accounts reached $US232,779. Retirement accounts also saw nice gains to $US191,012.
Investment Performance
Investment return in US Dollars was 3.93% vs. a 4.48% gain in the MSCI (Gross) World Index, which I use as my overall benchmark and a 4.33% gain in the S&P 500 index. Non-retirement accounts gained 4.65%. Returns in Australian Dollars terms were 1.11% and 1.87%. The markets were extremely strong this month. My U.S. Dollar returns beat the indices year-to-date and over the last 12 months:

The contributions of the different investments and trades are as follows:

The returns on all the individual investments are net of foreign exchange movements. Foreign currency gains appear at the bottom of the table together with the sum of all other investment income and expenses - mainly net interest. Trading worked out well in the end despite some setbacks along the way. Trades around the Google and Apple earnings reports made good contributions. I again had a positive result for QQQQ/NQ trading ($527). The biggest gain was from a balanced mutual fund - the CFS Conservative Fund. Symbion began to run up in anticipation of the May 1st merger bid. Everest Brown and Babcock suffered a loss this month as the fund of funds sold off in response to the rights issue.
Progress on Trading Goal
Trading in my US accounts netted $3,248 a 10.8% return on trading capital. The model gained 6.4% while the NDX rose 5.4%. My goal for the year is to end up with at least as much in my three accounts - regular trading, Roth IRA, and IB - as I've put into them. The accounts in total gained a net $3,249 and I have now achieved $12,297 of the annual goal of about $19,000. Since the beginning of the year the trading capital gained 56.1%, the NDX has gained 6.3% and the theoretical model gained 36.5%.
Asset Allocation
At the end of the month the portfolio had a beta of 0.04. 41% of the portfolio was in stocks, 42% in bonds, 13% in cash, and loans totalled -9%. The remainder was in hedge fund type and real estate investments, futures value etc. Looking at asset allocation the way I prefer, 25% was in "passive alpha", 66% in "beta", 8% allocated to trading, 7% to industrial stocks, 3% to liquidity, and I was borrowing 9%.
Tuesday, March 11, 2008
Challenger Infrastructure Fund Receives Takeover Offer
One of my investments, Challenger Infrastructure Fund has received a takeover offer. The offer is from Arkmile Investments who already own 19% of the fund. Arkmile is associated with the British based Tchenguiz family. The offer is for $A3.50 per share, while the stock is currently trading at $A2.44. I wish I had the money to buy more, but I don't really. Anyway, this would return us nearer to net asset value which was $A4.05 at December 31st. I expect the board will try to get a bit higher offer. My average price after considering distributions received is $A2.90. So I'm underwater now but this offer if realised would result in a profit for this investment. Expect more such takeovers of undervalued exchange listed closed end funds. Another of my holdings Everest Brown and Babcock Investment Trust (EBB.AX) which is a listed fund of hedge funds is seeing accumulation by hedge funds. Ideally, I'd like to see these investments return closer to NAV and continue to be listed. Second best is a takeover of this type and an exit from the investment.
P.S.
The shares have reopened for trading, last price $A3.20. One little piece of good news in all the gloom.
P.S.
The shares have reopened for trading, last price $A3.20. One little piece of good news in all the gloom.
Wednesday, May 07, 2008
Monthly Report: April 2008
This month I'm trying out a new format, which focuses on how we are doing in meeting our annual goals. Other statistics appear towards the end of the report. All amounts are in U.S. Dollars unless otherwise stated.
1. Net Worth Goal: Reaching $500k We made progress on this goal as net worth again rose over $450k. Net worth rose by $US33,685 to $US466,625 and in Australian Dollars rose $A21,318 to $A495,461. The US dollar gain is my largest ever. USD results were strongly boosted by the rise in the Australian Dollar.
2. Alpha Goal: Alpha of 8.5% The point of this goal is to earn at least an average wage from risk-adjusted excess returns. Using a regression on the last 36 months of returns gives a beta of 0.71 to the MSCI or 0.58 to the SPX. Alphas are 5.26% and 10.32% respectively. A more sophisticated time-series method yields a beta of 0.91 and an alpha of 9.62% for the MSCI index, which meets our annual goal. The risk adjusted excess return for April based on the latter analysis was 2.58%. Multiplying this by net worth gives an income of $11,624. For the year so far the risk-adjusted excess return in dollar terms has been $21,952. Using the estimate of alpha the smoothed annual income is $43,300. In Australian Dollars terms returns are somewhat lower, while they are higher using the S&P 500 as a benchmark.
3. Increasing Non-Retirement Net Worth by More than the MSCI Index The point of this goal is to make sure that we only spend out of non-investment income and excess returns and don't use the normal market return on investments to fund spending. In other words, this makes sure we have positive saving. Non-retirement accounts rose by 10.07%, while the MSCI index rose by 5.65% So far this year these accounts have grown by 3.99% in excess of the MSCI return.
4. Achieving Break-Even on U.S. Taxable Accounts At the end of the month we were $559 from the breakeven point with a gain of $5,379 for the month. The rate of return on these accounts was 7.68%. Following the month's close we met this goal. The chart shows the remaining gap to reaching breakeven over the last year and a half:

5. Making More Money from Trading Than in 2008 Realised gains this month were $915 and so far this year $2,062. I've now had three positive months in a row. Futures trading though has not been going well, but I have been making money trading stocks and options. Last year I made $9,500 from active trading. Currently, I'm lagging behind last year's performance but I think the goal still may be achievable.
Background Statistics
Income and Expenditure

Expenditure was $3,996 in line with recent numbers. Spending included $334 of implicit car expenses - depreciation and interest. Snork Maiden was paid three times this month and Moom paid his New York State Taxes, which we treat as negative income :(
Non-retirement accounts gained $21,661 with the rise in the Australian Dollar contributing $6,201. Retirement accounts gained $11,911 but would have gained only $7,108 without the change in exchange rates.
Investment Performance
Investment return in US Dollars was 7.75% vs. a 5.65% gain in the MSCI (Gross) All Country World Index, which I use as my overall benchmark and a 4.87% in the S&P 500 total return index. Returns in Australian Dollars and currency neutral terms were 4.47% and 5.21% respectively. So far this year we have gained 2.58%, while the MSCI and S&P 500 have lost 4.04% and 5.03%, respectively.
The contributions of the different investments and trades are as follows:

The returns on all the individual investments are net of foreign exchange movements. There are no clear patterns this month in what gained and what lost. The biggest gain was in the CFS Geared Share Fund which is our biggest investment. Australian listed hedge funds such as Everest Brown and Babcock and Platinum Capital began to recover from steep discounts to book value.
Asset Allocation
I completed the switch from bonds to stocks this month and we are now as long stocks as I think we will ever be.
Allocation was 40% in "passive alpha", 71% in "beta", 3% allocated to trading, 5% to industrial stocks, 3% to liquidity, 3% to other assets and we were borrowing 25%. Our currency exposures were roughly 55% Australian Dollar, 23% US Dollar, and 22% Other. In terms of asset classes, the distribution was:

Due to the use of leveraged funds, our actual exposure to stocks was 113% of net worth.
Saturday, August 26, 2006
Adjusting Investments
It might seem like all I've been doing lately is trading. But I also have been adjusting my long-term investment positions. I am cutting back on a couple and increasing some others in an attempt to make the sizes of the different positions more consistent with the goal of having about 1.5% of net worth in each individual stock, not counting closed end funds which have shown their ability to withstand market corrections. I sold entirely out of IYS. This was originally a "corporate event arbitrage" trade -the fund was going to be wound up and was trading much below the final payout level. But recently we got a letter from Deutsche Bank saying that in order for the bank to pay us we had to agree to a settlement with the Australian Taxation Office. This introduced a risk of complications for foreign investors like me - I am an Australian Citizen but I am resident in the US. So I decided to get out now with a decent profit. I am planning in the coming week to reduce my positions in Telecom NZ and Challenger Infrastructure Fund. I've been waiting for Telecom's dividend book closing which happened on Friday. I just have too much of that stock. The latter looks like it is performing well but reading the annual report, there is a lot I don't understand about its accounting. So following Warren Buffett's maxim I am reducing my position. I have also put a bid in to buy more of Everest Capital after the destapling of this hedge fund management firm from its fund of funds which I am also invested in. Oh, and I also reduced my position in Ansell. There is probably something else I have left out. So actually I have been pretty busy.
PS: Wikipedia has a nice graphic of real UK house prices. The growth rate over the period is 2.4%. I suspect that rate will be lower when a few more years of data accumulate. And leverage doesn't make this look much better if you are paying 1-2% real interest on your loan.
PS: Wikipedia has a nice graphic of real UK house prices. The growth rate over the period is 2.4%. I suspect that rate will be lower when a few more years of data accumulate. And leverage doesn't make this look much better if you are paying 1-2% real interest on your loan.
Sunday, May 28, 2006
Portfolio Update
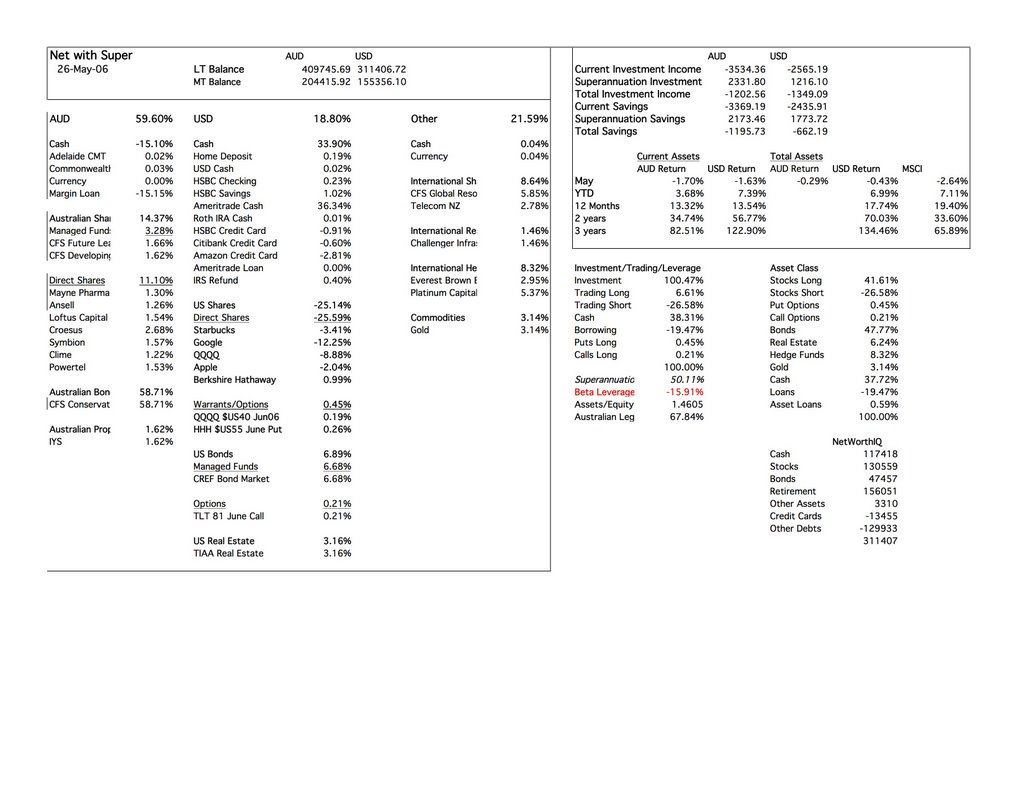
This is the first time I have provided a snapshot of the allocation spreadsheet I use to give myself a picture of my portfolio and calculate my NetWorthIQ numbers. It includes percentage allocations, summary allocations, performance figures, and total portfolio, saving etc. in US and Australian Dollars. It is based on a whole series of underlying spreadsheets. Each month I create a new worksheet like this from the previous one. That way I can compare this month to previous months. I was inspired by the worksheets George Soros provided in "The Alchemy of Finance".
I'll mainly focus on the current allocation in these comments. The main window shows the allocation of assets to securities and funds irrespective of whether they are in a retirement or taxable" account (Australian retirement accounts are taxable, but at a concessionary rate). The overall strategy which I ahve discussed is to invest 100% of assets in medium to long-term invests and then use leverage to trade. The market risk of the medium to long-term investments is adjusted slowly - preferably not more than once a year.
Main categories:
Mutual funds:
CFS (Australia), TIAA, CREF mutual funds - 78% of total. These are currently in a conservative mix - the largest amount is in the CFS Conservative Fund which is 70% bonds and cash, 30% equity related. When I think the stock-markets have bottomed I will become much more aggressive here.
Closed end/listed hedge funds/fund managers:
Everest Brown Babcock (fund of funds), Platinum Capital (listed hedge), Loftus Capital, Clime, Berkshire Hathaway - 12% of total - in the long-run I want to have much more in these kind of investments with the plan to only sell if the managers performance declines. Listed property/infrastructure adds another 3% in Challenger Infrastructure and IYS. Berkshire is really an insurance conglomerate but I think of it like a hedge fund/fund manager.
Individual stock investments:
Telecom NZ, Mayne Pharma, Symbion, Ansell, Croesus, Powertel - 11%. This is the extent of my "traditional stock picking". As I've posted, I don't do a lot of it. Mainly these are health or telecom firms. Croesus is a rather unsuccessful gold miner.
Trading:
A mix of short stock positions - Starbucks, Google, Apple, QQQQ, options - TLT, HHH, QQQQ, and gold. Any of these can be traded at any time, often intraday. Overall I end up with 46% more assets than equity. Less than half of that additional money is borrowed cash (19%) the rest is in borrowed stocks (26%). Short-selling requires holding lots of cash on deposit. That's the reason for my big cash holdings: 38% of assets. Cash outside my trading account is only 2% of assets. I have been withdrawing some profits from my trading account to my HSBC Savings Account in anticipation of paying off my credit card balances in the next couple of months (mostly zero percent). I missed out on playing this bounce in the markets in the last 3 days - I think there is another downwave to come before a more significant rally occurs. I will let you know when I get short-term bullish. However, I am not so bearish - If the stockmarket falls 10% I only stand to gain 1.6% (beta leverage) and so far I have lost money this month (0.43%) though less than the benchmark index has (2.64%).
Friday, May 26, 2006
Timing the Market
Today stock markets are rising around the world. The decline to this point hasn't received much attention outside the financial media. Some bloggers are beginning to notice though that their portfolios are taking a hit. I think that those who are selling out of stock mutual funds at this point are likely to feel better about their decision later in the year. I have been discussing the potential for a significant decline in the markets for a while now on this blog. And many others are coming to similar conclusions. As this article notes though, most individual small investors don't get market timing decisions right. And more sophisticated traders screw up too all the time :) The real solution is to invest in a portfolio of hedge funds of course and outsource that decision making. That can be hard for most individual investors. There are funds of hedge funds that take relatively small investments. The problem with many of these is that the funds willing to take investments from these funds of funds are not the superior hedge funds. Finding a good one takes some research. I know of one exception which is the Everest Brown Babcock fund of funds listed on the Australian Stock Market - sorry that isn't much use for US investors. The other alternative is a truly diversified portfolio with rebalancing and other techniques which I have discussed on this blog, here, here and probably other places.
Sunday, March 05, 2006
Berkshire Hathaway
I am reading Warren Buffett's annual letter and for a change I like what I see. I also checked the chart of Berkshire stock and maybe now is the time to buy. Both I and my Mom have been Berkshire shareholders but we both sold. I needed the money during my 2002 financial crisis and my Mom sold all her shareholdings in individual stocks after my father died.
Berkshire is the kind of stock that I am beginning to collect for a core portfolio, the aim of which is quality assets which shouldn't fluctuate too much with the stock market and can be held indefinitely for tax effective income and long-term capital gains and don't need to be traded in and out of with market conditions. Another recent buy was Clime Capital in Australia (CAM.AX). The manager of that firm - whom I met and actually applied for a job with - is a Buffett worshipper. It is basically a closed end fund and he is doing well so far with his portfolio but the stock price is far below NTA. The price has gone up since I bought. Other assets in this class I own are:
Loftus Capital (LCP.AX) - current strategy is to be a micro size down under version of AMG
Platinum Capital (PMC.AX) - effectively a listed global long-short hedge fund
Everest Brown Babcock (EBB.AX) - a security that includes a 30% share of a manager of funds of hedge funds and a share in such a portfolio of hedge funds
Challenger Infrastructure Fund (CIFCA.AX) - invests in infrastructure including gas pipelines, broadcast towers, and now bidding on a ports deal all in the UK.
All these except PMC.AX are trading below NTA.
Another thing that all these businesses have in common is that the managers have significant stakes in the shares. This is of course true of Berkshire too. Berkshire is likely undervalued relative to the assets it holds.
The TIAA Real Estate Fund might also fall into this class. At least I am thinking of it in that way.
All of them only constitute about 14% of net worth at the moment.
I am looking to add more of these type of investments in any upcoming market downturn.
Subscribe to:
Posts (Atom)