Showing posts sorted by relevance for query managed futures. Sort by date Show all posts

Thursday, January 02, 2014

Moomin Valley December 2013 Report

The Australian Dollar fell further this month from $US0.9124 to $US0.8928. This depressed gains in net worth in US Dollar terms. Net worth increased $4k to $980k In Australian Dollars we reached $1.098 million, up $A29k on last month. The monthly accounts (in USD) follow:


Other income is income not from investments or retirement contributions. It was high this month at $18.8k because both of us got three pay checks this month. Spending was normal this month at $4.8k ($A5.3k). As a result, we saved $14k from regular income.

We lost money on investments - $11.6k - mainly due to the fall in the Australian Dollar and an underlying gain of only $6.5k. Rate of return for the month was -1.19% in USD terms or +0.98% in Australian Dollar terms. The MSCI gained 1.76%, the S&P500 2.53%, and the ASX 200 gained 0.79% - the first two indices are in USD terms and the latter in AUD.

This month I subscribed to the Platinum Capital rights issue for $A7.75k, this was the largest investment move of the month. Every month we automatically add $A1k to each of mine and Snork Maiden's Australian managed fund accounts and save around $3k in superannuation (retirement) with our employers funds. I also added $3k to Snork Maiden's managed fund account - added equal amounts to property securities and fixed interest funds to rebalance things. So then the remaining saving was in cash. Strong investment performers this month were Platinum Capital (PMC.AX) and IPE.AX. The worst performing investment was Qantas. The Winton managed futures fund had a second positive month. So far, so good. Private equity, foreign stocks, and hedge funds were the best performing asset classes, while Australian stocks were weak. Next year, I think I will report our monthly accounts primarily in Australian Dollars as that is how we think about them and it seems that the Australian and US Dollar will get further apart still. Coming soon: our annual review.

Saturday, September 22, 2018

Longer Term Planning

I was rejected for the two jobs I recent applied for. One in Australia after interview and one in the UK pre-interview. So, it looks like we stay in Australia in this city for the moment. It also looks like I will continue in my job next year, but I am seriously thinking about "retiring" at the end of 2019 when I will be 55.

Hopefully, the probate situation is finalized before the end of this year and we can start to restructure our finances. This is what I am thinking to do:

1. We will need to set up a trust account or something less formal for little Moomin for the relatively small amount of money he will inherit. Need to wait to hear what we need to do. According to the will, he won't get the money till he's 23 years old...

2. Almost pay off our mortgage and then redraw it and use it to pay off margin debt and add to a trading account. We can then deduct the mortgage interest from our taxes and it is a lower interest rate than the current margin loan.

3. Set up a self-managed superannuation fund (SMSF) and roll my existing Colonial First State superannuation fund into it as well as contributing AUD 300k for each of me and Moominmama. This would then have about AUD 900k to start with. The reason to go down the road of self-managed super is to be able to invest in managed futures, which are a tax ineffective investment outside super. We would put all our high tax investments into the fund as well as some Australian shares with franking credits to reduce the tax.

4. Scale trading up to full size. At the moment, I am thinking we will need to set up a company for trading. Corporation tax on small businesses is 27.5% vs. top personal marginal rates of 47% +.* My understanding is that you don't need to pay out all profits as dividends and so retained earnings are more lightly taxed. But I will need advice on this. It would also protect the rest of our assets against something catastrophic happening. The company could also be the trustee for the superannuation fund, which would allow us to maintain the SMSF if we left Australia.** These are just my current understandings – obviously I am going to need to get professional advice on all of this.

5. Estate planning. Currently we don't even have wills. This is an area I know little about but will need to deal with. What I want to avoid is the situation we faced with my mother where the government dictated investment policy to us after she wasn't capable of making decisions - despite giving us power of attorney.

* The downside of companies is that they don't get a capital gains tax discount. Individual investors in Australia only pay half the marginal rate on capital gains on investments held for more than a year. But the advantage of only paying 27.5 or 30% tax on trading income rather than 47% tax before investing it in other investments outweighs the discount. If Labor reduce the discount, this will be even more the case.

** You can't be the trustee of an SMSF if you aren't resident in Australia. Using a corporate trustee gets around that. There is a problem in leaving Australia and receiving income through an Australian company as it means we would suffer from double taxation. In Australia, dividends from the company would have attached franking credits so that we would only need to pay the difference between 27.5% and 47% on dividends. But if you live outside Australia in a location where you need to pay tax on foreign income (obviously one reason to move might be to reduce tax...) then we would need to pay the foreign tax on top of the Australian company tax. Investments already inside the company are invested in Australian stocks that pay franked dividends, then the franking credits on the dividends received would mean that the company wouldn't pay net tax on its investment income, so that won't be double taxed if we moved overseas. But trading income would be taxed at 27.5% and then again if paid out as dividends. So, we would need to do a restructure in the most tax-effective way at that point. In an earlier version of this post, I did think about having the company being the beneficiary of a discretionary trust that actually did the trading and then just changing the flow of income. But the trustee of the fund has to pay tax for offshore beneficiaries. So, that doesn't help.

Monday, January 08, 2024

Contributions to Annual Return

I haven't formally finalized the accounts for 2023 yet. I will need to wait to get investment returns on illiquid investments that report with a long time lag. But I do have a preliminary estimate of 6.38% in AUD terms (6.64% in USD terms). This is rather disappointing as the MSCI returned 22.81%, the S&P 500 26.27%, and the ASX 200 14.45%. Our target portfolio returned 10.84%. So, why did we underperform the target by so much? The following tables analyze the returns of each portfolio:

RoR is the rate of return of the asset class and contribution is the rate of return multiplied by the share of the portfolio. The sum of contributions gives the portfolio return. The returns for the Moom portfolio are in currency neutral and unlevered terms and, so, differ slightly from the Australian Dollar return for the portfolio. The asset classes don't quite match, but it's close enough. 

The target portfolio got 2.48% returns from international stocks. The return I got from US stocks at 15.8% was less than the MSCI index at 22.5% but more importantly, my allocation to other countries resulted in a negative return and so the total contribution from international stocks was only 0.89%. 

The target portfolio got 1.73% returns from Australian stocks. Again, my return from Australian large caps was a bit lower than that of the ASX 200 but my allocation to small cap stocks had a negative return and so the overall contribution was only 0.49%.

The target portfolio represents managed futures using the Winton Global Alpha Fund. This gave a contribution of 0.59%. I also allocated to the Aspect Diversified Futures Fund and Australian Dollar futures. These dragged down returns resulting in a contribution of only 0.18%.

The target portfolio obtained a 1.61% contribution from hedge funds (based on the HFRI index), while I only got 0.25%. Though some funds like Pershing Square did very well, other Australian hedge funds under-performed.

Real Assets is the area where I outperformed. I represent this in the target portfolio using the TIAA Real Estate Fund. My allocations to other real assets resulted here in a small gain rather than a large loss.

Bonds and gold made a similar contribution to each portfolio. Finally, venture capital made an outsized contribution to the target portfolio of 4.38%. My venture capital investments lost money overall in 2023. I did much better than the target portfolio in buyout investments like 3i. But this wasn't sufficient to match the target portfolio's overall private equity contribution.

I think there is some luck here. In a different year, non-US stocks or Australian small caps might perform well. On the other hand, I also need to eventually reduce some of my allocations to Australian hedge funds that have under-delivered.


Friday, May 03, 2019

April 2019 Report

In April the Australian Dollar fell from USD 0.7096 to USD 0.7047. The MSCI World Index rose 3.18% and the S&P 500 3.72%. The ASX 200 rose 3.36%. All these are total returns including dividends. We gained 0.95% in Australian Dollar terms and 0.26% in US Dollar terms. Our currency neutral rate of return was 0.91%. The target portfolio gained 2.37% in Australian Dollar terms and the HFRI hedge fund index 1.57% in US Dollar terms. So, we under-performed our benchmarks.


Here again
is a detailed report on the performance of all investments:


The table also shows the shares of these investments in net worth. At the bottom of the table I also include the Australian Dollars return from foreign currency movements, other net investment gains and losses - net interest and fees, and trading Bitcoin futures. Trading income was USD 733 for the month, which at an annualized rate was roughly a 7.3% rate of return on capital.  At the asset class level, only real estate lost money this month. Australian small cap stocks were the best performing asset class.

Things that worked very well this month:

  • 3i, the UK private equity firm, and Generation Global shined. A few other funds beat the index. Tribeca bounced back from underperformance.
What really didn't work:

  • Cadence and Bluesky sucked. Cadence went ex dividend and I couldn't be bothered to account for this properly in my accounts, so it will do better next month when I receive the dividend. However, it fell by more than the dividend and falling in an up-market is not good. I'm still willing to give them the benefit of the doubt that they will come back again. Bluesky was probably affected by troubles at the manager, also known as Bluesky, and lack of certainty about Wilson Asset Management taking over as the new manager. 
  • I continue to be impressed by PSS(AP), where we are now in the balanced fund.
We moved away from our new long-run asset allocation * as we continued to accumulate bonds:


The main driver is continued movement of cash from my US bank account to Interactive Brokers where I am buying bonds before eventually transferring some of the money to our Australian bank accounts when the broker allows..... At the end of the month we bought 1/4 million Australian Dollars by transferring money from Falafeland. This means that we will buy new US bonds for a few months as the current ones mature rather than changing the proceeds into AUD immediately as the plan is to buy about AUD 50k per month. After the month end, I immediately made an AUD 90k non-concessional (after tax) contribution to superannuation. As I plan to roll over my retail super fund into a self-managed super fund after the start of the new financial year in July, I invested the money in the CFS Wholesale Conservative Fund.

On a regular basis, we also invest AUD 2k monthly in a set of managed funds, and there are also retirement contributions. Then there are distributions from funds and dividends. Other moves this month:

  • USD 69k of corporate bonds matured (Royal Bank of Canada)  or were called (Goldman Sachs) and I bought USD 275k of USD bonds (Tokio Marine, Anglogold, General Motors, CNO, Scorpio Tankers, Woolworths, Safeway, and Hertz). There is still more than USD 100k to convert into bonds. I also bought 245 more shares (net) of CBAPH - Commonwealth Bank hybrid securities.
  • I did some unsuccessful trading of gold futures and then bought 1000 more (net) shares of IAU - a gold ETF.
  • I did some successful trading of Bitcoin futures.
  • I sold my remaining shares in PIXX.AX and bought a small amount of OCP.AX at $1.98 a share.
* Total leverage includes borrowing inside leveraged (geared) mutual (managed) funds. The allocation is according to total assets including the true exposure in leveraged funds. We currently don't have any leveraged funds.

Monday, December 03, 2018

November 2018 Report

Volatility in financial markets continued this month but I hardly traded at all and for us it was a fairly quiet month financially with mostly background prep work. The Australian Dollar rose from USD
0.7083 to USD 0.7302 The MSCI World Index rose 1.51% and the S&P 500 2.04%. The ASX 200 fell 1.96%. All these are total returns including dividends. We lost 1.88% in Australian Dollar terms and gained 1.15% in US Dollar terms. So, we  outperformed the Australian market and underperformed international markets. Our Australian Dollar returns are now strongly driven by changes in the exchange rate as cash in US Dollars and other currencies are a large part of our portfolio. Our currency neutral rate of return was -0.14%.


Here again
is a detailed report on the performance of all investments:


The table also shows the shares of these investments in net worth. Futures contracts are at the bottom. It doesn't make sense to compute shares or rates of return for those. Things that worked quite well this month:
  • Bluesky Alternatives rose sharply after Geoff Wilson engineered the firing of most of the board and Pinnacle Investment withdrew their proposal to manage the fund. It now looks like Wilson Asset Management will end up managing the fund. Most Wilson LICs (closed end funds) trade above net asset value.
  • The Hearts and Minds IPO started trading and performed well.
  • International hedge funds: Tribeca and Pershing each did well in relative terms as did Winton.
  • The China Fund had a decent bounce and Boulder Income Fund bounced back very nicely to almost return to it's September value.
What didn't work:
  • Cadence Capital, again fell sharply. It's performance in the last three months has been very disappointing.
  • Perhaps relatedly, small cap Australian funds also performed badly.
  • Medibank Private fell sharply after the Australian Defence Department didn't renew its contract with them.
  • UK private equity firm, 3i, fell further, though it bounced from its lows.
We moved slightly back towards the new long-run asset allocation:*


Most of the change was due to the rise in the Australian Dollar reducing the value of our USD cash in AUD terms...

We also invest AUD 2k monthly in a set of managed funds, and there are also retirement contributions. Then there are distributions from funds and dividends. Other moves this month:
  • As mentioned above, Hearts and Minds began to trade and I increased my holding up to the amount I originally requested in the IPO.
  • I sold some Platinum Capital (PMC.AX) and bought the equivalent actively managed ETF PIXX.AX instead. The idea was that PMC was overvalued. So far this trade hasn't worked out.
  • I bought more Pershing Holdings (PSH.L) and 3i (III.L). Though I increased each position by 50%, each is still only around 0.8% of net worth.
  • I did a couple of trades in futures options and futures.
* Total leverage includes borrowing inside leveraged (geared) mutual (managed) funds. The allocation is according to total assets including the true exposure in leveraged funds.


Tuesday, June 02, 2020

May 2020 Report

This month the stockmarket rose at a slower pace.

This month, our spending was again low relative to pre-COVID-19. We spent AUD 5.3k which is up on April's AUD 4.6k.

The Australian Dollar rose from USD 0.6524 to 0.6647. The MSCI World Index rose 4.41%, the S&P 500 4.76%, and the ASX 200 4.42%. All these are total returns including dividends. We gained 2.49% in Australian Dollar terms and 4.40% in US Dollar terms. The target portfolio is expected to have gained 1.53% in Australian Dollar terms and the HFRI hedge fund index 1.69% in US Dollar terms. So, we strongly out-performed these latter two benchmarks and matched the MSCI return.

Here is a report on the performance of investments by asset class:


The returns reported here are in currency neutral terms. Small cap Australian stocks and hedge funds again performed best after a terrible performance in March and a strong performance in April. Hedge funds and bonds contributed most to the total return.

Things that worked well this month:
  • Regal Funds and Pershing Square Holdings were the top performing assets in dollar terms. Some other listed hedge funds (Cadence, Tribeca) also did well.
  • Gold.
  • CFS Developing Companies Fund.
  • Pengana Private Equity.
  • Domacom continued to rebound from the lows of March.
What really didn't work:
  • Winton Global Alpha managed futures fund lost 4.6%. I now have lost money overall from investing in this. Is trend-following really dead?
We moved further towards our new long-run asset allocation. The share of hedge funds rose most while the share of bonds fell most:


On a regular basis, we invest AUD 2k monthly in a set of managed funds, and there are also retirement contributions. Other moves this month:
  • Dish and Scorpio Tankers bonds matured, releasing USD 50k plus interest.
  • I invested AUD 100k in the APSEC hedge fund.
  • I bought 20,000 more shares of the Tribeca Global Resources Fund (TGF.AX). 
  • I sold 20,000 shares of Pengana Private Equity (PE1.AX) when the price rose a lot above net asset value.

Sunday, May 16, 2021

Third Point and AlphaSimplex

I don't write much on the blog about investments I evaluated but rejected. There are quite a lot of these, of course. Recently, I evaluated and rejected Third Point and AlphaSimplex. Third Point is  a well-known hedge fund managed by Daniel Loeb. Retail investors can invest in it through TPOU.L a closed-end fund on the London stock exchange. AlphaSimplex is a managed futures manager based in Boston that developed out of MIT. U.S. retail investors can invest with them through mutual funds issued by Natixis Funds. ASFYX has a USD 100k minimum and a lower expense ratio than AMFAX which has a low minimum investment. Non-U.S. investors can access them via Luxembourg based funds. There are institutional (USD 100k minimum and lower management fee) and retail classes (USD 1k minimum and higher management fee) and the funds are available in various currencies. Even the Australian Dollar! Kathryn Kaminski, their chief research strategist, was just on Meb Faber's podcast.


So, is this fund any good? And what about Third Point? Both these investments were interesting enough for me to do some proper analysis on them. These are some results using annual returns:

The period of analysis is the length of the track record provided by AlphaSimplex. All returns are in U.S. Dollars. None of this analysis deducts the risk-free-rate from returns. My returns in U.S. Dollars are not very good over the last ten years. In Australian Dollar terms they are much better.

So, it turns out that using annual data AlphaSimplex has a beta of 0.34 to the MSCI World Index and no alpha. Its correlation with the market is 0.4. Its average return was just 3.4% with a Sharpe ratio of 0.3. The Winton Global Alpha Fund has had similarly poor returns but actually has a negative beta and positive alpha. Before the 2020 debacle, Winton was a lot better than AlphaSimplex. I'm definitely not sold on AlphaSimplex.

Third Point is more attractive. However, it acts more or less like a good quality long-only fund. It's correlation with the MSCI is 0.92. It has an alpha of 1.4%. I added Pershing Square Holdings as a comparison. It has a much lower correlation to the market though it has a beta of 1.04. With an alpha of 4.3% it adds much more uncorrelated return. So, I haven't found Third Point convincing enough to add to the portfolio.


Monday, September 15, 2008

Lehman Impact


It's looking like Lehman brothers will be liquidated. The result could be worse or more worse depending on whether a systematic plan can still be concocted by the start of US trading, tonight Australian time. Stock index futures opened half an hour ago on Globex and the S&P contract is down about 36 points. A substantial break from Friday but around recent lows. If that's the worst impact then that's a pretty good outcome. No way to know at this point though whether that holds, or futures bounce back or decline further before the open 15 hours from now.

P.S. 9:51am Australian Eastern Time

ES futures have bounced a little. Australian share price index futures (SPI) are opening down about 120 points or 2.4% near recent lows.

P.S. 10:20am Australian Eastern Time

I'm into the buffer zone on my margin loan from Commonwealth Securities. This is a warning that a margin call could come if the market falls further. You can't buy any more stuff but don't have to sell yet. This hasn't happened since 2002... The All Ordinaries is only down 60 points though at the moment and when Friday's Australian managed fund values post later today I'll be out of the buffer zone again. I'm most likely to sell Qantas first if I really faced a margin call. Following that, I'd ask CommSec to redeem some of my units in the CFS Conservative Fund as it is 70% bonds and cash and 30% stocks and property.

Sunday, January 18, 2009

Janus US Short-Term Bond Fund


This is the other bond fund in my Mom's portfolio. It has done very well in recent years, though it didn't do much just after we bought it in 2003. I am trying to get access to Janus World's website to get more info - they haven't yet sent me a password but I managed to get the charts above from UBS's website. If it is similar to the short-term bond fund marketed in the US then it is heavy in US government issues which explains its strong performance recently. I'm thinking of selling half and putting it in Man-AHL Diversified, a managed futures fund that we only have a small allocation to at the moment (2.2%). Such a move move would take the allocation to Man AHL up to 7.5% and to the Janus bond fund down to 5.3%. The overall bond allocation would go down to 23% from 27% and the alternatives allocation up from 19% to 24%. Maybe I'd leave a bit in cash...

The rationale is that US interest rates are very low and many people are talking about a US bond bubble. On the other hand I think we should retain some exposure to US bonds and this fund seems pretty good. On the other hand, it is a short-term bond fund and so should be relatively little impacted by a rise in interest rates. And would be impacted in a good way if new bonds they buy have higher yields in the future?

Friday, January 18, 2019

All of Labor's Tax Increases

The Labor party is at the moment likely to win the next federal election in Australia in May. Labor has become increasingly left wing in recent years and has a long list of policies to raise taxes. This is, I think, a comprehensive list:
  1. Abolish Liberal plan to raise the top tax threshold to $200k: This was supposed to happen in 2024. The top tax bracket will still cut in at $180k (about USD130k) where it has been for many years. Bracket creep is pushing more and more taxpayers into the top bracket. This will affect us if I am still working then. If I'm not, probably my taxable income will be lower.
  2. Raise the top tax rate: Add 2% to the top rate to raise it to 47%. With Medicare that is 49%. This will immediately raise our taxes.
  3. Abolish plan to eliminate 37% tax bracket: This also was supposed to happen in 2024, so may not affect us except to the extent of how many franking credits will get used up offsetting our taxes, if I retire by then.
  4. Repeal already-legislated tax cuts for companies with turnovers of between $10 million and $50 million: Small businesses pay 27.5% corporation tax and larger companies 30%.  The government wanted to extend the low rate to larger companies. This is unlikely to directly affect us.
  5. Reduce the long-term capital gains tax discount to 25%: The discount is now 50%. This will have an immediate impact on us as we have run out of accumulated tax losses. OTOH existing investments will be grandfathered. It makes it more attractive to incorporate and pay CGT of 27.5% instead of 37.5%.
  6. Abolish refundability of franking credits: Since 2000, if you have excess tax credits from Australian companies beyond those that offset the taxes you need to pay you can get a cash refund. I did benefit from this once or twice soon after we moved to Australia and my income was low. This will have a big impact on superannuation funds in pension phase that have zero tax to pay and possibly even in accumulation phase if they have a lot of franked dividends. It will affect lower income self-funded retirees with money outside superannuation too.  Some listed investment companies (closed end funds) are already paying out special dividends to get franking credits out of the fund and to investors before the end of the financial year. On the other hand, I don't think these funds will radically restructure due to this proposal. I don't think it will have a big impact on us as I've planned to put the least tax advantaged investments like managed futures into our planned SMSF. And I expect we would be in the 32.5% tax bracket when retired. If I retire at 60 say and start a superannuation pension we could use franking credits inside our SMSF to offset Moominmama's superannuation earnings tax liability as she is 10 years younger. And then maybe we could add Moomin to the superannuation fund :)
  7. Abolish negative gearing: This is the ability to deduct investment costs beyond the earnings of an investment from other income. This mainly applies to property investors who mostly lose money in Australia in the short run, hoping for a long-run capital gain. We don't negative gear so it shouldn't affect us. Wealthier property investors who also own shares or other investments will be able to offset their losses in property against dividend and other income. So, like many of the Labor measures they mainly hit lower income investors...
  8. Tax discretionary trusts as companies: These are trusts that have multiple beneficiaries and can alter what earnings they stream to which beneficiary on a year by year basis. Actually, they are proposing to tax trust distributions at a minimum of 30%. So, it's not like a company which pays 27.5% tax in the case of a small business and then distributes franking credits. I don't see any justification for allowing this kind of tax dodging. However, I think they should just require all trusts to be unit trusts with defined shares and everyone sharing in all income. These operate just like unlisted managed funds (mutual funds). I think most discretionary trusts will just do this if it's allowed.
  9. Reduce annual non-concessional superannuation contributions to $75k: This would mean it would take us more years to make all the non-concessional contributions we want to make and means I probably should already get one in this financial year.
  10. Reduce the threshold for 30% superannuation contributions tax to $200k: Currently the threshold is $250k. The threshold includes employer superannuation contributions, so this will definitely affect me.
  11. Remove the right, already legislated by the government, of superannuants to make catch-up contributions when their super balance is less than $500,000: I don't think this is probably a big deal. It will mean stretching contributions over more years.
  12. Reduce ability to take tax deductions for additional concessional superannuation contributions: People will need to have 90% of their income or more from sources other than employment to do this. I don't understand why concessional contributions for employees are limited to salary-sacrificed contributions and you can't make more concessional contributions unless you really aren't an employee. The Liberals tried to fix this anomaly.
  13. Limit tax free pensions to $75k per year: Currently you can transfer up to $1.6 million into an account to fund a tax free superannuation pension. At a 4% initial withdrawal rate (required rate for under 65s) that is $64k per year. At 5% (65-74 y.o.) it is $80k per year. So, Labor's proposal is not that restrictive. However, if the $1.6 million earns a lot more than that a year, it will be taxed a lot more than at present.
  14. Limit deductions for tax advice to $3,000 per year: I am assuming that this won't apply to companies or superannuation funds, just to individuals. In which case, it isn't a big deal.
I think most people are probably aware of one or two of these but don't have a good idea of the extent of the proposed tax increases. A big question is whether Labor will have sufficient control of the Senate to pass all these measures.

Saturday, November 03, 2018

October 2018 Report

As I'm sure you know, this month was very volatile, which is good for trading but not for the performance of investments generally. This was a good test of our overall strategy, except that I abandoned trading after 17 October when I found the model was overfitted (and I also got ill with flu/pneumonia or something for the rest of the month). At the end of the month we received the grant of probate and so I am now adding in the inherited assets (cash and half an apartment) from the end of this month. This will suppress returns on both the upside and downside in the near future but doesn't affect the numbers for this month.

The Australian Dollar fell from USD 0.7228 to USD 0.7083. The MSCI World Index fell 7.47% and the S&P 500 fell 6.84%. The ASX 200 fell 6.04%. All these are total returns including dividends. We lost 5.30% in Australian Dollar terms and 7.20% in US Dollar terms. So, we  outperformed both Australian and international markets.

Because of the high volatility this month here is a detailed report on the performance of all investments and asset classes:


The table also shows the shares of these investments in our post-inheritance portfolio. Futures contracts are at the bottom. It doesn't make sense to compute shares or rates of return for those. Yeas, we lost a total of AUD 117k, which is our worst ever monthly result in absolute dollars. Things that worked quite well in this market crash:
  • PSSAP Superannuation fund - this fell very little, by contrast with Unisuper, which surprised me.
  • International hedge funds: Platinum, Tribeca, and Pershing, each did fairly well in relative terms. We should invest fully in these (12.5% is allocated to them in the model portfolio and 10% to Australian hedge funds).
  • Futures: Our own futures trading worked perfectly until I stopped and Winton's downside was not too bad (better than in February), but still not performing with zero or negative correlation to equity markets. Gold rose (will be a priority to invest in it). We need to get trading working, but it will take me a lot of time to do the needed research.
  • Real estate, CFS Diversified Fund etc all had more limited downside as we'd expect (estimated return for CFS Conservative Fund was negatively affected by trading).
What didn't work:
  • Cadence Capital, which fits in the (mostly) Australian hedge fund category, fell sharply. 
  • China Fund - this isn't surprising given the supposed drivers of the market correction.
  • Yellow Brick Road - I should have sold out of this when the Mercantile offer terminated

The following is table of investment performance statistics computed over the last 60 months (extended from 36 months previously) of data:


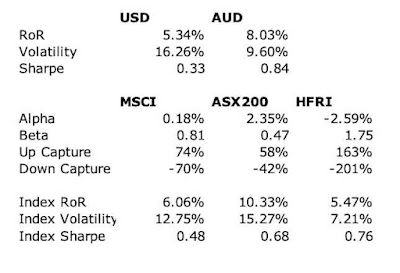
The first two rows gives the annual rate of return and Sharpe ratio for our investment performance in US dollars and Australian dollars. The other statistics are in comparison to the two indices. Based on beta, compared to the MSCI World Index we seem to be slightly geared, while compared to the Australian index we are less sensitive to market movements. We have a positive alpha compared to the Australian and a negative alpha compared to world markets. We capture more of the up movements and less of the down movements in the Australian market and the reverse in the international markets. The fall in the Australian Dollar over this period explains the poor performance compared to international benchmarks. The rate of return in USD terms is just horrible. US markets have been super strong over this period compared to the rest of the world.

This month I made USD 6k trading futures. This is the second best result to date and occurred as the NDX declined for the month. As I stopped trading partway through the month, I won't post the usual comparison of market, model, and my own performance. There seems to be potential here, but we need a system that is robust to different market conditions.

We actually moved away from the new long-run asset allocation in quite a dramatic way with the infusion of cash:


Total leverage includes borrowing inside leveraged (geared) mutual (managed) funds. The allocation is according to total assets including the true exposure in leveraged funds. All asset classes apart from cash and real estate fell as I added the inherited assets. My share of the inherited apartment is about 6% of net worth. Australian large cap fell by more as I switched out of the CFS Geared Share Fund just before the market correction got going.  Hedge funds were boosted by the addition of Tribeca (TGF.AX), which started trading on the ASX and Pershing Square Holdings, which I made a new investment in.

We also invest AUD 2k monthly in a set of managed funds, and there are also retirement contributions. Then there are distributions from funds and dividends.

Thursday, August 02, 2018

July 2018 Report

This month was the fourth month of the futures trading experiment. The first month was the model development phase, while May and June were about ironing out the glitches and training myself to trade the model properly (and not give in to gut instinct etc). In the first half of July I only traded one day and lost but model returns were good in the beginning of the month. Then in the second half of the month I got back into regular trading. Initially the model wasn't doing well but then things improved again as a short trade worked out.

The Australian Dollar fell from USD 0.7571 to USD 0.7432. The MSCI World Index rose 3.05% and the S&P 500 rose 3.72%. The ASX 200 rose 1.39%. All these are total returns including dividends. We gained 1.56% in Australian Dollar terms and 2.12% in US Dollar terms. So, we  outperformed the Australian market and underperformed international markets.

The best performing investment in dollar terms was Unisuper gaining AUD 4k closely followed by Cadence Capital (CDM.AX) gaining AUD 3.9k. The next best in dollar terms was Bluesky Alternatives (BAF.AX), gaining AUD 2.8k. The best performing asset class was "private equity", gaining 2.66%. The second best performer was US stocks, gaining 2.58%. The worst performing asset class was Australian large cap, gaining 0.41%.

The following is table of investment performance statistics computed over the last 36 months of data:

The first two rows gives the annual rate of return and Sharpe ratio for our investment performance in US dollars and Australian dollars. The other statistics are in comparison to the two indices. Based on beta, compared to the MSCI World Index we seem to be slightly geared, while compared to the Australian index we are less sensitive to market movements. We have a slightly positive alpha compared to the Australian and world markets. Finally, we now capture more of the up movements in the international and less in the Australian market and suffer less of the down movements in both the Australian and international markets.

This month I only made a small amount of money trading futures: USD 1.0k. The table compares my performance to the market and the model:


The US markets went up and then down. The model did outperform the market.* In the first week of July I didn't trade as I was in Japan and my phone wouldn't receive the text messages needed to log into the trading account. I actually received all these texts after returning to Australia! Then I traded long on a day when the futures price would suggest to be short and the index values suggest to be long and got stopped out. This made me do some more model research and revise the stops policy, though I found that index values provide better trading signals. After that I got back into regular trading trying to trade double the size but the model was losing at first. Then I started doing strategic and tactical trades, which helped psychologically.

We made more progress towards the new long-run asset allocation:


Total leverage includes borrowing inside leveraged (geared) mutual (managed) funds. The allocation is according to total assets including the true exposure in leveraged funds.

The improvement in allocation, came partly due to market movements and partly due to investment activity. We invest AUD 2k monthly in a set of managed funds, and there are also retirement contributions. Then there are distributions from funds and dividends. During the month, I also:
    • I added another AUD 10k to the Winton Global Alpha fund, increasing the allocation to commodities.
    • I added AUD 50k to the trading account and in the end was moderately successful at trading, increasing the allocation to commodities .
    • I closed a small account with Colonial First State, which was invested in the CFS Geared Share Fund, reducing the allocation to large cap Australian stocks. 
    • I rebalanced my CFS superannuation account, reducing the allocation to large cap Australian stocks and increasing the allocation to other asset classes.
    • I bought 75,000 shares of BAF.AX increasing the allocation to private equity and real estate.
    • I sold my position in PIXX.AX and bought a smaller amount of Platinum Capital (PMC.AX) and bought more as PMC fell further in price. This reduced the allocation to hedge funds.
    * The statistics at the bottom of the table are based on only 4 months of data and so are not at all reliable yet.

    Wednesday, March 01, 2023

    January 2022 Report

    In January, stock markets rebounded. The MSCI World Index (USD gross) gained 7.19% and the S&P 500 6.28% in USD terms, and the ASX 200 gained 6.23% in AUD terms. All these are total returns including dividends. The Australian Dollar rose from USD 0.6816 to USD 0.7113. We gained 2.21% in Australian Dollar terms or 6.66% in US Dollar terms. The target portfolio rose 1.45% in Australian Dollar terms and the HFRI hedge fund index around 2.8% in US Dollar terms. So, we out-performed the S&P 500, the HFRI, and our target portfolio and under-performed the others.

    Here is a report on the performance of investments by asset class:

    The asset class returns are in currency neutral returns as the rate of return on gross assets. I have added in the contributions of leverage and other costs and the Australian Dollar to the AUD net worth return.

    All asset classes had positive returns. Private equity was the largest contributor to returns Followed by hedge funds, while RoW stocks had the highest return.

    Things that worked well this month:

    • 3i (III.L) rose strongly, gaining AUD 22k. Tribeca (TGF.AX 18k), Unisuper (15k), PSSAP (14k), China Fund (CHN, 13k), and Hearts and Minds (HM1, 10k) all contributed more than AUD 10k.

    What really didn't work: 

    • Three managed futures funds all lost money, with Winton Global Alpha losing the most (AUD 4k).

    The investment performance statistics for the last five years are: 

    The first three rows are our unadjusted performance numbers in US and Australian dollar terms. The MSCI is reported in USD terms. The following four lines compare performance against each of the three indices over the last 60 months. The final three rows report the performance of the three indices themselves. We show the desired asymmetric capture and positive alpha against the ASX200 and the MSCI but not against the hedge fund index. We have a higher Sharpe Index than the ASX200 but lower than the MSCI in USD terms. We are performing about 2.6% per annum worse than the average hedge fund levered 1.75 times. Hedge funds have been doing well in recently.

    We are now very close to our target allocation. Our actual allocation currently looks like this:

    About 70% of our portfolio is in what are often considered to be alternative assets: real estate, art, hedge funds, private equity, gold, and futures. A lot of these are listed investments or investments with daily, monthly, or quarterly liquidity, so our portfolio is not as illiquid as you might think.

    We receive employer contributions to superannuation every two weeks. We are now contributing USD 10k each quarter to Unpopular Ventures Rolling Fund and less frequently there will be capital calls from Aura Venture Fund II. In addition, we made the following investment moves this month:

    • I bought 1,000 shares of the China Fund, CHN.
    • I bought 3,000 shares of Ruffer Investment Company, RICA.L.

    Tuesday, May 21, 2019

    Asset Allocation at "Peak Bonds"

    At this point we have probably finished expanding our allocation to bonds and from here the share will fall again. So, I thought it would be interesting to post a snapshot of our asset allocation here to contrast with in later posts. All the blue segments in this pie chart are equity related including the allocations to private equity and hedge funds, though only the first four are allocated to listed long-only stocks. For the first time I have split the commodities category into actual gold and futures which includes managed futures and the cash used in our own trading. Cash is money in our regular bank accounts.


    We don't include our house in the breakdown and there are also debts, particularly a margin loan and our mortgage. This is just the assets side of the picture.

    Friday, April 02, 2021

    March 2021 Report

    This month we took some big steps towards fully setting up our self-managed super fund. Trading didn't go well, but I persisted, following the rules exactly. We also reached a big round net worth number in  Australian Dollar terms. 

    The Australian Dollar fell from USD 0.7737 to USD 0.7612. The MSCI World Index rose 2.72%, the S&P 500 by 4.38%, and the ASX 200 rose 2.74%. All these are total returns including dividends. We gained 1.46% in Australian Dollar terms but lost 0.17% in US Dollar terms. The target portfolio is expected to have gained 2.00% in Australian Dollar terms and the HFRI hedge fund index is expected to gain 1.30% in US Dollar terms. So, we strongly underperformed all our benchmarks. Here is a report on the performance of investments by asset class (currency neutral terms): 

    Hedge funds added the most to performance and gold detracted the most. Things that worked well this month:
    • Three hedge funds: Cadence Capital (AUD 20k), Regal Funds, and Platinum had the largest gains this month in absolute terms. Cadence benefited from its investment in Deepgreen metals. Domacom gained 21% or AUD 7.5k.
    What really didn't work:
    • Gold lost the most in dollar terms (AUD 11k) with Hearts and Minds (HM1.AX) and the China Fund (CHN) following up. Trading the ASX200 lost the fourth largest amount AUD 6k.

    I thought it'd be interesting to look at the twelve month performance since the end of March 2020 when the stock market bottomed:

    Portfolio shares are as at the end of March and gains are the dollar gain since March divided by the value at the end of March. Hedge funds are again the star performer, but Aussie small caps did surprisingly well.

    The investment performance statistics for the last five years are: 

    The first two rows are our unadjusted performance numbers in US and Australian Dollar terms. The following four lines compare performance against each of the three indices. We show the desired asymmetric capture and positive alpha against the ASX200 index.

    We moved sharply away from our desired long-run asset allocation. Rolling over my retail superannuation funds to the SMSF resulted in a big rise in cash. Cash is the asset class that is furthest from its target allocation (12% of total assets too much) followed by real assets (7% too little):


    On a regular basis, we invest AUD 2k monthly in a set of managed funds, and there are also retirement contributions. Other moves this month:

    • Our SMSF received all approvals, and I rolled over my Colonial First State super funds to the SMSF, made an AUD 15k contribution to the fund, and applied for a brokerage account.
    • Ready Capital called their baby bonds early, reducing our bond exposure by another USD 25k.
    • I continued systematically daytrading ASX200 CFDs and futures.... Daytrading experienced a strong drawdown. I lost as much (including slippage) as the algorithm did (not including slippage) despite using a smaller position size, mainly because of one bad trade where Plus500 got me into the opposite direction trade than I should have been in. The trade in the wrong direction triggered near the open, when in the futures market you would have got into a trade in the right direction later in the day.
    • I started a calendar spread in soybeans futures. Soybeans are very strongly backwardated when usually they should be in contango. I am betting that the November and May prices will converge. They went the wrong way in March but on 1st April moved very sharply in my favor.
    • I invested USD 10k in another painting at Masterworks. I now have USD 70k invested in 7 paintings.
    • I bought 15,000 Cadence Capital shares (CDM.AX) @ $1.045 per share when they announced that their pre-IPO investment in DeepGreen Metals was being acquired by a SPAC and would list on the NYSE. The current share price of Cadence gives you this investment for free.
    • I sold 10,000 shares of Hearts and Minds (HM1.AX) @ $4.78 a share. The shares are trading at a large premium to the NAV and I felt that some of their recent picks of growth and tech stocks perhaps peaked. I still hold 25k shares.
    • I sold half our Treasury Wine (TWE.AX) position @ $11.15 a share. Now it is down to 1% of the portfolio again, which is the default allocation for an investment in a single company.
    • I bought 2000 shares of Perth Mint Gold (PMGOLD.AX) @ $22.44 and 22.56 per share. Our allocation to gold fell below the long-term weight. It is now almost exactly at 10% of gross assets.

    Tuesday, October 02, 2018

    September 2018 Report

    The Australian Dollar rose from USD  0.7201 to USD 0.7228. The MSCI World Index rose 0.48% and the S&P 500 rose 0.57%. The ASX 200 fell 1.04%. All these are total returns including dividends. We lost 0.63% in Australian Dollar terms and 0.26% in US Dollar terms. So, we  outperformed the Australian market and underperformed international markets.

    The best performing investment in dollar terms was NASDAQ futures gaining AUD 2.6k –  and the worst the CFS Geared Share Fund losing AUD 10.7k. The best performing asset class was private equity, gaining 1.28% followed by commodities (this includes trading), gaining 1.22%. The worst performing asset class was Australian large cap, losing 1.57%.

    The following is table of investment performance statistics computed over the last 60 months (extended from 36 months previously) of data:

    The first two rows gives the annual rate of return and Sharpe ratio for our investment performance in US dollars and Australian dollars. The other statistics are in comparison to the two indices. Based on beta, compared to the MSCI World Index we seem to be slightly geared, while compared to the Australian index we are less sensitive to market movements. We have a positive alpha compared to the Australian and a negative alpha compared to world markets. We capture more of the up movements and less of the down movements in the Australian market and the reverse in the international markets. The fall in the Australian Dollar over this period explains the poor performance compared to international benchmarks.

    This month I made USD 2.5k trading futures. This is the second best result to date and ocurred as the NDX declined for the month. The table * compares my performance to the market and the model:

    This month was the sixth month of the futures trading experiment. The first month was the model development phase, and since then I have been trying to get disciplined at trading and further incrementally improving the model. I didn't trade in the first half of the month as I was traveling to Europe and Singapore and the model was short and based on relatively low volatility I thought the profit potential was low. This was a mistake as the model did very well. Then when I got back into trading we were in a corrective phase with the market trading sideways. I traded long NQ short ES for the last few days of the month. The model outperformed the market this month, though its return was not that high. The model is bearish and under-performs when the market is strong and outperforms when the market is weak. It got stopped out a couple of times, which is unusual. As a result the model made 4 trades in 4 days. The second time the model was stopped out, the market ended up on the day and so the stop was too tight. The first time, the stop reduced losses.

    What I want to do next on the trading front is write the model's decision algorithm in computer code. At the moment I estimate the indicators I use with an econometric model but I then make decisions manually and record the details in an Excel spreadsheet. It is quite quick to do to make daily decisions in a single market but it is quite hard to do backtesting of different ideas. This will be much easier once we have the decision algorithm coded in the same program as the estimation model. Also, in the long run I plan to automate trading or at least automate data acquisition and decision making for multiple markets. Coding the model in the language of my econometrics program is a first step towards that. Once the model is written in one computer language, converting it to another shouldn't be hard.

    I did our tax returns this month. I should get a big refund and Moominmama had to pay a little under AUD 1,000 in extra tax. Otherwise, I am waiting for the probate process to play out before undergoing a big round of financial restructuring.

    We made a little bit of progress towards the new long-run asset allocation:

    Total leverage includes borrowing inside leveraged (geared) mutual (managed) funds. The allocation is according to total assets including the true exposure in leveraged funds.

    We invest AUD 2k monthly in a set of managed funds, and there are also retirement contributions. Then there are distributions from funds and dividends. Major moves tbis month:
    • I redeemed the Janus-Henderson Global Resources Fund, which reduced exposure to ROW stocks.
    • I reduced cash and the margin loan in preparation for investing in the Tribeca IPO. As a result our allocation to hedge funds will increase substantially next month. 
    • I added to the Yellow Brick Road position which is now about 1% of net worth.
    * The statistics at the bottom of the table are based on only 5 months of data and so are not at all reliable yet.
        

    Friday, May 24, 2019

    May 2019 Report

    In May the Australian Dollar fell from USD 0.7047 to USD 0.6930. The MSCI World Index fell 5.85% and the S&P 500 6.35%. The ASX 200 rose 1.96%. All these are total returns including dividends. We gained 0.37% in Australian Dollar terms and lost 1.30% in US Dollar terms. Our currency neutral rate of return was -0.53%. I estimate that the target portfolio gained 0.01% in Australian Dollar terms and the HFRI hedge fund index lost 1.75% in US Dollar terms. So, we under-performed the Australian stock market but outperformed our other benchmarks.

    
Here again
    is a detailed report on the performance of all investments:


    The table also shows the shares of these investments in net worth. At the bottom of the table I also include the Australian Dollars return from foreign currency movements, other net investment gains and losses - net interest and fees, and futures trading. At the asset class level, private equity was the best performing asset class gaining 1.56%. The worst asset class was rest of the world stocks.

    Things that worked very well this month:

    • Trading Bitcoin. The beginning of the month we made big profits and then towards the end of the month started losing.
    • Medibank Private. We sold out of it in the post-election rally.
    • Oceania Capital. They announced a buyback at a premium to the last share price prior to planned delisting. See below...
    • Hearts and Minds. Continued to outperform the markets.
    • Our corporate bond portfolio began to have net positive returns.
    What really didn't work:

    • Bluesky Alternatives. The parent company of the fund manager went bankrupt... See below...
    • China Fund. Got hit by the trade war.
    Trading income was USD 4,436 for the month. The rate of return on cash in trading accounts was 3.15%. We made a lot of money in Bitcoin and a little in ASX200 futures and lost in crude oil, gold, NASDAQ 100, and palladium. We were up much more in the middle of the month before a drawdown in Bitcoin. Though this month we didn't make as much as in May 2018, we are overall tracking slightly higher so far this year than in 2018, which is informally my goal for this year.

    We moved further away from our new long-run asset allocation * as we continued to accumulate bonds. But this is probably "peak bonds" in terms of their share in our portfolio, as we have finished moving money from my US bank account to Interactive Brokers:


    Buying Australian Dollars is also on hold for a while as we bought a lot last month.

    On a regular basis, we also invest AUD 2k monthly in a set of managed funds, and there are also retirement contributions. Then there are distributions from funds and dividends. Other moves this month:

    • USD 50k of corporate bonds matured (General Motors)  and I bought USD 147k of USD bonds (Tenet Health, Anglogold, Deutsche Bank, and Yum Brands).
    • We traded successfully, as discussed above.
    • We sold 3521 Medibank Private shares when the price spiked after the election. We now have no individual company stocks.
    • I bought 25,000 BAF.AX shares following the manager BLA.AX being put into administration. The board of the LIC is trying to engage Wilson Asset Management as the new manager and I think the chances of that are now better. The discount to NAV is about 36%, so even if assets managed by BLA are liquidated, I think there is a margin of safety.
    • I bought 8000 OCP.AX shares after the manager announced that they would delist and buy out minority shareholders. The announced buy out price of AUD 2.30 is much less than NAV of AUD 2.83 though higher than NTA of 1.50. So, I am still hoping that they will raise the buyout price. On the other hand, the largest shareholder owns 60% of the shares and so it seems that they can do anything they like. Only around 25% are held by non-insiders/managers. Even if they don't raise the price, it is about a 12% p.a. rate of return from my entry price to redemption.
    • I bought 2000 shares of the IAU gold ETF. 
    • We applied for the Regal Funds IPO.
    * Total leverage includes borrowing inside leveraged (geared) mutual (managed) funds. The allocation is according to total assets including the true exposure in leveraged funds. We currently don't have any leveraged funds.

    Tuesday, February 20, 2024

    When Does Our Investment Strategy Add Value?

    EnoughWealth wonders if our investment strategy only adds value under certain market conditions. As a first step let's look at when the out-performance relative to the 60/40 portfolio happened:


    The graph simply takes away the monthly return on the Vanguard 60/40 portfolio from Moom's actual results. We see there are periods of out- and under-performance throughout the period. Not surprisingly, it was weaker in 2023 in particular. I didn't do well in implementing the target portfolio strategy last year. Here is a graph comparing the performance of this theoretical portfolio and the Vanguard portfolio:


    This looks more consistent. This portfolio is theoretical because it consists of a mix of actual investible funds and non-investible indices.

    Bottom line, is I think it is a good idea to add things like managed futures, gold, real estate etc to your portfolio. It makes a real difference.

    Thursday, June 04, 2009

    HFRX up 3.15% for May 2009


    HFRX - Hedge Fund Research's daily hedge fund indices based on a small sample of funds - was up 3.15% for May. By comparison, MSCI World Index was up 10.08% and the S&P 500 5.59%. As you'd expect, therefore, equity related strategies performed well. Macro and diversified systematic (which seems to include managed futures) performed poorly. As usual, these are the first hedge fund results for the month - other indices may produce different figures.

    Wednesday, November 05, 2008

    September 2008 Report

    I'm still waiting for one final piece of data for the October report, so in the meantime here is the much-delayed September report. This report will be pretty short as I'm no longer comparing results against annual goals and there'll be more detail in the October report. Also, these results are so bad I don't really want to analyse them too much!

    Both September and October's results are heavily influenced by the decline in the Australian Dollar that took place in this period. This has the effect of reducing both our expenses and non-investment income in US Dollar terms and making investment returns in USD terms much worse than in Australian Dollar terms.

    Income and Expenditure


    Expenditure was $2,996 ($A3,674). Non-investment income of $3,618 ($A4,436) mainly consisted of Snork Maiden's salary. Retirement contributions were $539. Total investment losses were $71,412, which is a record loss. $11,648 of this was due to the fall in the AUD. In AUD terms we lost $A64,651 with a positive $8,641 contributed by the rise in the USD. The currency neutral loss is worse than the estimate of October's loss.

    Investment returns are reported pre-tax. Australian retirement account earnings are taxed at 15% (10% for long-term capital gains). A fall in the value of the account reduces the tax liability and so the actual account value falls by less than our estimated pre-tax investment returns on the account. Reduction in the tax liability on these accounts kicked in $2,756 to the change in net worth.

    Net Worth

    Net worth fell by $67,496 to $324,821 or in Australian Dollar terms by $A59,849 to $398,358. At month's end retirement accounts stood at $172,541 and non-retirement accounts at $152,280 ($A211,603 and $A186,755).

    Investment Performance


    Investment return in US Dollars was -18.2% vs. a 7.59% loss in the MSCI (Gross) All Country World Index, which I use as my overall benchmark and a 8.91% loss in the S&P 500 total return index. Returns in Australian Dollars and currency neutral terms were -14.11% and -15.23% respectively. My previous worst return was in September 2002 when the loss was 17.96% (17.13% in AUD terms).

    So far this year we have lost 29.47%, while the MSCI has lost 21.04%. We are still beating the market over 5 years and 10 years in USD terms but trailing in all the more recent timeframes.

    Asset Allocation

    Allocation was 49% in "passive alpha", 63% in "beta", 1% was allocated to trading, 8% to industrial stocks, 4% to liquidity, 4% to other assets and we were borrowing 29%. Due to the use of leveraged funds, our actual exposure to stocks was 128% of net worth. Leverage declined due to the restructuring following the margin call from CommSec. In August we were borrowing 36 cents for each dollar in equity; we are now borrowing 29 cents. Taking into account leveraged funds borrowing declined from 89 cents to 82 cents per dollar of equity. Looking at asset classes:


    We halved exposure to bonds but kept stock exposure as a fraction of gross assets constant. I've also included a tentative long-term allocation for the first time. We're not going to move our allocation towards these targets in the short-term, but they indicate where we'd like to be a few years from now. I've allocated 10% to each of bonds, hedge funds, private equity, commodities, and real estate, which is totally arbitary. We would like to have about half of total assets in these categories as against about 30% now. But I really don't know if 5% or 10% is say the appropriate allocation to private equity given the limited options available to retail investors. I am pretty sure though that more real estate and managed futures would be good.

    There is a bit more science behind the equity allocations. The Australian equity exposure is double the foreign exposure. The allocation to large cap vs. small cap reflects the 78% of Australian market capitalization in the ASX 200 stocks. The breakdown between US and rest of the world stocks reflects that 50% of world market capitalization is in the US.

    Anyway, in the next few years I plan to scale back exposure to large cap Australian stocks and increase exposure to real estate, bonds, and commodities if and when global stock markets recover. I'd also like to get overall leverage down to about 30% or so.

    At the end of September currency exposures were roughly 54% Australian Dollar, 24% US Dollar, and 22% Other and Global.