Showing posts with label Annual Reports. Show all posts

Thursday, January 04, 2018

Annual Accounts 2017


This is our annual account - the sum of each of the monthly accounts I've posted - in Australian Dollars (one Aussie Dollar is currently 78 US cents - see accounts in USD at the end of this post). First a reminder about how these accounts are laid out: Current account is all non-retirement accounts and housing account income and spending. Then the other two are fairly self-explanatory. But housing spending only includes mortgage interest. Property taxes etc. are included in the current account. There is not a lot of logic to this except the "transfer to housing" is measured using the transfer from our checking account to our mortgage account. Current other income is reported after tax, while investment income is reported pre-tax. Net tax on investment income then gets subtracted from current income as our annual tax refund or extra payment gets included there. Retirement investment income gets reported pre-tax too while retirement contributions are after tax. For retirement accounts, "tax credits" is the imputed tax on investment earnings which is used to compute pre-tax earnings from the actual received amounts. For non-retirement accounts, "tax credits" are actual franking credits received on Australian dividends and the tax withheld on foreign investment income. Both of these are included in the pre-tax earning but are not actually received month to month as cash.... Finally, "core expenditure" for housing is the actual mortgage interest we paid. "expenditure" adds back how much interest we saved by keeping money in our offset account. We include that saved interest in the current account as the earnings of that pile of cash. That virtual earning needs to be spent somewhere to balance the accounts... It is also included in the "transfer to housing". Our actual mortgage payments were less than the number reported by the $8k in saved interest. For current accounts "core expenditure" takes out business expenses that will be refunded by our employers and some one-off expenditures. This year, I think there are none of those one-off expenditures. Oh, "saving" is the difference between "other income" net of transfers to other columns and spending in that column, while "change in net worth" also includes the investment income.

We earned $201k after tax in salary, business related refunds, medical payment refunds, tax refunds etc. We earned (pre-tax including unrealised capital gains) $107k on non-retirement account investments. Both of those numbers were up strongly from last year as Moominmama went back to work and investment markets performed very strongly in the first year of the Trump Administration. Total current after tax income was $308k. Including mortgage interest we spent $101 up 7.5% from last year.

$7.6k of the current investment income was tax credits, which actually was down on last year. Finally, we transferred $50k in mortgage payments (and virtual saved interest) to the housing account. The change in current net worth, was therefore $160k. Looking at just saving from non-investment income, we saved $60k. Both these numbers were up strongly from last year.

The retirement account is a bit simpler. We made $47k in after tax contributions and the value rose by an estimated additional $126k in pre tax returns. $15k was the estimated tax on that and so the increase in net worth was $158k. Taxes are just estimated because all we get to see is the after tax returns. I do this exercise to make retirement and non-retirement returns comparable.

Finally, the housing account. We spent $14k on mortgage interest. We would have paid $23k in mortgage interest if we didn't have an offset account. I estimate our house is worth $2k more than I did last year based on recent sales in our neighbourhood. After counting the transfer of $50k into the housing account housing equity increased $31k of which $27k was due to paying off principal on our mortgage.

In total net worth increased by $350k, $135k of which was saving from non-investment sources. Comparing 2017's accounts with the 2016's, we saved 34% more and net worth increased by 61% more. Total after tax income was almost half a million dollars, up 52% on last year. It is hard to get my head around that number and reconcile it with our fairly modest lifestyle. Of course, most of it was earned in retirement and non-retirement investment accounts and it includes a lot of notional unrealized capital gains. In 2008 we had a net loss of $150k...

Here are the same accounts expressed in US Dollars:

Because of exchange rate movements "non-core" investment earnings don't translate from one set of accounts to the other at a regular exchange rate. The "core investment earnings" takes out that exchange rate movement.

Saturday, January 07, 2017

2016 Annual Accounts: Graphs

So here is how the last year looks on a graph in the context of everything since 1996:

The blue line is the sum of the other three lines. After flatlining last year, things took off again this year. Medium term balance is liquid assets, the green line is retirement accounts. Both of these and housing equity increased. Markets performed well this year and we saved more.


This graph provides a slightly different view, breaking things down according to savings and profits. I don't break down housing equity into the two components as it's not worth it yet...

Though we are making savings outside of retirement accounts and housing equity - the blue line is rising - the slope is much shallower than before we bought a house and had a baby. So, a lot of this year's increase came from profits. In the long run we have done much better with retirement than with current accounts in terms of profits.

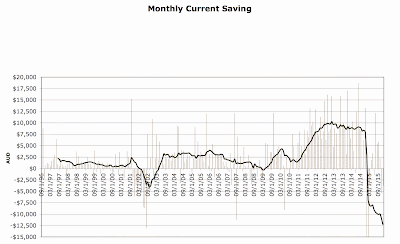
The next graph shows actual monthly non-retirement savings since 1996 and a 12 month moving average:


I have truncated the axis at -$15k but we dissaved $53k in January and $118k in February 2015 as we bought the house. After the big transfer of savings to but the house, savings recovered, but to a much lower level than recent years. They are at about the level around when we moved from the US to Australia. Savings have been high in the last couple of months. How well they will behave this year depends on some potential major expenditure on the house that I will discuss soon on the blog.

Wednesday, January 04, 2017

2016 Annual Accounts


This is our annual account - the sum of each of the monthly accounts I've posted - in Australian Dollars. First a reminder about how these accounts are laid out: Current account is all non-retirement account and housing account income and spending. Then the other two are fairly self-explanatory. But housing spending only includes mortgage interest. Property taxes etc. are included in the current account. There is not a lot of logic to this except the "transfer to housing" is measured using the transfer from our checking account to our mortgage account...

We earned $158k after tax in salary, business related refunds, medical payment refunds, tax refunds etc. We earned (pre-tax including unrealised capital gains) $58k on non-retirement account investments. Total current after tax income was $216k. We spent $77k, $71k of that was "core spending". (I always regard business expenses that are refunded as non-core, but also some one-off things).

$9k of the investment income was tax credits. These increased our after tax "other income" but are also counted as part of the pre-tax investment income. So, they have to deducted to get things to add up to the change in net worth. Finally, we transferred $45k in mortgage payments to the housing account.* The change in current net worth, was therefore $85k. Looking at just saving from non-investment income, we saved $36k.

The retirement account is a bit simpler. We made $45k in after tax contributions and the value rose by an estimated additional $54k in pre tax returns. $6k was the estimated tax on that and so the increase in net worth was $93k. Taxes are just estimated because all we get to see is the after tax returns. I do this exercise to make retirement and non-retirement returns comparable.

Finally, the housing account. We spent $20k on mortgage interest. We would have paid $25k in mortgage interest if we didn't have an offset account. I estimate our house is worth $21k more than I did last year based on recent sales in our neighbourhood. After counting the transfer of $45k into the housing account housing equity increased $40k of which $19k was due to paying off principal on our mortgage.

In total net worth increased by $217k, $100k of which was saving from non-investment sources.

Comparing 2016's accounts with the very exceptional 2015 accounts, we saved 56% more and net worth increased by 34% more. Salary and other current income was down as we would expect in a year that Moominmama didn't work (she went back to work yesterday). Of course, she got a lot of maternity and other payments and so current income was only down by 15%. Invesment income was up 18%. Expenditure was down 41% and even core expenditure was down by 18%.

* $5k of this is actually interest we saved by having money in our offset account. I count this as investment earnings and so to balance the books I need to count this as spending on the housing account and need to record a transfer between the current and housing accounts.

Friday, December 30, 2016

2016 Result and 2017 Projection

We exceeded our optimistic forecast of reaching a net worth of AUD 1.7 million by the end of 2016. The optimistic forecast for 2017 is currently AUD 2 million. Coming soon: December accounts, 2016 accounts, and more detailed projections.

Sunday, July 31, 2016

2015-16 Financial Year Return

Clime report that the average Australian balanced fund returned 2.5% for 2015-16. They argue that this was achieved largely from bonds. We returned 3.18% with an equity tilted portfolio...

Tuesday, July 12, 2016

Mid-year Forecast Update

At the beginning of the year I forecast that the best case scenario would see net worth rise to AUD 1.7 million or USD 1.2 million by the end of the year. At this point in the year the best case scenario is tracking at AUD 1.67 million and USD 1.25 million. This is because the Australian Dollar is looking more robust than it did and so I think the best case is that it ends the year at 75 US cents rather than 70. YTD we have only seen a 0.42% investment return (2.59% in USD terms), so we are tracking a bit below the most optimistic forecast from the beginning of the year.

I'm gradually putting together our tax returns as information comes in from fund managers etc. Moominmama should get a $2,700 or so refund at this point. I'm at around a few hundred dollars refund, which is likely to go negative as more info comes in.

Tuesday, January 12, 2016

Annual Report 2015: Graphs

So here is how the last year looks on a graph in the context of everything since 1996:
The blue line is the sum of the other three. Medium term balance is liquid assets. We reduced these near the beginning of the year when we bought the house and the housing equity line takes off. Then mid-year I lowered the carrying value of our house in line with the local market. After buying the house, liquid assets have been pretty much flat as saving has been low and the financial markets performing weakly. The green line - retirement accounts - was also flat in this period. The net result is that we pretty much went sideways on the blue line too since early in the year.

This marks a clear break from the steep upward trajectory we've been on since late 2011. I got my current job in mid-2011 and then the financial markets performed quite well. At that point our spending wasn't that high yet.
This graph provides a slightly different view, breaking things down according to savings and profits. I don't break down housing equity into the two components as it's not worth it yet... You can see here that current savings (blue line) have been pretty anemic since buying the house, though retirement contributions continue on their merry way. Profits have been flat on both retirement and current accounts. In the long run we have done much better with retirement than with current accounts.

The next graph shows actual monthly non-retirement savings since 1996 and a 12 month moving average:


I have truncated the axis at -$15k but we dissaved $53k in January and $118k in February as we bought the house. As you can see, monthly savings peaked at an average of $10k per month in 2012-13. From March to December this year we only averaged $1,700 per month. I hope saving will be higher than that this year, but it's not going to return to its previous level. First, we are paying off our mortgage, which doesn't count as current saving and, second, Snork Maiden will be on maternity leave. She will get her regular salary till 8 weeks after the expected birth date. Later she will receive the minimum wage for 18 weeks and otherwise not receive anything. I think other baby expenses will be like a "rounding error" by comparison.

What about investment performance? This graph compares our "accumulation index" or "total return index" to the market indices since the depths of the financial crisis stock market crash in March 2009:

As you can see, our performance is very closely linked to the Australian stock market. For a few years we lagged behind the market, but more recently we have outperformed it and now have about the same gain as the ASX 200 since the GFC. In the meanwhile, international markets have performed more strongly, at least until the last few months.

Monday, January 11, 2016

2015 Accounts: US Dollar Edition

Here are the 2015 accounts in US Dollars. The main differences are:
  • Smaller numbers for earning and spending due to the difference in value of the two currencies.
  • Negative investment income of -$US 32k due to foreign exchange loss of -$US 98k.
  • As a result almost flat net worth for the year.

Sunday, January 10, 2016

2015 Annual Accounts

This is our annual account - the sum of each of the monthly accounts I've posted - in Australian Dollars. First a reminder about how these accounts are laid out: Current account is all non-retirement account and housing account income and spending. Then the other two are fairly self-explanatory.

We earned $197k after tax in salary, business related refunds, medical payment refunds, tax refunds etc. We earned (including unrealised capital gains) $37k on non-retirement account investments. $10k of the latter was just due to the fall in the Australian Dollar. The investment number is pre-tax. Total after tax income was $233k. We spent $151k but only $92k of that was "core spending". So, I always regard business expenses that are refunded as non-core, but also some one-off things. The biggest of these was stamp duty for buying our house of $27.8k and then $13.5k of gardening. So, that is 2/3 of the non-core expenditure. Then there were moving and settlement costs.

$7.5k of the investment income was tax credits. These increased our after tax "other income" but are also counted as part of the pre-tax investment income. So, they have to deducted to get things to add up tot he change in net worth. Then there was $1k of excess contributions I made to superannuation (not by choice) that had to be withdrawn... Finally, we transferred $194k in down-payment, mortgage payments, and some building work to the housing account. The change in current net worth, was therefore -$119k. Looking at just saving from non-investment income, we saved $148k.

The retirement account is a bit simpler. We made $41k in after tax contributions and the value rose by an estimated additional $67k in pre tax returns. $7k was the estimated tax on that and so the increase in net worth was $100k. Taxes are just estimated because all we get to see is the after tax returns.

Finally the housing account. We spent $19.5k on mostly mortgage interest. We saved about $4k in mortgage interest by keeping money in our offset account. Actually that $4k was part of our "current investment return". So we have to deduct the notional spending here to balance the books. I estimate our house is worth $10k more than we paid for it based on a recent sale in our neighbourhood. So that is an investment gain. We transferred the $194k into our housing account. So housing equity rose $181k with $171k of it being transfer of savings from our current account.

In total, net worth rose $163k, of which $63k was savings from retirement contributions and saving from current earnings. 

Tuesday, January 05, 2016

2015 Outcome and 2016 Forecast

Last year I forecast that net worth would optimistically reach $A1.65 million and pessimistically fall to $A1.15 million by the end of 2015. The US Dollar range was $US1.33 million to $US800k. The result for this year turned out at $A1.50 million (USD 1.09 million). We were in the upper part of the range for both currencies though we were flat in US Dollar terms.

The Australian stockmarket didn't perform that well again, the Australian Dollar fell to 73 US Cents and we spent an even higher amount including moving house and preparing for a baby. Therefore, the result was below the most optimistic projection. I'm actually surprised how well we did do given all that!

So, now is time to forecast for 2016. The optimistic projection is $A1.7 million or USD 1.2 million assuming the Australian Dollar only declines to 70 US Cents. This assumes that Snork Maiden doesn't return to work till 2017.

The most pessimistic scenario is that the stock market falls by 20%, the value of our house falls to $A700k, and the Australian Dollar falls to 60 US cents. In that case, I estimate our net worth would be $A1.25 million or USD 750k.


Monday, January 05, 2015

Moomin Valley Annual Report 2014

The accounts for this annual report follow the same format as those in my monthly reports. Here are the accounts in Australian Dollars:

I've also added the change from last year. Salary and similar non-investment income was up 9% and spending was up 45% but investment income, saving, and, therefore, change in net worth are all down on last year. Because the US Dollar rose very strongly this year, the picture is worse in USD terms:

Investment income was negative because foreign exchange losses totalled $US93k, while core investment income was $87k.

Spending was by far at a record level. I don't expect this to be a permanent high level in the future, but definitely the trend is up.

2014 Outcome and 2015 Forecast

Last year I forecast that net worth would optimistically reach $A1.4 million and pessimistically hit $A1 million by the end of 2014. The US Dollar range was $US1.19 million to $US0.75 million. The result for this year turned out at $A1.33 million (USD 1.09 million). The Australian stockmarket didn't perform that well, the Australian Dollar fell to 81 US Cents and we spent a record amount. Therefore, the result was below the most optimistic projection.

So, now is time to forecast for 2015. Buying a house complicates things  even more. The optimistic projection is $A1.65 million or USD 1.33 million assuming the Australian Dollar only declines to 80 US Cents. The most pessimistic scenario is that the Australian Dollar falls to 70 US Cents, the stock market falls by 20%, and the value of our house falls to $A700k. In that case, we would have $A1.15 million or USD 800k.


Thursday, January 02, 2014

Moomin Valley Annual Report 2013

This year was much like 2012 career- and personal life-wise. Financially, the main difference is that the Australian Dollar fell from $US 1.0392 to $US 0.8928. This means that though it was another strong year for underlying investment returns, net worth in USD grew much more slowly than last year and in AUD terms much faster. In AUD we went from $759k to $1.097 million. In USD terms from $789k to $980k.

These are the annual accounts that sum each of my monthly reports for the year in Australian Dollars:

Non-investment income was up partly because of pay rises but also because I got some extra pay for taking on additional responsibilities at work. My pay will actually fall in 2014 as that has now ended. Also, there was quite a bit of work related expenditure refunds (see below). Investment income was twice as much this year as last partly because the portfolio was growing and investment returns were 25.6% this year vs. 16.9% last. It is hard to imagine that they will be this good again in 2014. As a result comprehensive income came in at $444k. Remember that this is an after tax result (mostly - investment earnings are computed pre-tax), also that $162k is locked up in retirement accounts.

Spending was at a record level of $88k. About $11k of this was work related etc. spending that was refunded. We did a lot of travel and recently started private health insurance. I estimate that if we were maximally frugal we could have spent just $49k, which is the item marked "needs" above.

As a result, net worth rose $339k. Saving from regular income was $109k.

Wednesday, January 01, 2014

2013 Outcome and 2014 Forecast

In Australian Dollar terms we came in above the top of 2013's predicted range for net worth of $A700k-$A1 million with a final net worth of $A1.098 million. In US Dollar terms the forecast was $500k-$1 million and we ended at $US980k, very close to the top of the range. For this year, my most optimistic forecast is $A1.4 million, which assumes that the Australian Dollar falls to 85 cents and the stock market does well again. The least optimistic forecast is $A1 million which assumes a significant fall in the market and the Australian Dollar at 75 cents. The corresponding US Dollar range is $US1.19 million to $US0.75 million.

Wednesday, January 02, 2013

Annual Review 2012

This year was less eventful than last year, but I was very busy, mainly with my career and a few international and domestic trips. We also put a lot of effort into looking for a house, but didn't decide on anything. Snork Maiden got her job turned into a permanent position. She was recently shocked to find out that she is now earning $A93k per year. And that's not counting 15% superannuation contributions from her employer :)

The last couple of years' career events and a reasonable investment market meant that we hit new records in income and net worth. This is the annual accounts that sum each of my monthly reports for the year:
The numbers are on an after-tax basis but investments are shown pre-tax and any tax refunds or payments are reported under "other income" which otherwise is mainly from salary. Also the investment returns include tax credits, which reduce our tax bill but don't add to net worth directly. Therefore, these have to be deducted to get to net worth changes. It's an odd way of accounting, but it is the easiest one to put together and it works for me :)

The non-investment income after tax totalled $180k with an additional $40k in retirement contributions. Total investment income was $113k with almost all of it being "core income" and not just the result of exchange rate movements. Spending was actually a few hundred less than last year, so no new record there. That's despite giving $5,000 to Snork Maiden's parents which I counted as spending.

I closed my Roth IRA due to a bungle by Ameritrade. This results in the transfer of $9k from retirement to current accounts. So, we saved $A106k from non-investment income for the year, or $8,800 per month vs. $6,200 in spending per month. That's a record high savings rate, but only 1% higher than in 2006! I only spent $25.7k back then. I was single and lived in the US in a cheap area.

Investment rate of return for the year in USD terms was 18.76% vs. 16.8% for the MSCI. In Australian Dollar terms we made 17.14% (18.11% in currency neutral terms). After the last several years it's good to be making money and doing better than the market.

Sunday, July 01, 2012

Half Year Report

These accounts are for the first six months of this year in Australian Dollars:


As they even out the month to month volatility they are perhaps a bit easier to get the big picture from. The first two numbers on the top row are after tax salary etc. and retirement contributions. After that we have non-retirement investment income which netted out to $174. Snork Maiden said: "At least it is positive!". Retirement accounts did a lot better on investment income. We spent $33k which means we saved $54k from the non-retirement stream while retirement accounts rose $26k. The savings rate from regular income is then 62% with roughly 70% of spending on "needs" and 30% on "wants". We can save around $100k per year at the moment ($9k per month) which is much more than enough for the increased housing expenditures that would come with the kinds of houses we are looking at (about $4k higher a month).

Thursday, January 12, 2012

Annual Review: Part III

This is what happened to asset allocation over the year:


Cash and bonds went up and large cap Australian stocks went down. This is due to market weakness and a purposeful policy of increasing liquidity in recent months. The large cap Aussie stock weighting fell from 51% last December to about 43% now. In the long-run for diversification reasons I'd want to get that smaller still but it is hard to resist the benefits of franked dividends.

Saturday, January 07, 2012

Annual Review: Part II

Not sure how serious this annual review is going to be. I'm just going to post what I feel like. This is what happened to net worth in Australian Dollars over the course of the year:


We ended the year with somewhat higher net worth but retirement savings actually declined while non-retirement savings overtook retirement savings for the first time since the onset of the financial crisis. This trend will continue this year, I think. Maybe once I turn 50 I might increase retirement savings above the tax concessional level * as the money can be accessed from age 60.

This chart shows underlying story:


Persistent saving throughout the year in both types of accounts and persistent investment losses at a similar rate on both.

*$A25k a year for each of us can go in after 15% tax. Contributions above this rate are taxed at our marginal rates.

Wednesday, January 04, 2012

Annual Review: Part I

It was a big year careerwise. I got a permanent job in Australia after working temporarily for the same department between January and August. I was promoted to the top rank. Snork Maiden is still trying to turn her position into a permanent one. She has an interview later this month for that purpose. Still this meant that our income (not counting investments) reached a record high this year and will likely be even higher next year:


This table is based on my monthly reports. The numbers are in US Dollars. The USD/AUD exchange rate didn't move much over the year as can be seen from the line labelled "Forex". Salary etc. came in at $165k for the year. This is after tax. Retirement contributions were $35k for a total of nearly $200k. Investment generated a loss of $92k (pre-tax). 9 out of 12 months saw losses. A pretty dispiriting year. On the other hand we saw the highest percentage gain ever in October. More on investment performance in an upcoming post. Expenditure was $75k or more than $6k per month. This does include some travel that was later reimbursed. In AUD terms total expenditure went up from $A62k in 2010 to $A71k. So there may be some lifestyle inflation there... But non-investment income doubled so it was a lot less than the income gain.

In the end net worth rose by $36k to $535k for the year or $A33k to $A522k.