Just was checking out the McClellan Oscillator and Summation as I do most days. One of the most powerful tools for medium term trades of the indices and determining overall direction in the markets. At the moment the oscillator is getting pretty extreme to the downside showing a short-term bottom in the market is near. Did several trades today, ending with my Ameritrade account more to the long-side. Only one short now. I don't post all my trades here by any means. Just a few to explain my thinking on investing and trading.
I am expecting the markets to rally here till the end of the month. Based on the McOscillator and other technical indicators and looking at a lot of different securities and Elliott Wave Theory. My short term trading is mostly on technicals and the macro picture. A few news stories about individual stocks (like GOOG). But I won't trade if I don't see a good technical set-up as well as the story.
Thursday, March 09, 2006
Wednesday, March 08, 2006
Unexpected Returns

Received the copy of Unexpected Returns by Ed Easterling I ordered from Amazon and started reading. The book looks at longer term cycles in the stock market and the justification for hedge fund type investing instead of buy and hold. Buy and hold works in the long bull markets such as from 1982 to 2000 in the US, but maybe we are now in a protracted sideways bear period as occurred in the 1960s and 1970s and buy and hold could provide dividends and interest but little long term capital appreciation.
Monday, March 06, 2006
IYS
Just bought some shares of "Infrastructure Yield Securities" (IYS.AX). This is listed on the Australian Stock Exchange but is actually a complicated real estate investment. I originally bought some in the IPO in 2000 but had to sell in 2002. They have certain tax advantages. But what is interesting now is that there is an offer to roll up the fund with a final distribution greater than what I just paid. And there should be a scheduled distribution still for this month. Seems an interesting trade. There never was great interest in these securities. Deutsche Bank never managed to issue all of them despite the very high after tax yields they offered. This would qualify for my "core investments" I discussed recently if I didn't think the scheme was soon to be closed. So I am considering this a trade. For my NetWorthIQ pages I am listing this as a stock as that is how it is listed on the exchange.
Moomins
So why the names Moomin Valley and moominoid? The moomins are characters in the books (and other spin-offs) created by the Finnish (but Swedish speaking) author Tove Jansson. They live an idyllic life of leisure and adventure in Moomin Valley. They don't care too much about material things but like a comfortable life. They don't care what other people think about them. They don't appear to do any productive work. They are very open-minded and caring about other creatures they encounter. I seem to have a lot in common with a couple of the characters and I guess my dream is to live a life as happy as that of the moomins.... So the aim of getting rich is not for material benefits but in order to live a life more like that of the moomins :)
Sunday, March 05, 2006
Berkshire Hathaway
I am reading Warren Buffett's annual letter and for a change I like what I see. I also checked the chart of Berkshire stock and maybe now is the time to buy. Both I and my Mom have been Berkshire shareholders but we both sold. I needed the money during my 2002 financial crisis and my Mom sold all her shareholdings in individual stocks after my father died.
Berkshire is the kind of stock that I am beginning to collect for a core portfolio, the aim of which is quality assets which shouldn't fluctuate too much with the stock market and can be held indefinitely for tax effective income and long-term capital gains and don't need to be traded in and out of with market conditions. Another recent buy was Clime Capital in Australia (CAM.AX). The manager of that firm - whom I met and actually applied for a job with - is a Buffett worshipper. It is basically a closed end fund and he is doing well so far with his portfolio but the stock price is far below NTA. The price has gone up since I bought. Other assets in this class I own are:
Loftus Capital (LCP.AX) - current strategy is to be a micro size down under version of AMG
Platinum Capital (PMC.AX) - effectively a listed global long-short hedge fund
Everest Brown Babcock (EBB.AX) - a security that includes a 30% share of a manager of funds of hedge funds and a share in such a portfolio of hedge funds
Challenger Infrastructure Fund (CIFCA.AX) - invests in infrastructure including gas pipelines, broadcast towers, and now bidding on a ports deal all in the UK.
All these except PMC.AX are trading below NTA.
Another thing that all these businesses have in common is that the managers have significant stakes in the shares. This is of course true of Berkshire too. Berkshire is likely undervalued relative to the assets it holds.
The TIAA Real Estate Fund might also fall into this class. At least I am thinking of it in that way.
All of them only constitute about 14% of net worth at the moment.
I am looking to add more of these type of investments in any upcoming market downturn.
Saturday, March 04, 2006
Income and Expenditure
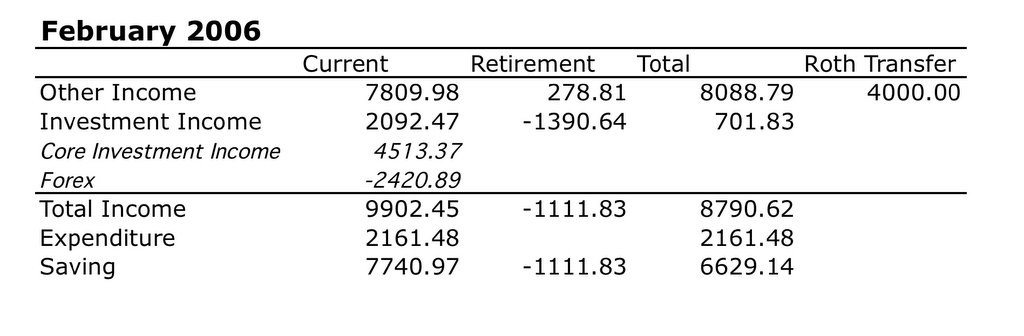
The table shows my income, expenditure, and saving for February. "Other income" includes salary and this month, for example, my expected IRS refund. Retirement "other income" are the contributions to my 403(b). I also contributed $4000 to my new Roth IRA which is a transfer from current savings to retirement savings and so isn't counted under retirement income which are pre-tax contributions. Investment income for current assets is broken down into the core investment earnings - realised and unrealised capital gains, dividends, and net interest etc - and foreign currency movements. The final total saving figure should equal the change in my net worth.
The key thing is my savings rate is around 75% from total income this month. This really is the trick to building net worth fast. Of course, there have been months when total income is negative, so this isn't neccessarily a very typical figure, but certainly not unusual.
Unlike some bloggers out there I don't work hard at avoiding spending. I am single and live in a cheap area. My rent is only $600 in the nicest building in my downtown. I don't own a car. I am naturally pretty frugal I think. Things I focus on more are trying to increase investment income and maximizing tax efficiency.
I probably don't really NEED to save much aside from those 403(b) contributions in my particular circumstances. My dream is though to get to independently wealthy status earlier than I otherwise would.
Friday, March 03, 2006
Alpha and Beta

Just updating my spreadsheets ready for March which includes reporting on performance etc. I keep track of the two best known parameters in modern portfolio theory - alpha and beta. The chart shows my alpha and beta estimated over the 36 months preceding each data point. So March 2006's data point is based on a regression from April 2003 to March 2006 on monthly data. The regression compares my portfolio performance to my MSCI World Index benchmark. Alpha is reported as the annual risk adjusted rate of return by which I exceed the benchmark index.
The interesting thing about this is that recently my alpha has been very positive - i.e. adjusted for risk I easily beat the market. The other interesting thing is that alpha is rising over time. This is a beautiful example of a learning curve :)
Another Wild and Wooly Day
In trade in Google stock. I was long and added shares before the big run up and then was short when it started to fall. Couple of missteps since and ended the day short 50 shares and my Ameritrade account up $1600 or so. This chart is from the Ameritrade Streamer:


Thursday, March 02, 2006
February Investment Performance
Calculated my investment return in February: a measly 0.24%. But the MSCI World Index (Gross including before tax reinvested dividends - which is the benchmark I measure myself against) was down 0.11%. So I beat the index (not unusual...). My performance was mainly affected negatively by the fall in the Australian Dollar over the month. In Aussie Dollar terms I was up 2.14%. The biggest positive contributer was trading in Google. The net result of everything else was a slight negative (before foreign currency adjustment).
Wednesday, March 01, 2006
A Very Different Day
Today the stockmarket has been very volatile and in particular GOOG and the rest of the internet sector. I went into the day short GOOG and shorted more. Initially the stock went against me. But then it just collapsed - amazing to see. The CFO said something negative about growth. I didn't get the full down move. I bought to cover more than $10 from the bottom. Since then I have been doing a rapid succession of long and short trades and am up thousands of dollars on the day. Most daytrading days are not like this. This is very unusual! If I had been long it would have been disastrous - even with a stop in place it might take a while to fill while the stock was falling dollars per minute...
Most of my other positions are down so I am up about $2000 on my Ameritrade account at this point in the day...
It's the end of the month and in the next few days I will work out my accounts and investment performance for February. More on that then. Looks like I am now $24,000 towards this year's net worth goal.
Tuesday, February 28, 2006
More daytrading and mutual funds
Today I did a couple more GOOG trades. Buying 80 GOOG, selling 100, shorting 80 and then buying back 50. So I ended the day short 30 GOOG. The first trade made about $180 and the second lost about $20. This is pretty typical of daytrading I think. Trading tens of thousands of dollars of stock for a couple of hundred dollars gain. Nothing glamorous. But if you worked at it every day and made $200 a day, that is $50,000 a year... I trade purely on technical analysis. A mixture of my own proprietary indicator, the basic indicators any charting program gives you - stochastics, MACD etc. - and Elliott Wave and traditional pattern based TA. You have to synthesize all that data together.
On mutual funds, yesterday I downloaded the last few months of prices for several funds in the Australian funds family I am invested in (Colonial First State). I analyse the funds I actually own plus some others I might think of buying. The analysis includes looking at how they perform in up and down markets, a correlation analysis, and a crude estimate of "alpha".
The correlation analysis is just the correlations computed using Excel of their daily rates of return over a five year period. To compute alpha, I regress the daily returns of each fund on the returns of their Diversified Fund.
Most of the funds I tested with the exception of their "High Growth Fund" have positive alpha relative to the Diversified Fund - i.e. adjusted for risk they outperform it. I don't even bother analysing their international stock funds. Those are so lousy it isn't even worth it - they are a top manager of Australian and resource stocks but not of general international stocks.
The update pretty much confirmed my previous analysis that the Future Leaders, Developing Companies, and Global Resources Fund have a relatively low correlation to each other and to the Conservative, Diversified, Imputation, and Geared Funds. The Geared Share Fund borrows on margin to buy Australian Shares and otherwise is pretty similar to the Imputation Fund. The Conservative Fund is 30% stock and 70% bonds and cash. These four funds are fairly highly correlated with each other and Conservative, Geared, and Imputation outperform Diversified. Therefore, my market timing strategy includes having the core of my portfolio in either the Geared Share or Conservative Fund and maintaining positions in Future Leaders, Developing Companies, and Global Resources for diversification purposes.
I perform a similar analysis also on my TIAA-CREF funds. Currently I hold CREF Bond Market and TIAA Real Estate in my 403(b). Neither has a high correlation with each other or much correlation with the general stock market or my own performance.
My own performance using monthly data has about a 50% correlation with the MSCI global index and in the last three years strong and increasing alpha. This is good news it shows I am improving in skill. Maybe if I could be bothered I could be a hedge fund manager :)
Sunday, February 26, 2006
Tax Day
8:30pm
Decided to do my tax returns today... I do them myself and use Excel to keep records and calculate. This year I added to my spreadsheet, worksheets for each of the six federal tax forms I need (1040, A, B, C, D, and 4952). Took about 4 hours to do the federal form. Most of the work is done by record keeping on those spreadsheets throughout the year, which I improve from year to year. So why learn Quicken or something? My expected federal refund is $3745 - about double last year. I'm including the expected refund in my net worth from today. I don't count my implicit tax assets and liabilities though as it is too much hassle to calculate.... and the value is uncertain depending on future tax rates, AMT etc....
Something interesting was figuring whether I needed to do the form 6251 for the AMT. If I had managed to reduce my tax bill by about another $3000 I would have to fill that form. $10000 of mortgage interest and property taxes would about do the trick I figure... That's not a very expensive property.
Now about to have dinner and then do my state return which should be pretty quick.
11:25pm
OK done my state tax now - no spreadsheet needed just the calculator on my Mac and my federal return....
I ended up owing the state government $5.92 :(
That is the first time in my life that I have had to pay any government rather than get a refund!
Saturday, February 25, 2006
Daytrading
Some times I do a daytrade for fun. Today I traded Google. Bought 70 shares alongside the 30 I already had and then at the end of the day I sold 80 for a small profit. There were a couple of opportunities during the day to make a few hundreds of profit and I missed them :( Oh well, at least I ended up by a few tens of dollars...
The money for the trade was borrowed on margin using "day-trading buying power". This means you have to close the trade by the end of the day or get a margin call... so it really is pretty much educated gambling on how fast the stock will move in the direction you expect.
The money for the trade was borrowed on margin using "day-trading buying power". This means you have to close the trade by the end of the day or get a margin call... so it really is pretty much educated gambling on how fast the stock will move in the direction you expect.
Friday, February 24, 2006
Americans' Net Worth Trends
This article shows just how unusual most of the posters on NetWorthIQ who have multiple entries are:
http://money.cnn.com/2006/02/23/pf/consumer_fedsurvey/index.htm
Most show strongly rising net worth. However the median of all posters at $79500 is not that far from the national median of $93000. It is pretty obvious that people making an effort to increase their net worth are the types to track their progress on such a website...
Goals
The net worth goals might seem rather high and they do depend on everything going right.
The goal for this year is based on:
Current savings from salary: $20,000
Retirement contributions: $7,000
Investment returns: $30,000
Inheritance: $20,000 ($7,000 of which has materialized the other is a guess of the value of my share of a land sale)
Exchange rate change: $23,000
I'd be happy with a lot less - say a $50,000 gain instead of the $100,000 gain. But with $16,000 added to net worth so far this year I am right on track for the $100,000 goal.
The decade-end goal is dependent on there being a new stock bull market in 2007-8. This is what I expect based on the four year stock cycle. Based on the 2002-5 bull market I could double whatever wealth I have at the beginning of such a bull market. If that happens, the $1 million goal will not be so hard to achieve.
At the moment I am mainly trying to preserve capital against a potential downturn this year. You have to be very daring and right to make money in a down market...
Trading
Difficult trading environment at the moment. My trading positions are pretty much hedged between long and short at this point. Last night took a hit on my News Corp puts... this morning news from Toll Brothers is good as I am long WLS (William Lyon Homes). Nursing a long Blackrock (after trading it both ways last week). Was expecting a bounce on technicals.... Short SBUX very bad.... Long AAPL, HHH, and GOOG doing great. This morning AAPL announced new product announcements coming on Feb 28. Short DCX has been bad up till the last few days when plenty of analysts downgraded the stock...
On the investment side my current positions are pretty conservative with a bias towards bond mutual funds and listed hedge fund type investments. More on all this at month end.
PS 3pm - bought an extra 100 shares of AAPL
On the investment side my current positions are pretty conservative with a bias towards bond mutual funds and listed hedge fund type investments. More on all this at month end.
PS 3pm - bought an extra 100 shares of AAPL
Thursday, February 23, 2006
This and that
A great blog on the world markets, investment strategy, and China, from one of my old friends at Silicon Investor:
http://worldmarket.blogspot.com/
The Australian Dollar has been going down and foreign currency has a big impact on my net worth calculation. This month so far I am down $US 1,000 but up approximately $A 9,000...
http://worldmarket.blogspot.com/
The Australian Dollar has been going down and foreign currency has a big impact on my net worth calculation. This month so far I am down $US 1,000 but up approximately $A 9,000...
Thursday, February 16, 2006
Long Term Net Worth
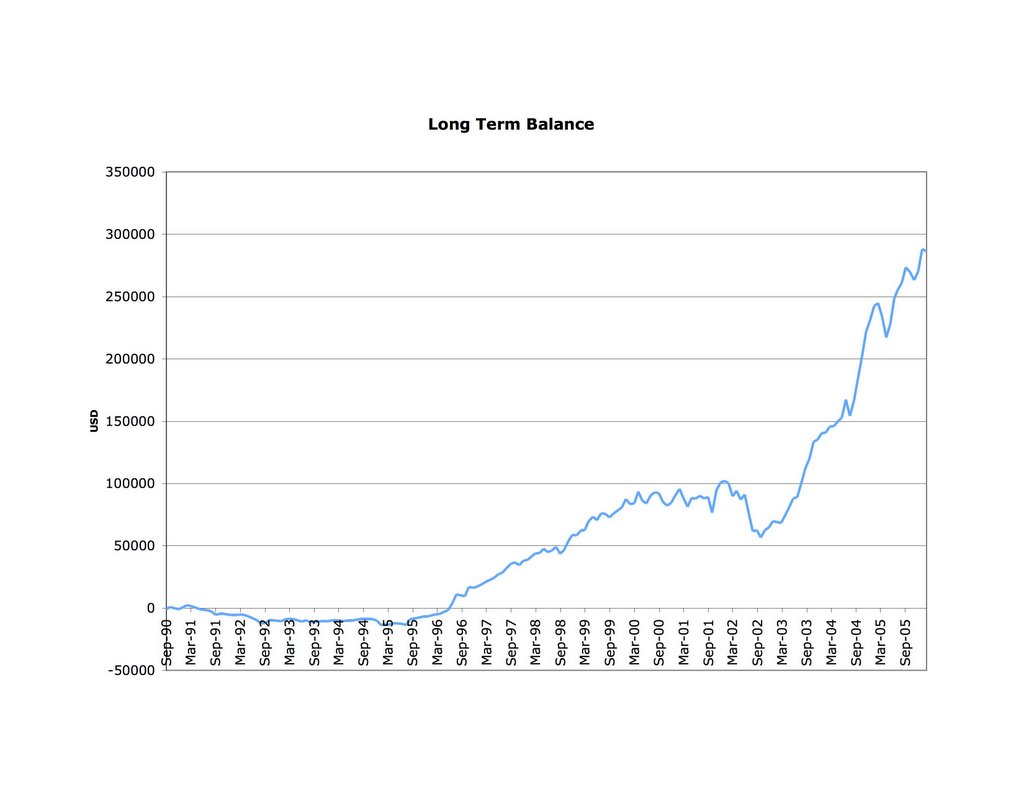
This chart shows my net worth in the 12 years or so before NetWorthIQ's accounting starts. Starts with a period as a grad student and post doc where I go into and then out of debt and then a gradual increase in the last ten years. Big dip in 2002 due to no employment, a crashing stockmarket and a worldwide job search. Flew more miles that year including two round the world trips in the first three months of the year than I did before or since... Rate of accumulation since moving to the US (in 2002) has been faster than in Australia (1996-2002) where I earned less.
Welcome
This is my blog - I just got it so I can answer other blogs - I will probably occasionally post some personal finance stuff here to complement my profile on NetWorthIQ.
Subscribe to:
Posts (Atom)