I just did some forward simulations on my NDX spreadsheet using my autoregressive indicator. There is the potential for a massive crash in coming days and weeks. I can't forecast a crash with the indicator, all I can do is plug in some values for the index and see whether the indicators they yield make any sense. Basically the model finds turning points. So if I plug in a number for tomorrow or next week or whenever and it yields a turning point value (greater than one) then I know that is a bottom or top. Very large declines are now possible before the bottom is reached. This wasn't possible even a couple of days ago, but the last couple of days' rally has loosened things up and the index has come to a potential top turning point on my weekly spreadsheet.
For those of you who remember, I reckon the current juncture has some of the feel of Fall 1987. Read the discussion of the crash in the Alchemy of Finance. Interest rates and the US Dollar played a key role in the crash. In fact the current NDX chart and the SPX chart from that period are uncannily similar in appearance:
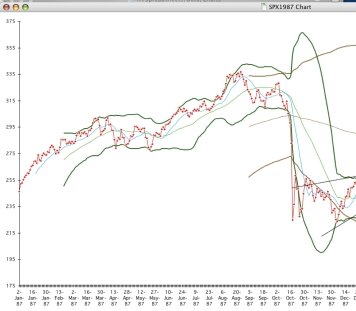
Now check this.
Of course this isn't a forecast. Nothing may happen. Or perhaps it will.
5 comments:
I think I understood about 40% of this post. I hope your students understand more of what you say (haha). I'm just starting to learn some basic technical analysis myself.
Hi -I have a whole class to explain things to them :) The main point is the situation is a lot like in 1987 with the addition of record oil and other commodity prices. I didn't put down all the charts and other stuff - not forecasting there will be a "crash" but good chance there will be.
I think your concern about t acrsh is well taken. Many things go in the wrong direction for the stock market - interest rates, price of commidities and gold, energy, federal deficit to name a few. I remember 87 still - it was good to be in cash or at least have some cash on the sidelines then. i plan on boosting the cash in my portfolio by selectively selling positions.
I have a innate ability to get into markets right before they drop and get out right before they go up...so I believe you may be right considering I'm thinking about re-shifting my assets soon. Now I may just wait...even if I don't make 10% returns, at least I know my money will be returning 4% in a savings account!
Thanks for your comment! Moving everything sharply in one direction or the other is often a bad move or hard to get right unless the market just crashed sharply. Generally I gradually adjust exposure to the market. Bob Brinker is a financial radio host I respect somewhat - he recommends at this juncture that if you want to get into the market do it via dollar cost averaging. Don't put in the money all at once - that way you get to buy more shares at cheaper prices if prices fall. Back in March 2003 he issued a buy signal. For someone just starting off investing and saving from a paycheck it can make sense just to dollar cost average over time. For someone who has built up a lot of assets compared to what they are currently put in thinking about moderate market timing seems to make more sense.
Post a Comment