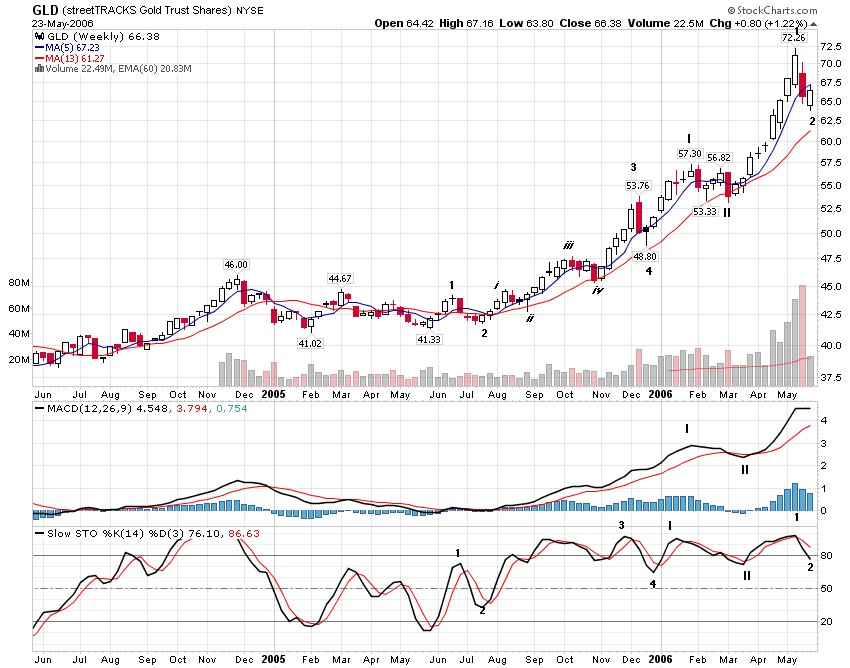
The count as posted means that the next move in gold is the third wave of the third wave up since mid 2005. That means that the move since then is less than half complete at this point. 3rd of 3rd waves are often very strong. Even if my exact count since mid 2005 is wrong the chart shows that using E-Wave principles we have to conclude that gold has not yet reached a final bull market peak - up waves must have 5 or 9 (or 13 etc.) subwaves and at the moment we only seem to have 8 at the most - the five subwaves of what I've labelled wave I and then II, 1, and 2. Elliott Wave theory is a very important tool in my technical analysis - both of long term trends and in intraday trading. It takes a lot of experience and skill in pattern recognition to use it properly. I find I get much better results by combining it with other forms of technical analysis and for the longer term analysis combining technical analysis with fundamental analysis and macroeconomics. Most E-Wave practioners think that the latter is tantamount to sacrilege. This doesn't make any sense to me. I also try to understand the relations in the patterns of different markets and securities. In general the more data point in the same direction the more reliable the result is likely to be.
3 comments:
So what's your take on the near term gold price in the next month? I am really interested in finding out what you have to say.
Frugal - gold is again retesting the recent lows this morning - still I expect it will likely go up from here.... of course I could be wrong...
At this point it is hard to tell if gold has made 5 waves down or 3 down and then 2 up...
http://stockcharts.com/h-sc/ui?s=GLD&p=D&yr=0&mn=1&dy=0&id=p07174790686
The former would mean we should expect a bounce for a week or two and then new lows. The latter would be much more bullish...
Post a Comment