Showing posts with label Modeling. Show all posts
Showing posts with label Modeling. Show all posts
Saturday, July 28, 2007
That Was a Bad Idea
It was a very bad idea to put so much reliance on an essentially untested or minimally tested model. The progress in winning back some profits in the last few days has been reversed. I have now done some more testing of this new idea and while the results are interesting it is far from a panacea. I don't understand why I trusted this model today to the point that I lost a pile of money in the final collapse of the market at the end of the day. Up to that point things were going well, but I was convinced the bounce should continue. And then I guess I froze in disbelief. Very bad behavior. The Australian Dollar has also been falling in the last couple of days. I now have a negative return overall for the month and not just for trading which was a given. The only consolation is I'm not doing as bad as the market is. It's been a good run in the last several months up till now.
Friday, July 27, 2007
Trying a New Way of Using the "Model"
Just thought of a new way of using my model results and so am going to make a bold prediction for tomorrow.
Direction: Up
Predicted rise in the NDX: 7 points IF today's low of 1955 is not taken out.
But if today's low is taken out then still expect a big bounce before the close.
My modeling approach forecasts the stochastic oscillator which measures where price is relative to the recent range. Today I would have been able to forecast where the stochastic ended up pretty precisely. But because the range extended dramatically to the downside the price could be much lower and still above the bottom of the range. There was a 31 point bounce off the bottom to the close. I am thinking that that is not too hard to forecast but where the bottom will be is not possible...
Monday, July 16, 2007
Trying to Model the All Ordinaries and S&P 500
I tried applying the same model I am using for trading the NASDAQ 100 to the All Ordinaries and S&P 500. The results were very poor for the All Ordinaries - buy and hold performed better, while for the S&P 500 the model might add value but better results can be obtained by trading SPX using the trade directions generated by the NDX. I'm not surprised about the All Ordinaries as it is driven to such an extent by what happens in the US markets. Much of each day's move typically occurs overnight Australian time while the US market is open. The stochastic is rather noisy and hard to model. Recently, there has been much less noise... I think the S&P 500 is just not volatile enough relative to the NASDAQ. This is why I started trading the NASDAQ. In future work I might try modeling more than one index simultaneously. I expect there are gains to be had from that.
Saturday, June 30, 2007
Trading the Model: First Annual Report
It's been one year now since I started trying to trade the model - time for an assessment. I didn't trade much this month but did pretty well - a profit of $2691 or 11.95% on capital deployed. When I first started trading the model I had two good months followed by four losing months and now six winning months. The model itself only had one losing month in this past year (May):

The model and the market have similar standard deviations but the model returns far more - a sign of a very high alpha. My returns have been similar to the model but my volatility far higher. After the losing streak I cut back on the amount of capital I was using resulting in lower profits for given rates of return in the second half of the year. Obviously, I am very far from faithfully replicating the model, but as I'll show in the following, I think my performance is improving.

As this chart shows the model returned 102% for the year vs.23% for NDX and my performance of 76%. The model's return is entirely unlevered. Looking at a daily chart:

we can see that some short periods when the model got short correctly added a lot to returns. The only ways the model can add value is by shorting when the market goes down and by stopping out of long positions when the market goes down more than 1.25% in a day. Obviously the model makes mistakes too, but over time they are less important than its correct moves. I don't have daily data for my account, but I can show you trade by trade results for NQ futures contracts since November:

This shows clearly how my trading has been far more erratic than either the market or the model. The following chart compares my monthly returns to the model:

Months below the line show poor performance relative to the model and points above the line relatively good performance. The last three months have been three of the best by this measure. My performance has a beta of 1.67 to the model with a monthly alpha of -4.9%. This means that when the model returns zero I lose nearly 5%. But looking at the very small sample of just the last six months I have a monthly alpha of 5.3%. Relative to the market the results are clearer - I have a beta of -0.97 and a monthly alpha of 7%. This alpha is significantly greater than zero with a probability of 97%. So I do particularly well when the market declines. The model's beta in the last year is around -0.16 with a monthly alpha of 6.4%. So it too has a short bias.
In conclusion, I think I am gradually learning to trade with this model - my results are beginning to be statistically significantly positive and nonrandom.
Tuesday, March 20, 2007
Aussie Dollar Trading Above 80 US Cents
It hasn't been above 80 cents in a long while. My Aussie Dollar model gave a sell signal yesterday. It's good I'm not trading forex anymore as I would have shorted the AUD and probably gone long the Yen, which would have made things twice as bad! This model is a previous generation model that is not as precise at all as my NDX trading model. One day maybe I will apply this new model to forex. But in the meantime I've decided to take a slow and steady approach to foreign currency management. Over time I plan to move my portfolio towards 50:50 Australian and US Dollars by accumulating savings in the US and transferring dividends and distributions from Aus to the US. After reaching the 50:50 level I would do regular quarterly, or whatever, rebalancing. Currently I am approximately 67% in AUD, 26% USD, and 7% other (global mutual funds that are unhedged or hedged into other currencies).
BTW I just shorted 2 NQ contracts @ 1781.75. The model is still not giving a very clearcut signal, so this is a hunch based on a bunch of stuff. I'll see in the morning whether I should add to it. Maybe this evening already I'll decide to get out of it if there is a very strong rally in Asia.
BTW I just shorted 2 NQ contracts @ 1781.75. The model is still not giving a very clearcut signal, so this is a hunch based on a bunch of stuff. I'll see in the morning whether I should add to it. Maybe this evening already I'll decide to get out of it if there is a very strong rally in Asia.
Friday, February 23, 2007
New Trading Rule
The big problem with my trading model has been that when the stochastic in the chart below is over 80 as it is today or under 20, I can't predict ahead of time when the market will turn and we should sell or buy. All I could do was wait for the stochastic to cross over.

So the model gave me no advantage over anyone who can read a free chart when the index was overbought or oversold. And that is a lot of the time. The model did give me a big edge when the stochastic turned around in the range between 20 and 80. I could predict that. I tended to get very jittery in these overbought and oversold zones and ended up losing most of the profits I made the rest of the time.
Today, I came up with a rule which uses one of the forecasts I was already generating from the model to give predictions for turning points in these overbought and oversold zones. I would say it works about 1/2 the time. Its performance is halfway between a trading algorithm that reverses from long to short or vice versa at the end of days when the stochastic crossed its moving average during that day and a model which shows perfect foresight and reverses position at the beginning of days that see stochastic crossovers. Let's see if it adds to my performance.
For what it's worth the model is not formally predicting that the stochastics will cross on Friday using the rule I found to be optimal. But unless there is another strong rally it's going to be hard for them not too and there are clear sell signals in palce on the S&P 500 and Dow indices, so I'm skeptical about that strong rally. The market has, however, continued to be stronger than I expected.
Wednesday, December 27, 2006
Oversold!
I just realized that in fact we are now in "oversold" conditions - the stochastic oscillator is below 20. This hasn't happened for so long I wasn't paying attention. According to the trading rules one ought to be short here not long! I entered a long trade this morning with just one contract. Now will look to exit it.
Saturday, December 23, 2006
Santa Rally?
The market has been going up since July so maybe it is rather late in the day to talk about the "traditional" year-end "Santa Rally" in the stock market. But this period from the day before Christmas till a few days after is also a time of seasonal strength in the market. The model was still short going into this morning, but only marginally so and will probably be long by the end of the day. So I went long at NQ = 1775.00. Still trying to work out if that was the right move. More ominously for bulls is that at this turning point we are now clearly out of the persistently overbought conditions that have prevailed in the last few months. All my indicators are now coinciding and indicating a turn here. This isn't the case in the overbought state. So after this short rally be on the look out for a significant downtrend to develop.
12:14pm
Stopped out at 1771.25. I put the stop at the low of the day so far and it was taken out. If I'd just stuck with the model, which was still short, I would have been up... Not sure, may wait till after Christmas to place another trade.
12:14pm
Stopped out at 1771.25. I put the stop at the low of the day so far and it was taken out. If I'd just stuck with the model, which was still short, I would have been up... Not sure, may wait till after Christmas to place another trade.
Thursday, December 07, 2006
Model Switches to Sell

The model switched to sell at today's close. If the NDX had closed above 1802 the model would have remained on buy. This is a rather negative omen for bulls given that the high yesterday (c) did not exceed the previous high around Thanksgiving. As I mentioned, the move down from the top looked like an impulse wave in Elliott Wave terminology. The move up since then (a), (b) , (c) now looks like a corrective wave. So the coming wave down is a wave 3 or wave C.
Wednesday, November 29, 2006
Model Forecasts - Trading Diary
At this point the NDX futures are up 5. If this holds or even if the index were to fall 12 points or so today the model is calling for a change of trend from Thursday. If we fall more than 12 points today then Thursday would open with oversold conditions if the index was unchanged from today's close. So that's the roadmap. Cover short positions today unless there is a huge selloff. Everything will depend on the economic data and Fed Beige Book published today.
Update: 10:47am
I did some NQ daytrading and am now holding the short positions with stops in around the day's highs. One theory is that the high today is the top of the B-Wave (in Elliott Wave Theory) of the correction that started on Friday. The big decline on Monday looks impulsive rather than a complete correction and the wave since then looks like an ABC formation. On the other hand, unless things reverse sharply here and the market ends down (which at the moment looks unlikely unless they totally hate the Fed Beige Book at 2pm) the model is saying to get long at today's close. So wait and see for the moment.
Update: 11:49am
The stops were hit while I was commuting and now I am flat. Though the market is off from the level of the stops (always annoying) I will remain flat till nearer 2pm. Have a meeting coming shortly for the next 1 hour or so. NDX could be making an ending diagonal formation intraday and if so it isn't complete.
Update: 2:34pm
Tha market doesn't hate the beige book, but so far it doesn't seem to like it either. I got long - waiting to see if that is the right stance.
Update: 8:29pm
In retrospect I would have been much better off without the stops.... I always have mixed feelings about stops. Sometimes I wish I had them and other times wish I didn't. I sold out of both long positions (QQQQ and NQ) by the end of the day. Will re-establish in the morning.
Tuesday, November 28, 2006
Trading Update
I've been short NDX for a while and losing money. In strongly overbought situations it is hard to use "the model". Each time it seems to show that the overbought situation is ending there has been a quick reversal back to overbought conditions. A nimble trader could have played these intraday "buy the dip" situations we have been having. Today's down move brings me to about breakeven on the month. The model is now clearly short. Expect more downside. Friday though could be the beginning of a new uptrend. It could get going on Thursday already. Overall though my portfolio is up about 2% so far this month and now beating the market. I fully expect to lose money in Australia in the next few days, though.
Friday, October 13, 2006
Stopped Out Again
Again the model was stopped out today. I lost a lot of money. The majority of my profits from this experimental trading period have been lost. In fact I am back to the return the market has given over this period. From that perspective I guess it hasn't been too much of a disaster? :) If one stuck exactly to the model a day like today wouldn't be disastrous. But if you don't trade the system properly days like today are very bad news. Over this period I have improved the model and decision rules a lot. It is a much better system than at the beginning of the period. So it hasn't been a waste. I am not giving up. I still have some profits left and a tool that in theory can produce tremendous profits. I'm not sure what the problem has been. Too much leverage does make me nervous and do dumb things. I plan to use less leverage going forward and try to stick more closely to the model signals. Doing what are really two full time jobs at the same time is hard. I end up doing neither very well. On the other hand trading more than one thing simultaneously in smaller amounts in each instrument would be psychologically easier. Soon I will be able to start paper trading at IB (I initiated the transfer of $5000 today). I am thinking to experiment with trading two or three instruments simultaneously. As it won't be real money I won't be worried about losing money. Probably trading NDX, bonds, and Australian Dollars would be a good combination as the three assets have little correlation with each other. I won't have time to model bonds and dollars so I will trade these purely on the basis of charts. Right now I'd be long the AUD and short bonds probably.
Wednesday, October 11, 2006
The Old Model Won
The old model won today as NDX ended up a couple of points and even the new "averaged stochastic" rose. But really the market didn't go anywhere much. Tomorrow these various stochastics almost absolutely have to fall due to the way they are computed. Will it be a down day finally? One potential trigger is the beginning of earnings season. Alcoa reported after the close and did not meet expectations.
I won't be updating the old model unless the new doesn't prove to be better in actual trading. In simulated trading since January 1st and June 30th this year it strongly outperforms the old model, even if today, the first day of using it was not one of those outperforming days.
I remember Teresa Lo from years back when she posted on Silicon Investor. Now she also has a blog and my impression is she has a similar attitude to me somewhere between academic finance and technical analysis and trying to work out objectively what works and what doesn't. She also emphasizes the very important role of psychology in trading success.
Tuesday, October 10, 2006
Major Model Improvement?
I noticed today that the standard slow(5,3) stochastic began to decline today while my preferred full(5,5,3) stochastic increased steeply. The existing model forecast predicts a decline in the market starting on Wednesday. But with the slow stoch already declining I would feel uncomfortable about being long. I did some trading simulations on a spreadsheet and found that the slow(5,3) stoch is often too early in determining changes in trend while the full(5,5,3) stoch is too late. Is this why I find it hard to stick to trading the model? Averaging the two stochastics outperforms either of the two stochastics. So now I have applied the forecasting models to this averaged stochastic. All three indicators estimated using the new model say the averaged stoch will fall on Tuesday. To do that the NDX must fall at least 10 points. Therefore, the model's decision is to get short at today's close.
Friday, September 01, 2006
Trading Model Performance for August
Another month has gone by trading "the model". I have further improved my trading rules and produced a decent performance for both the model and my account in August. The results in percent terms look like this:
NASDAQ 100 Index: 4.66%
Model(Improved Version): 8.36%
Trading Account: 15.26%
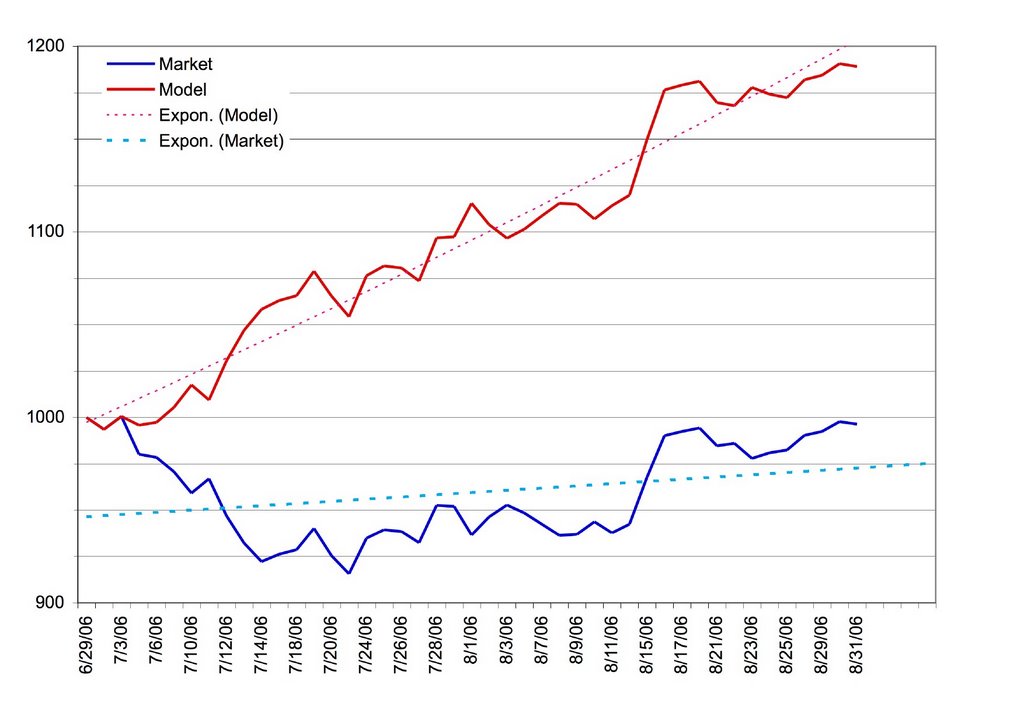
This means I captured 182% of the model's performance using about 3 times leverage. Before the improvements were added the model would have only been up about 5% and my performance captured 300% of that lower rate of return. As a result I earned $4700 for the month from trading vs. $3900 in July when the account gained 14.57% on the back of a model performance of 9.57% and a decline in NDX of 4.80%. This chart compares the model performance and the market action to date:

Clearly if you were short in early July and long in mid-August you would capture most of the model's gains.
It is going to take about 3 months from now, therefore, to achieve my goal of regaining all past trading losses on this account. In the meantime I am also saving up cash in my HSBC Online Savings account to open a futures trading account which will be the next adventure. But first I want to prove I consistently trade QQQQ profitably using the model over several months.
NASDAQ 100 Index: 4.66%
Model(Improved Version): 8.36%
Trading Account: 15.26%
This means I captured 182% of the model's performance using about 3 times leverage. Before the improvements were added the model would have only been up about 5% and my performance captured 300% of that lower rate of return. As a result I earned $4700 for the month from trading vs. $3900 in July when the account gained 14.57% on the back of a model performance of 9.57% and a decline in NDX of 4.80%. This chart compares the model performance and the market action to date:
Clearly if you were short in early July and long in mid-August you would capture most of the model's gains.
It is going to take about 3 months from now, therefore, to achieve my goal of regaining all past trading losses on this account. In the meantime I am also saving up cash in my HSBC Online Savings account to open a futures trading account which will be the next adventure. But first I want to prove I consistently trade QQQQ profitably using the model over several months.
Thursday, August 24, 2006
Model Update - Progress Towards Goals
At this point it is looking like there will be a buy to cover signal generated at next Tuesday's close. This is about as accurate as weather forecasting so as that date approaches the forecast might be brought forward or pushed out further in time. I continue to be shocked and stunned by the performance of the model and the ease of trading with it. I am getting used to trading the model. In July I got about 1.5 times the model return on my main trading account using roughly 3 times leverage. So far this month I am getting more than 3 times the model return. And, therefore, that performance goal has been realized. The model is on track to match last month's results. It is now up about 18% since 29 June. My taxable trading account is up 40%... The Roth IRA account is up 70% since I opened it earlier this year. I am now more than half way towards my initial goal of making $10,000 in profits in the Roth IRA. I thought that goal might take a few years to achieve. At this rate it could be achieved by the end of this year. I am pretty much also back on track towards this year's goal of increasing total net worth by $100,000. I think multiple near term goals are good - performance targets, profit targets, net worth targets etc. You can always be approaching some goal. Better than a single goal of some huge number you have to reach by "retirement".
P.S. Maybe I should just have bought real estate instead as common wisdom suggests :P The data in the article suggest that the real rate of capital gain on the typical house is 1% per annum. This article assumes 2% and still thinks housing is an inferior investment strategy.
P.S. Maybe I should just have bought real estate instead as common wisdom suggests :P The data in the article suggest that the real rate of capital gain on the typical house is 1% per annum. This article assumes 2% and still thinks housing is an inferior investment strategy.
Saturday, August 05, 2006
End of Week Report
Today the market rallied initially on an unemployment report and then ended the day lower. The model got stopped out because the NDX rose more than 1.25% intraday. However, I ignored the model as other indicators suggested that was the right course. So far this month my account is up 1.13% though the model is down 1.54% and the market down 0.37%.
Though everyone thinks the Fed will not raise interest rates on Tuesday, I have a suspicion that this time there could just maybe be a surprise (PS: According to Barron's published on Saturday Goldman Sachs have the same suspicion). The Fed almost always raises interest rates too much and induces a recession. Long-bond yields fell today. I have been reading Brian Berry's book on long-wave cycles. The first thing I have read on this that actually makes sense - actually it was Michael Alexander's columns that got me interested. I think we are still essentially in a declining interest rate cycle that started in 1981. After the next recession interest rates will start rising for real along with inflation according to the Kondratieff Cycle Theory. One thing that could help the next cycle be more inflationary is if the Fed triggers a deep recession here and future Fed chairmen dare not be so aggressive. This is just a wild speculation of course. With big bets on bonds, I of course want to see interest rates fall (which pushes up the value of bonds).
At the moment I am still in the real time testing phase of the model. I am only using about a third of the capital that I think would make sense to allocate to the model trading eventually. The eventual plan, if things check out consistently, would be to put about half of my non-retirement capital into it and trade that with about 3 times leverage. The rest of my non-retirement capital would be in unleveraged long-term investments so that the overall leverage is only 2 times, which I believe is a safe level. That is a limiting level. If I felt scared to trade that much I would trade a lesser amount. The ratio of trading to investment capital will also differ in bull and bear markets. The model performs best in bear markets. In bull markets good quality stocks could match it. Problem is finding those stocks!
Tuesday, July 25, 2006
Elite Trader
I have been a member of Silicon Investor for 8 years but only just discovered a site called Elite Trader today. Read an interesting discussion of Jim Simons' hedge fund. Don't know how useful it is in general but thought I'd just pass it along for those interested in learning more about trading.
Today, finally things seem to be going to plan trading wise. Much more relaxing. At this point it is looking like the rally continues all week long though there could be a significant correction in it around Wednesday.
4pm update - since 30 June:
Model: +6.8%
NDX: -6.5%
Excess Return: 14.2%
Trading Account: +2.9%
Excess Return: 10.0%
Capture of Model Performance: 70%
Am happy to be back on the positive side :) This is the revised version of the model. My account perfomance is as it happened. Excess return measures the difference between an account invested in NDX and an account invested in the model from inception. Excess return increases only when the model is correctly short.
Thursday, July 13, 2006
Cover Shorts and Go Long
The model says to be long from tomorrow. So I sold my QQQQ put options and bought back the QQQQ stock I had sold short. The underlying QQQQ position was a bit more than 50% of my net worth. Today's gain alone was $2700. I plan to establish long positions in the morning. The market closed very close to its lows and the stochastic is in the persistently oversold range. So best to still be cautious about going long. I didn't have time to buy options in my Roth account either before the close. Intraday the price action played out in almost perfect Elliott Wave Theory fashion. SPX/SPY has a clear 9 waves down - an extended impulse. In the QQQQ/NDX that itself is the 5th wave from the July 3rd high.
Over the last month or so I have developed my new approach to trading through a couple of different versions. Trading using my new systematic model based approach is so different to using traditional "analog" approaches. I am fairly confident that I have discovered something very significant. Am trying "not to count my chickens before they hatch" but it is hard not to speculate about the future. I don't feel at all euphoric. That is probably a good thing.
Over the last month or so I have developed my new approach to trading through a couple of different versions. Trading using my new systematic model based approach is so different to using traditional "analog" approaches. I am fairly confident that I have discovered something very significant. Am trying "not to count my chickens before they hatch" but it is hard not to speculate about the future. I don't feel at all euphoric. That is probably a good thing.
Monday, June 26, 2006
Technical Analysis Modeling
Been spending a lot of time recently on developing new technical analysis methods (commonly known also as "charting" - but the stuff I am developing barely involves a chart). In my academic career most of my research has involved applying time series models (statistical modeling methods related to regression analysis applied to data that is available as observations over time like historical temperatures, GDP, stock prices, population etc.). I have also done some work to apply these methods in the stock market.
I have found that, not surprisingly, it is pretty much impossible to forecast daily changes in stock prices using any standard time series model. This is why academic economists who work in finance say that technical analysis is rubbish and can't work. It is also why technical analysts use indicators which rather than forecasting changes in stock prices try generally to pick out turning points in the trend. I have created one indicator myself that is fairly useful by using an unusual combination of time series methods. My new approach is to try to forecast an indicator.
Recently, I have found that if you could predict the direction of the %K(5,5) full stochastic oscillator correctly (see this chart) you would beat the market by maybe 100% in bull market years and by hundreds of percent in bear market years. So being able to predict it is definitely a worthwhile thing. And it is far more predictable than stock prices themselves. Of course, no forecast can be 100% accurate and so these kinds of returns are not possible.
The time series model I have developed so far (in the last couple of days) can predict it well enough to increase the value of the account in bear markets. But in bull markets, following it blindly could lose money big time. Interestingly, we are now in a bear market by that definition. I tested each year from 1997-2006 and see how the model does over each year separately. This is called backtesting and is standard in developing technical analysis methods.
So I think my focus should be on improving those forecasts. Next step is to try some things that aren't in the time series textbook.
Anyway at the moment we have a very high probability forecast that the oscillator will be lower on Monday - i.e. stay short. This is backed up by the McClellan Oscillator and my E-Wave discussed in previous posts.
Subscribe to:
Posts (Atom)