Wednesday, June 01, 2011
Moominmama Portfolio Performance May 2011
Lot of moves this month reflected in these figures. World stock markets fell and the US Dollar rose negatively affecting Moominmama's returns and the portfolio fell by 2% in value. We increased the allocation to bonds again by transferring Sterling currency and converting it into the local currency and buying into four separate local bond funds and a balanced local bond fund. Also a local stock fund invested in European shares (my brother did all this). Some of these bonds are inflation-linked and some not. Some are short term, I don't know if any are long term. This is really the living/emergency fund for my mother. We also increased our investment in the Man-AHL managed futures fund by about 150%. As a result with have a lower allocation to both Sterling and Dollar cash this month than less. The local real estate market is very strong and so we uprated the value of Moominmama's apartment by 19%. At $276k it is still a bargain by Australian standards :). It is still cheaper than Snork Maiden's parents' apartment, though theirs is bigger but they live in a supposedly much poorer country which has really crazy real estate prices.
I noticed that the UBS A&Q hedge fund that we bought early in the financial crisis in April 2008 is finally worth more than we paid for it. We also bought a UBS agribusiness certificate which is almost back to its purchase value. It more than halved at the worst point in November 2008. The hedge fund never lost more than a quarter of its value.
Friday, May 20, 2011
More Hedge Fund Returns for April 2011
Like HFRI vs. HFRX the broad Credit Suisse index shows stronger gains than the narrower core index this month, with the index rising 1.8% overall:
And though Managed Futures did extremely well in both the Core and Broad indices there are some substantial differences in the other strategies such as Global Macro. The core index may be then mainly an indicator of direction of change alone and not a good proxy to the performance of a broader basket of hedge funds? Looking at global macro HFRX showed a 0.89% increase in April, Credit Suisse Core a 0.44% gain, Credit Suisse Broad a 2.46% gain, and HFRI a 3.36% gain.
BTW, at mid-May the HFRX indices are showing declines across almost all hedge fund strategies and a 1.8% loss for the global hedge fund index.
Heavy Travel Year
I just booked my trip to Korea. Later in the year I may go to the US. And I already visited Cloud Cuckoo Land (CCL). It will be my busiest flying year since 2002 when I did two round the world trips, a trip to Israel and back, and moved to the US from Australia. A total of 95,000 miles. This year is heading to 50,000 + miles but will still be only the third heaviest traveling year for me unless I exceed 2001's 60,000 miles (Two trips to the US and one to Britain). The next couple of years are going to involve a lot of flying too. I do actually have data on all the flights I have ever taken:
I started the file some time in the early 1990s when I was curious how far I had flown so far and there weren't that many flights yet to remember. The first time I flew was when I was 18 in 1983. It was also the first time I left my home country.
I didn't get the job in CCL and today put in another application for a permanent job at my current employer. This is fifth the since since we moved back to Australia. Some important people want to hire me and so the chances look very good. But I have had department chairs wanting to hire me before only to be over-ruled by other faculty members when they got to compare me with the other candidates.
Sunday, May 08, 2011
Hedge Fund Report: April 2011
There is a trend to earlier and earlier reporting each month of the results of the various hedge fund indices. Credit Suisse, now has a "Core Hedge Fund Index" along the lines of the HFRX. It gained 1.44% in April:
Managed futures did particularly well, but they did particularly badly in March. HFRX reported qualitatively similar results:
However, they estimate that hedge funds only gained 0.47% in April. Preliminary HFRI results show generally stronger performance than both these indices, with an overall gain of 1.86%:
Monday, May 02, 2011
Moominvalley April 2011 Report
As usual everything is in USD. The AUD rose yet again to 109.4 US cents. This improved our returns in USD terms and reduced them in AUD terms. We again can no longer just say "dollars" without thinking about whether we mean US or Australian Dollars. World stock markets rose in little in USD terms with the MSCI World Index gaining 4.15% for the month. Here is the summary account for March:
As you can see almost all the investment gain came from foreign exchange gains with just $928 of underlying returns. Of course, we lost money in terms of Australian Dollars. Non-investment income of $11,000 a month is the new normal... Expenditure was $5,533. We had to spend about $600 on car repairs/service. But apart from that it's hard to say where the money went... (It's AUD 5,058 and $4,500 without the car expenses is pretty normal).
The rate of return was 4.10% in USD terms narrowly underperforming the market, 0.17% in currency neutral terms, and -1.43% in AUD terms.
Net worth rose in USD terms by $31k (rose by $A0k in AUD terms) to $573k ($A524k) another all time high in USD terms.
Investment allocation saw a small increase in private equity due to gains in OCP.AX. and a small reduction in Australian stocks due to market movements.
Sunday, May 01, 2011
Moominmama Portfolio Performance April 2011
The portfolio had nice gains in April, though largely due to the fall in the US Dollar. The MSCI World Index rose 4.15% and the portfolio 3.46%. As you can see we made a few large changes in the portfolio - selling bonds - in preparation for both buying new investments and another possible major move (actually quite literally) in possible progress. We are also making some progress in sorting out the probate situation in the UK regarding one of my Dad's investments (he died in 2002 so this has been a long-term problem). We also closed my Mom's remaining UK offshore bank account and consolidated that account into her main fund manager. Generally, we are trying to simplify her affairs, diversify investments further, and deal with her living situation.
Friday, April 29, 2011
Reporting from Cloud Cuckoo Land
I'm at the airport in Cloud Cuckoo Land on my way home. The internet at the airport is free as is university education in this country. And any student who graduated high school can go to any university in the country and study any subject they like. There are no caps on enrolments. It really is Cloud Cuckoo Land :) Of course, a lot of those students fail the exams in the courses they pick and choose another subject or drop out of Uni. EU students can also get to study free here. The town is beautiful and everyone I met at the university was friendly. However the job involves teaching a lot of courses in a technical area which is a skill I have but not my research focus. I'm not so confident of teaching that subject at the graduate level. The hours of teaching per week required is similar to what I taught in the US but I would have to teach twice as many courses for half the time each. At my current university (where I don't have a permanent position yet but things are again looking up in that regard) there is an exceptionally low teaching load. And then there is the question of whether we would want to live in a foreign country learning a new language, though I do know quite a bit of the local language already and think I could learn fairly easily. On the upside there is a very good possibility of a job for Snork Maiden too.
Well, there were 6 candidates interviewed over the last two days in a non-stop marathon of presentations and interviews. The decision on the ranking of the candidates is supposedly being taken now as I am writing.
Saturday, April 16, 2011
Asset Allocation of US Estates
More interesting statistics from the US IRS. 34,000 estates needed to pay estate tax in 2009 and the average value of these estates was $5.7 million. Assets were allocated as follows:
Of course, this is the allocation of assets at death and does not necessarily indicate the allocation of typical wealthy people. But it is interesting how it reflects on certain myths floating around in the personal finance world. One meme is that the wealthy invest most of their money in real estate, another would be that retirees should have most of their wealth in safe investments - i.e. cash and government bonds. Neither is true here. There is quite good diversification with a likely 35% or so allocation to stocks directly and via pensions and 401(k)s. We don't know what is in "other" but can assume that that includes direct business ownership and alternative investments. By comparison, my Mom's portfolio is allocated to 29% stocks, 29% bonds, 16% cash, 17% alternatives, and only 9% real estate is a little conservative. Of course, the portfolio is quite a bit smaller than the typical one represented here :)
Tax Returns of the 400 Highest US Taxpayers
The US IRS puts out an annual report on the top 400 US taxpayers. In 2007, the average federal tax rate paid on adjusted gross income was only 19% despite the existence of the alternative minimum tax and a top US marginal tax rate of 35%. This is because 2/3 of their income came from capital gains.
This table shows the effect of the Clinton tax increases and the Bush tax cuts:
From 1993 to 2002 significant numbers of the top tax payers paid an effective tax rate of greater than 35% but none did before or after. The numbers paying less than 15% increased significantly in the later Bush years. Warren Buffett famously said that he paid a lower tax rate than his secretary. At least I'm not paying a higher rate than these billionaires :) Though Snork Maiden is :( Of course, those US figures don't include state taxes, which don't exist in Australia. But they'd likely only add an extra 5 percentage points at most despite so many wealthy people living in high tax California and New York.
Dow Jones/Credit Suisse Hedge Fund Index for March
The Dow Jones/Credit Suisse Hedge Fund Index rose slightly in March in contrast to the
HFR indices which fell. There were some similar patterns of relative returns across strategies with managed futures doing poorly and equity market neutral doing well.
Sunday, April 10, 2011
Hedge Fund Report: March 2011
The HFRX index fell 0.88% for March whereas the MSCI World Index rose by 0.72%. Equity market neutral, macro, event driven, and special situations saw gains. Equity market neutral saw the best gains, but equity hedge the second worst losses!
HFRX is a daily priced index in contrast to HFRI which only provides monthly results but covers a much wider selection of funds as a result. Dow Jones Indexes and Credit Suisse are launching of the Dow Jones Credit Suisse Core Hedge Fund Index, which will also be a daily priced index. The existing Dow Jones/Credit Suisse index is a monthly index. The index includes 40 component funds diversified across seven style-based sectors: event driven, long/short equity, global macro, emerging markets, managed futures, fixed-income arbitrage and convertible arbitrage. It is an asset-weighted hedge fund index, whereas the HFR indices are not I believe.
Early results for HFRI show a loss of 0.17% for the month:
By contrast to HFRX, HFRI shows losses for macro strategies and gains for equity hedge. Generally, I'd expect HFRI to be more representative of the broader reality for these individual strategies due to the larger number of funds included.
The Really Long Term
I don't know if any other personal finance bloggers have more than twenty years of data, but I haven't seen it posted. Now and then I like to update what the really long-term picture has looked like.
The graph has networth (blue) and the split into retirement accounts (green) and non-retirement (brown). The record starts when I first arrived in the US in 1990. The early years I was a grad student and then a post-doc and visiting assistant professor and in debt. Then I got a better job as a researcher in the late 1990s and savings began to accumulate. Unemployment and a stock market crash lead to a decline in 2002. Then an even better job in the mid 2000's followed by our move to Australia, merger of finances with Snork Maiden and a worse financial crisis saw net worth plummeting from near $500k to less than $200k. Since then the market rebounded and I've had a couple of jobs where we have largely saved my salary and we are now at a new high in US Dollar terms. The path seems a little smoother when measured in Australian Dollars:
I don't know whether this stuff might be useful to people just starting out to give an idea of how things might look in your future. If you don't dramatically expand your standard of living, higher paying jobs in the future can have a big effect on savings (countering the idea of the importance of starting early). And there can be some big deviations along the path. This one charts spending versus total income including market returns:
The big bumps are usually associated with international moves. Now with two of us in expensive Australia, our spending has bumped up to a new plateau but this graph isn't adjusted at all for inflation so the escalation in living costs is not so great, really. This is very roughly the inflation adjusted numbers (2008 US Dollars):
Sunday, April 03, 2011
Fund Distributions Begin to Return
Distributions from managed funds (Australian mutual funds) fell dramatically in the wake of the financial crisis. Some funds are now beginning to again pay significant distributions. More generally, dividends are rising.
For the January-March quarter, I got a $2035 distribution from the Colonial First State Developing Companies Fund, which is more than the sum of distributions received in 2008, 2009, and 2010. On the other hand, CFS Future Leaders paid out just $23 and CFS Diversified $71, and my other CFS funds seem to only be paying annual distributions. CAM.AX, CIF.AX, AOD.AX, and PMC.AX are all paying a reasonable level of regular dividends. IPE.AX hasn't paid a dividend since 2008 and EFG.AX since 2007 (no surprise there).
Snork Maiden got $236 from Celeste Small Companies and smaller amounts from property and fixed interest funds.
In the US TFS Market Neutral made its biggest distribution to date at the end of 2010 and there was a decent distribution from the China Fund. Other dividends are small or non-existent.
Receiving distributions is not necessarily a good thing as it means you have to pay tax (though it is the only way to get tax credits attached to company profits in Australia). But it is a sign that funds are doing well when they have to pay out money. I wonder how a strategy that sold funds that made big payouts and bought ones that didn't would do?
Moominvalley March 2011 Report
As usual everything is in USD. The AUD rose again to 103.6 US cents. This improved our returns in USD terms and reduced them in AUD terms. World stock markets rose a little in USD terms with the MSCI World Index gaining 0.72% for the month. Here is the summary account for March:
Non-investment income and retirement contributions were very high as this was a 3 pay month (we are paid every 2 weeks). Expenditure was $7,114 but a large part of that was the ticket to Cloud Cuckoo Land. Without that expense, core expenditure was a reasonable $4,061.
Investment return was $4,770 but taking out the effect of exchange rate movements was a loss of $2,722. The rate of return was 0.91% in USD terms, -0.52% in currency neutral terms, and -0.89% in AUD terms.
Net worth rose in USD terms by $16k (rose by $A7k in AUD terms) to $542k ($A524k) another all time high in USD terms.
Investment allocation saw a reduction in hedge funds and Australian stocks and a rise in other asset classes due to market movements, the return of capital from EAIT, and the investment in GTAA.
As a follow up to yesterday's post I've added our own rates of return to the table:
(well I dropped some of the timeframes as I couldn't be bothered to compute them). Moominmama's more conservative portfolio performed better over the 3 year period that included the global financial crisis but underperformed us across the other horizons. Over a 5 year horizon we have matched the MSCI World Index and over ten years beaten it. Over the ten year period our beta to the index has been 1.22 with an alpha of 2.11% p.a. Over 5 years, 1.22 with an alpha of 0.88% p.a. Over 3 years beta was 1.27 and alpha -2.29% and over 2 1.24 and 0.40%. So we have taken on more risk than the index but added more return than just the risk alone would provide except over the period around the global financial crisis.
The following graph shows the rolling estimates of alpha and beta using a 36 month window:
Alpha is much more volatile than beta. The high values of alpha achieved around the middle of the decade inspired over confidence and subsequent fall in alpha to negative values. Assuming no major setbacks in the next few months, I forecast the 36 month alpha will again rise to 6% by the end of this year.
Saturday, April 02, 2011
Moominmama Portfolio Long-Run Performance
We now have enough data to compute the rate of return over 8 years on Moominmama's portfolio. This table compares it to the MSCI World Index:
All rates are annualised. In general the portfolio has about half the performance of the MSCI World Index. This isn't surprising given the conservative nature of the portfolio. I estimate beta at 0.47 and alpha at -2.31%. The latter is not very good. The standard deviation of monthly returns is 5.91% for the MSCI for the months for which we have data on the portfolio and 3.3% for the portfolio. So it seems there is a bit over half the risk for less than half the average return and, therefore, a worse Sharpe ratio. So we have sacrificed return for a less than proportionate reduction in risk. Obviously, we could be doing worse than this too. I guess it depends on what your expectations are.
Career Update
I bought the ticket for the interview in Cloud Cuckoo Land - $2947. That's a bit over the budget they gave me of Euros 2000. A direct flight to the capital seemed to come out even worse and then I'd need to get a train for 2 1/2 hours. So I'm flying to Frankfurt and then flying to the city in question.
In the meantime in Australia I am making progress on getting a permanent job despite some setbacks. It looks like a position I can apply for will again be advertised soon and there are various developments I am pushing which would provide a course for me to teach and collaborations with other areas in the university.
P.S. I took my suit to be altered to fit my new smaller size. It was big when I bought it but for some reason I believed the salesman that that was OK. Since then I lost a few kilos in weight. The alteration cost is less than a new suit of that quality and I think it will look better than when I first bought it when this guy is done with it. He altered a suit for me once before many years ago and also adjusted Snork Maiden's wedding dress.
Sunday, March 27, 2011
Buffett Advises Against Long-Term US Bonds
Buffett speaking in India
In a recent post I referenced the Credit Suisse report that argues quite reasonably that long-term bonds are unlikely to be a good investment going forward. Of course, if you believe in efficient markets the prices of long-term bonds should already reflect that interest rates will rise in the future and, therefore, buying long-term bonds now should still be an OK investment. US short-term government bond interest rates remain near zero, but interest rates on 30 year bonds have risen significantly since the depths of the financial crisis:
History suggests though that the adjustment is insufficient. The Credit Suisse Report shows that there are long periods where bonds do not beat inflation in most countries with the partial exception of Switzerland. Now Warren Buffett warns against owning long-term US government bonds. His concern is both that inflation will reduce the real value of the bonds and that the dollar will fall in value against other currencies due to inflation in the US. It's hard to imagine the US Dollar falling in value a lot against the Euro, Pound, or Australian Dollar given how cheap things are in America but against developing country currencies such as the RMB that is possible.
My mother has a short-term USD bond fund and a longer-term Sterling related bond fund. We do want to reduce both of these and especially the latter. Snork Maiden and I have a variety of exposures to bonds though the total is only a small apart of our portfolio. The exposure is only 5.7% of net worth in total. The most significant types of bonds are Australian fixed interest and US corporate and mortgage related bonds. The latter are the main holdings of the CREF bond market fund, which did surprisingly well through the financial crisis (we should have had more of it):
This small level of exposure should be safe I think and I don't intend to lower it.
Job Interview on the Other Side of the World
Just heard. About one month's time.
Friday, March 25, 2011
Adjusting my Mom's Portfolio
We (my brother and I) are planning to reduce the allocation to bonds a bit. If you read the Credit Suisse Investment Returns Yearbook I think you'll understand why:
1. We definitely have too much in the Invesco Sterling Bond Fund. By my calculation it is 16% of her total net worth. This is a larger share than when I last blogged on it. This large share was all due to a mistake by Citibank... I plan to halve the allocation to this fund.
2. I plan to reduce the Janus Short Term Bond Fund by less. The two funds would each then each have about the same amount of money in them.
Also we want to:
3. More than double the investment in the Man-AHL fund. Visit these links to find out why I like managed futures.
4. We will ask for suggestions from the bank for new funds and asset classes to invest in. Including real estate and even alternative bond funds. Any recommendations from readers will be welcome. We can't buy US mutual funds but we can buy some international marketed variants.
Generally, we want to rebalance and diversify.
We also need to move some money around for my Mom's expenses and generally try to reduce the number of accounts she holds in different countries. We still have some problems left over from when my father died in 2002 with accounts still in his name that banks and government are being obstructionist about. You'd think that joint accounts would transfer automatically to the surviving spouse. But it isn't so simple always. If you are married I strongly recommend having some money in your own name in case you end up in a legal limbo too.
iSoft
iSoft (ISF.AX) suspended its shares pending an "announcement". I just wish companies would explain something about why they are halting trading. The Guardian has the story. Apparently a partner firm looks ready to buy them out. My interest is due to our holding of Oceania Capital Partners (OCP.AX) who made a disastrous large investment in iSoft. Most of the loss of value happened very quickly last June and as OCP is trading way below NAV I didn't sell. OCP is also in a trading halt. At the current share price we are making a small profit of a few hundred dollars on our investment in OCP. At the NAV we would be making a profit of several thousand dollars. And the company is in the mode of winding up and returning capital to shareholders. With all these companies returning capital we need at some point in theory to make new investments in the private equity and hedge fund asset classes. The question is whether we can find good investments of that sort.
Wednesday, March 16, 2011
I thought I was just editing and improving my Facebook profile. It already said I was married but not to whom. So I updated that information. A bunch of Snork Maiden's "friends" now think that she just got married and sent her congratulations! Three years late. Only one of my 9 friends commented (on LinkedIn I have about 120 connections). Yeah, I don't understand Facebook much at all.
Over-reaction?
The Japanese stock market fell more than 16% in two days. If that reaction is rational it means that the net present value of the future profits of Japanese companies will be 16% lower than would have been without the earthquake/tsunami/nuclear accident. This seems to me to be an over-reaction. How much will Japanese GDP fall this year? The main economic impacts are damage to ports, oil refineries, and power stations on the east coast of Honshu. The impact of the tsunami damage and nuclear issues is unlikely to be very significant by comparison for the whole economy of Japan IMO. Some of these issues will be fixed fairly quickly (I'm guessing the oil refinery damage comes into that category) and others like the Fukushima nuclear power station cannot be fixed. I don't see why any of this should have pushed the German stock exchange 5% down at one point on March 15th. Anyway, I doubled my position in GTAA @ $25.11 using the money I transferred.
Wednesday, March 09, 2011
HSBC Gave Me a Lousy Exchange Rate
I did a wire transfer of AUD 10,000 from my Australian to my US HSBC bank account. The exchange rate turned out as USD 0.9808 per Australian Dollar. That's about 3 cents from where the official exchange rate was. That's really bad I think. Maybe I should have done the conversion to US Dollars at the Australian end. Would that have given me a better exchange rate?
More Hedge Fund Returns for February 2011
Credit Suisse-Dow Jones provide some preliminary results:
These show stronger overall performance and more variation among strategies than the HFRX results. HFRI is somewhere between the two:
Sunday, March 06, 2011
HFRX Index Performance February 2011
The HFRX hedge fund index gained 0.73% for February compared to 2.16% for the MSCI World stock index. All strategies saw gains and it is hard to see any pattern in the variations across strategies.
Wednesday, March 02, 2011
Moominvalley February 2011 Report
As usual everything is in USD. The AUD rose a little from 99.8 US cents to 101.7 US cents. This improved our returns in USD terms. World stock markets rose with the MSCI World Index gaining 2.16% for the month. Here is the summary account for February:
Non-investment income and retirement contributions increased as I earned money for the first full month at my new job (I started 10th January). Retirement contributions are up too of course. 19% of my pre-tax salary is going into my retirement account - (% is a contribution by my employer on top of my nominal salary and 10% is a voluntary contribution by me from the stated salary). The numbers should look like this throughout this calendar year now. Expenditure was a little high at $4,608, though there are some good reasons for that. Underlying investment returns were good.
Net worth rose in USD terms by $28k (rose by $A18k in AUD terms to another post GFC high) to $526k ($A517k) and all time high in USD terms.
There was little change in investment allocation. Investment return was a gain of 4.07% in USD terms. In AUD terms we gained 2.05% and in currency neutral terms 2.66%. All asset classes gained. Australian small cap and US stocks were the best performers in currency neutral terms followed by private equity.
What am I Going to Do with the EAIT Money?
As I mentioned I just got paid out $A7,500 or so from EAIT. With that and my next paycheck I'm going to buy $10,000 worth of US Dollars. i.e. move the money to America. I'll probably end up investing some more in GTAA when the move is over.
Sunday, February 27, 2011
Another Letter from the US IRS
I got a another letter from the US IRS. The good news is that they accept the tax return that I prepared and my payment of $30.10 in taxes for 2008. The bad news is that now want me to pay penalties and interest. A penalty of $30.10 for filing late, a penalty of $2.86 for paying taxes late, and interest of $4.01. So I'll send them a cheque for $36.97 and hopefully that will be the end of the saga.
Draft Outbound Foreign Investment Rules Released
The Australian government has finally released the draft of legislation intended to replace the FIF rules. From my reading of the information provided, only funds that invest in debt and do not distribute 80% or more of profits would be included in the new rules. More interpretation is available here.
Based on this, the kind of investments that I'm interested in should not be captured by the new rules and I will be able to invest overseas without worrying about complicated tax rules.
EAIT Terminated
Everest Financial is winding up. I should get a payout of $A800 next month as part of the run-down. Now I got a letter from One Managed Investments who took over the EAIT fund from Everest that they terminated the fund on 11 February and are now managing just to pay out the investors. We should get a return of capital of 88.2 cents per share (i.e. about $A7,500 for me) on 1 March and the rest over the next four years. The delay is because the underlying hedge funds have "lock-up" periods.
The question is whether I should look to reinvest my capital in other hedge fund opportunities. If all goes to plan I did actually make some money on the EAIT fund (about $A3,000). I lost a lot investing in Everest Financial, the management company. Logically, the latter shouldn't deter me from investing in hedge funds. But the drawn out saga of EAIT has certainly made me more wary.
Sunday, February 06, 2011
HFRX Performance for January 2011
Overall hedge funds gained 0.56% in January according to the HFRX index. In comparison MSCI World Index gained 1.59%. Equity hedge and market neutral strategies and systematic diversified strategies had negative returns. The Man-AHL managed futures fund lost 3.74% in January so the latter is not surprising.
Thursday, February 03, 2011
Moominvalley January 2011 Report
As usual everything is in USD. The AUD fell a little from 102 US cents to 98. This hit our returns in USD terms. World stock markets gained a little with the MSCI World Index gaining 1.59% for the month. Here is the summary account for December:
Non-investment income and retirement contributions increased as I earned my first paycheck at my new job. Expenditure was pretty reasonable at $4,193. Underlying investment returns were modest and a little negative in USD terms.
Net worth fell in USD terms by $3k (rose by $A10k in AUD terms to a post GFC high) to $498k ($A499k). Here is the net worth chart in AUD:
For USD see last month.
There was little change in investment allocation. Investment return was a loss of 1.36% in USD terms. In AUD terms we gained 1.20% and in currency neutral terms 0.70%. All asset classes gained with the exception of foreign non-US shares. Private equity was the best performer with a 5.01% gain.
Tuesday, February 01, 2011
Moominmama Portfolio Performance January 2011
The MSCI World Index gained 1.59% in January. Moominmama gained 0.98% but not because of equities performance. The gain is mainly due to the strong performance of Sterling this month. Most of those bonds are Sterling related bonds. Hedge funds also did well. Indian and Brazilian stocks and the local currency performed very badly.
Saturday, January 29, 2011
The Importance of Going to a Good University
If you think it is not important to go to a good university then read this first. Some PF Bloggers recommend to just go to a cheap school.
There are some caveats though. I commented recently on Enoughwealth's post on high schools saying that if you are going to go to university then mostly it doesn't make sense to pay a lot of money to go to the most prestigious high school. But you do need to go to a good one. One that could get you into University of Sydney or UNSW in the Australian case or into one of the top US universities (any of those mentioned in this article). If you definitely plan on going to grad school then it's not necessary to get into the top US universities as an undergrad if it means shelling out big fees. But you do want to go to a good school. Somewhere like UCLA or NYU or Boston University or even Ohio State (Columbus campus). If you do well in places like that you can have a shot at top grad schools. But if you get an undergrad degree from Southern Cross U. or UCQ in Australia say or Cal State U. or somewhere in the US it will be a struggle to get into a good grad school. Likely they will just toss your application unless there is some compelling evidence of your brilliance. And if you get a grad degree from some low ranked university it might not help your employment prospects much at all.
Of course, all this depends on how ambitious you are. I didn't really understand the game fully when I was a student. I knew you needed to go to good universities and went to three good universities. The first two were top-ranked in their country. The third one was good but not in the top-rank. Now I regret somewhat * not trying for the top-ranked place that one of my professors at school #2 suggested. I just thought there was no way they'd consider me or give me any funding. But I could have tried for $50 or whatever the application fee was back then.
I had a job interview on Friday. The head of the department said to me: "I don't know why anyone would come do a PhD here if they could go to that other university across town". I agree with him on that. In economics at least, the name of the school matters.
* Only somewhat because if I had gone there (in the picture) rather than across the river I doubt I would have ever met Snork Maiden. And after all I have done pretty well in my academic career so far.
Thursday, January 20, 2011
GTAA Lowers Fees
Cambria's GTAA ETF has raised $72 million so far and so is lowering the expense ratio to 0.99%.
In other news, hedge fund assets hit a new record:
"HEDGE FUNDS END 2010 WITH RECORD QUARTERLY ASSET INCREASE
CHICAGO, (January 19, 2011) – The hedge fund industry concluded 2010 with the largest quarterly increase in assets in its history, according to data released today by Hedge Fund Research (HFR). Total industry assets grew to $1.917 trillion, reflecting a quarterly increase of nearly $149 billion, topping the previous record increase of $140 billion in 2Q07.
The year-end figure approaches the historical asset peak of $1.93 trillion set in 2Q08 and represents an asset increase of 44 percent since 1Q09. Hedge funds as represented by the broad-based HFRI Fund Weighted Composite Index posted a gain of 10.5 percent, but full-year gains were concentrated into year end, with the HFRI gaining over 5.5 percent in 4Q10."
Monday, January 17, 2011
Street View vs. 3D View
Google Earth has now added 3D trees in some parts of the world, including San Francisco. Here is a random street in SF in 3D view:
And in Street View:
hmmm Were some trees removed or has Google added some random ones in? When's 3D cables coming? :P BTW, Street View is much improved on the previous version and really easy to navigate around in. You can see what high speed internet is really for! :) I've always been amazed by Google Earth and it keeps getting more amazing.
Weight Loss
When I cam back from Europe I found I was 2-3kg lighter at least than when I left and I decided to try to keep losing weight. I had been trying half-heartedly for a while. I've now been keeping a daily weight record for almost three months. The results look like this:
The scale is in kilograms (multiply by 2.2 or divided by 0.454 to get pounds). I'm 1.90m (6' 3") tall so that should explain why the number might look big to you if you're not so tall. As you can see, my initial enthusiasm wore off but I still seem to be losing weight. I've averaged a loss of 34 grams (just over an ounce) a day. Initially though it was about 67 grams a day. Mainly, I've tried to eat less at each meal, especially less bread and less rice and cut out calories for the sake of calories in the form of alcohol etc. And eat fewer and lower calories snacks. There is nothing I stopped eating completely though and I don't measure how much I eat. I just try to moderate as much as possible. This has worked before for me and it seems to be working now. It will take about another 9 months at this rate to get me down to my real target of about 90kg. I'm pretty happy to be approaching 100kg again though.
Downside is that neither of my two suits fits me now. One is too big and one too small. I don't want to get the big one adjusted to my current size though... I'm thinking anyway a suit will be too hot for my next interview and I'll just do the shirt and tie thing. This is academia and though it is part of a business school I noticed the pictures on the website of people are not wearing suits and ties.
Sunday, January 16, 2011
Career Update
I had a phone interview with one college in the US but I heard on Saturday that I'm not being invited to the on-campus interview unless they don't like any of the candidates they have invited. In other words, I'm a back up candidate again. Haven't heard from any other US jobs yet but I suspect we'll be staying in Australia for now. I scheduled my interview for a job in Sydney in less than 2 weeks time on Friday.
Monday, January 10, 2011
How Much Should I "Salary Sacrifice" into Superannuation?
I'm starting my new job and looking at the contract details. I was a bit surprised that my employer will only pay 9% of my salary (i.e. on top of my stated salary) into superannuation (retirement). That is because public sector employers in Australia normally pay more than that. But they can get away with this for a short-term contract. Usually, at this employer, when the employer pays 17% in, employees are required to pay in 8%. Snork Maiden's employer pays 15.4% and we salary sacrifice $225 every 2 weeks into her super account. The latter is about 7%. So what should I do here? There is a cap of $25,000 per year in super contributions of course, so I can't go beyond that. Should I go for:
1. Zero
2. The same % as Snork Maiden
3. The 8% level
4. Go to the maximum allowed level?
The downside of going to the max is of course that we can't then access those contributions for 14 years at least. The upside is the contributions face a lower rate of taxation - 15% going in instead of my marginal rate of 31.5% this financial year and possibly 38.5% next financial year. When in the fund, rates are also lower than I'd probably pay in the long term and when I retire I could get the money out tax free.
If I was 10 years older, I would for sure choose the maximum contribution level.
P.S.
As noted in the comments, I might not be able to do salary sacrifice in this position anyway. I'll ask about it tomorrow. I'll also be increasing our automatic savings contributions to non-retirement accounts. I think from $500 per month each to $1,000 per month each.
Annual Report 2010 Part IV Investment Returns
The MSCI All Country World Gross Index gained 13.21% for the year while we only gained 9.78% in USD terms. But over the last two years we gained almost double the index. Over 10 years we also outperformed the index but over the last 3 or 5 years we underperformed. Relative investment performance matters a lot depending on the period measured. In Australian Dollar terms we have lost over all but the 2 year time frame and even in currency neutral terms the long-run return has been about zero. It hasn't been a good period for investing.
Sunday, January 09, 2011
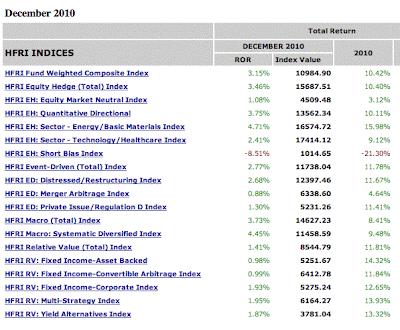
HFRI Hedge Fund Index Performance December 2010
With the exception of short bias, all styles gained in December and for 2010 as a whole. Both the month and the year saw strong stock market performance globally in USD terms. The top performer for the year was funds that specialised in energy and basic materials. That's not too surprising.
Saturday, January 08, 2011
Annual Report 2010 Part III (AUD Version)
In contrast to the USD version investment returns were negative, even in currency adjusted terms.* Still, we did manage some gain in net worth in AUD terms. The breakdown of needs, wants and saving is based on a monthly spending of $A3,500 as being sufficient to cover needs and everything above that is a "want". Monthly spending is never below the $A3,500 level but sometimes reaches it when we are frugal. Our monthly rent is $2,042 at the moment, so that spending level is not that high. Of course, we could spend less on rent if we wanted to...
* As explained in the previous post, this is due to summing each month's results while exchange rates swung wildly from month to month. If very negative returns occur when the Australian Dollar is strong and positive returns occur when it is weak the annual currency adjusted result could be negative in AUD terms and positive in USD terms.
Friday, January 07, 2011
Annual Report 2010 Part II (USD Version)
Part I is here and last year's report here. This year was not as spectacular as last year financially but still pretty good. Expenditure was higher and income lower but we still spent less than we earned. We saved about a quarter of non-retirement non-investment income (which is what the spending 76% number indicates) and net worth rose by about 20% in USD terms to almost $1/2 million. There was about equal growth in retirement and non-retirement accounts. Non-retirement accounts made about $5,000 of real income adjusted for exchange rate moves, while retirement accounts lost about $1,000.* Soon, I'll present the results in Australian Dollar terms which will look a lot different.
* This is when income is adjusted for exchange rate moves each month and then summed for the year. To get the currency neutral income, each month we sum investment income for that month using the exchange rates at the end of the previous month to convert amounts in different currencies. If we summed all income for the year using the previous year's exchange rates the decomposition would be different.
Wednesday, January 05, 2011
Tuesday, January 04, 2011
Moominvalley December 2010 Report
As usual some data will lag for a month or more but here are the accounts based on the information I have at the moment. And as usual everything is in USD. The AUD rose strongly from 96 US cents to $1.02, which is a record level since the Australian Dollar was floated in 1983. This hit our returns in AUD terms and boosted them in USD terms.World stock markets gained strongly with the MSCI World Index gaining 7.35% for the month. Here is the summary account for December:
Non-investment income was more normal this month as it is just Snork Maiden's regular salary minus the check I sent to the IRS. Expenditure was pretty reasonable at $4,296. Investment returns in USD terms were very strong, but more than half the gain came from the rise in the Australian Dollar.
Net worth rose in USD terms by $43k (rose by $A13k in AUD terms) to $500k ($A488k). This is a record monthly close in US Dollar terms.
Actually we are about $100 short of the half million mark.
Allocation-wise the main change was a rise in the share of large cap Australian stocks due to the market and a reduction in the allocation to hedge funds due to my sale of Platinum Capital shares.
Investment return was a gain of 9.15% in USD terms. In AUD terms we gained 2.44% and in currency neutral terms 4.31%. All asset classes gained with foreign shares and private equity the best performers.
Monday, January 03, 2011
Long Run US Stock Market Returns
An update on the famous chart, that I first saw in Unexpected Returns:
Returns are measured relative to inflation. Here is the key:
For example, if you invested in 2000 and withdraw your money in any year since you would have made less money than inflation. Investing in 2008 and 2009 though has generated nice returns. Investing in any other year since the mid 1990s has resulted in negative to low positive returns. And that's the period I have been investing in...
Returns seem to move in waves, shown by the red and green patches on the chart. Maybe we are entering a new wave of positive returns? It would be nice to think so!
Subscribe to:
Posts (Atom)