This was a very good month investment-wise. Not all numbers are in, we still might get updates from more illiquid investments. But based on what we have, we had our best investment result ever in terms of absolute Australian Dollars (rather than percentage return) at AUD 228k. It's beginning to feel like 2021 again:

We are approaching having made AUD 3 million in gross returns by investing. In 2020-2021, we had a record-breaking run of 17 positive months ending in December 2021. So far we have only had 5 positive months in a row, but the longest positive run we had in the intervening two years was only two months. So, this feels very different than the last two years.
In March, the Australian Dollar rose slightly from USD 0.6504 to USD 0.6514. Stock indices and other benchmarks performed as follows (total returns including dividends):
US Dollar Indices
MSCI World Index (gross): 3.20%
S&P 500: 3.22%
HFRI Hedge Fund Index: 1.53% (forecast)
Australian Dollar Indices
ASX 200: 3.57%
Target Portfolio: 2.76% (forecast)
Australian 60/40 benchmark: 2.41%.
We gained 4.44% in Australian Dollar terms or 4.60% in US Dollar terms. So, we beat all benchmarks. Shocking 😀.
Here is a report on the performance of investments by asset class:
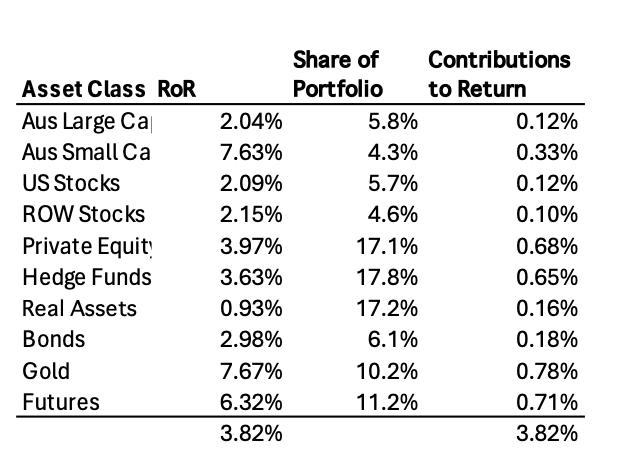
The asset class returns are in currency neutral returns as the rate of return on gross assets and so are lower than the Australian Dollar returns on net assets mentioned above. Returns were positive for all asset classes. Gold had the highest rate of return and made the largest contribution to returns followed by futures in terms of contribution and Australian small caps in terms of rate of return.
Things that worked well this month:
- Seven investments made more than AUD 10k each: Gold (48k), Bitcoin (28k), 3i (III.L, 26k), Regal Funds (RF1.AX, 23k), Pershing Square Holdings (PSH.L, 14k), Unisuper (11k), and CFS Developing Companies (11k).
What really didn't work:
- Unpopular Ventures had the worst result (-5k) as one of our investments with them went bust.
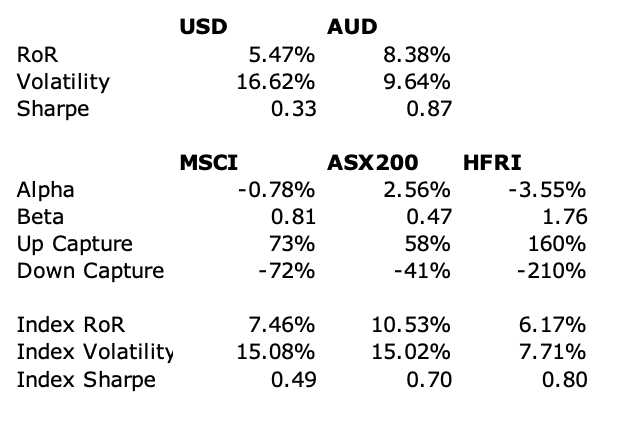
Here are the investment performance statistics for the last five years:

The top three lines give our performance in USD and AUD terms, while the last three lines give results for three indices. Compared to the ASX200 we have a lower average return but also lower volatility, resulting in a higher Sharpe ratio of 0.97 vs. 0.72. But as we optimise for Australian Dollar performance, our USD statistics are much worse and worse than either the MSCI world index or the HFRI hedge fund index. Well, we do beat the HFRI in terms of return, but at the expense of much higher volatility. We have a positive alpha relative to the ASX200 of 3.3% with a beta of only 0.45.
The SMSF continued to outperform both its benchmark funds after under-performing for a few months:

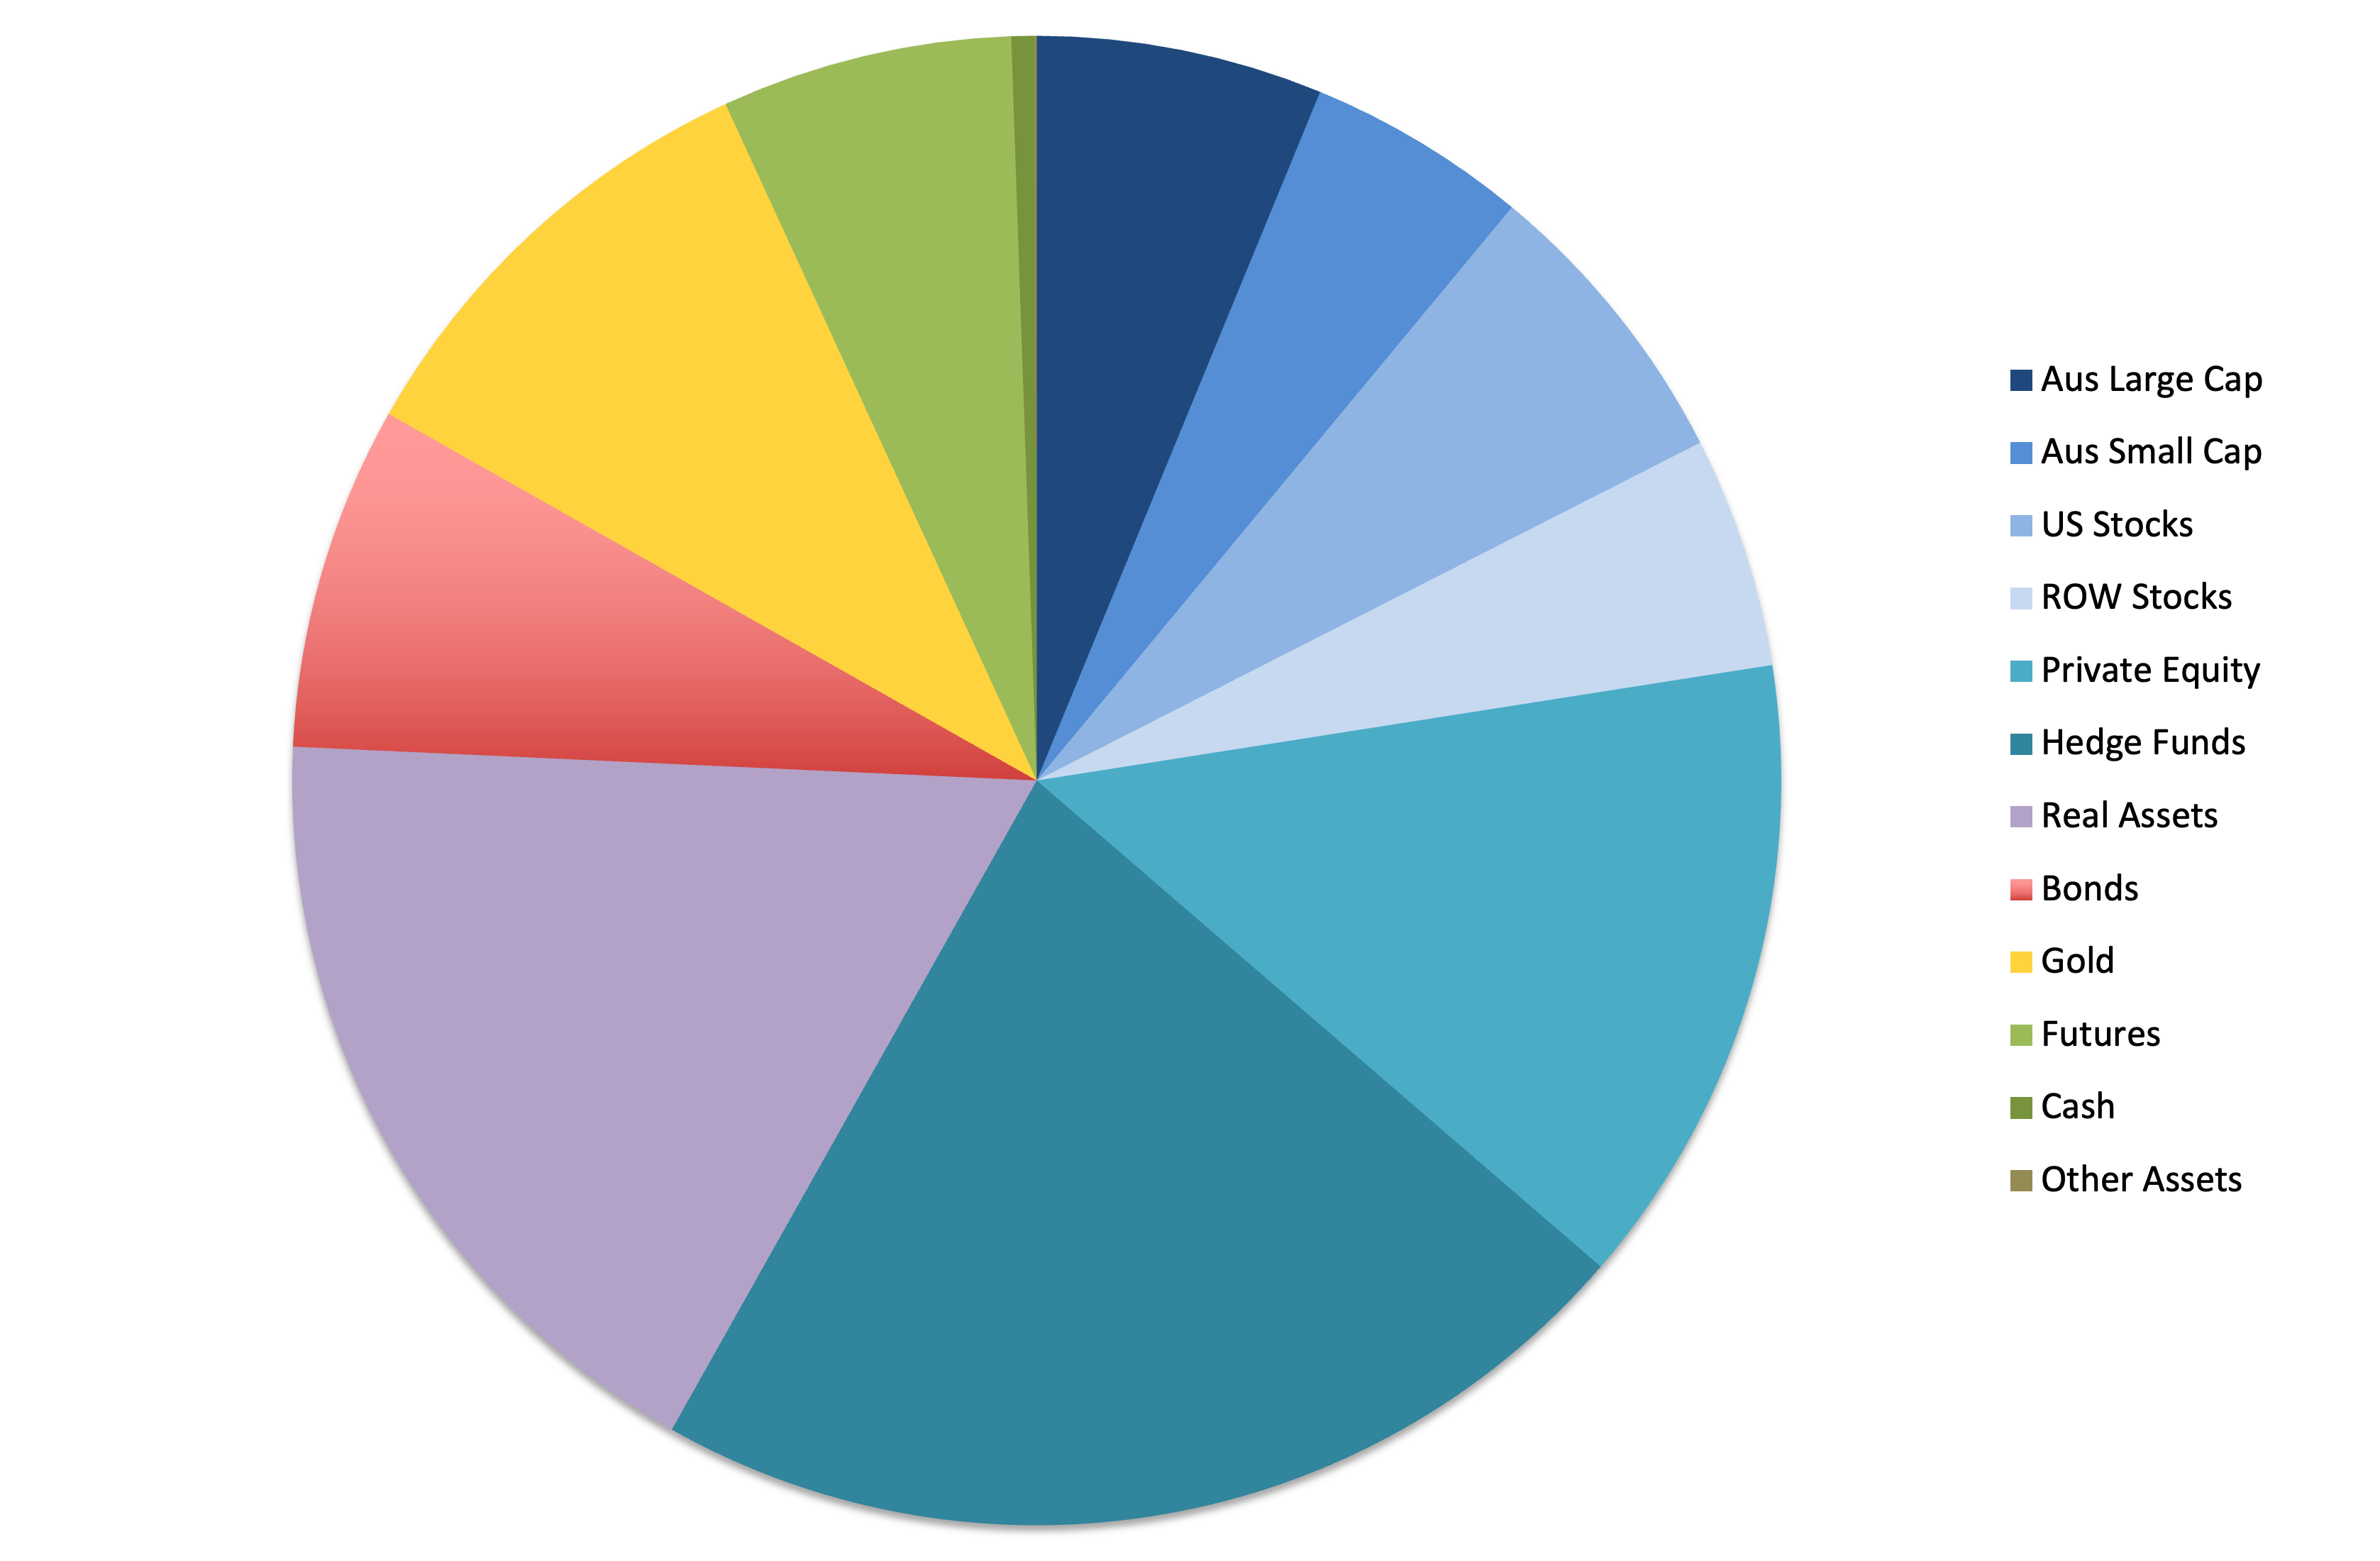
We are fairly close to our target allocation. We are underweight private equity and hedge funds and overweight real assets and futures. Our actual allocation currently looks like this:

We receive employer contributions to superannuation every two weeks. We are now contributing USD 10k each quarter to Unpopular Ventures Rolling Fund and less frequently there will be capital calls from Aura Venture Fund II. It was quite a busy month:
- I sold 1,000 shares of the Perth Mint gold ETF (PMGOLD.AX). This helped fund capital calls from Unpopular Ventures and Aura totalling AUD 40k.
- I sold 3,000 shares of the WCM Global Quality ETF (WCMQ.AX).
- I sold 20,000 shares of Cadence Capital (CDM.AX). We no longer hold this in our SMSF, but do hold plenty of shares in other accounts.
- I sold 5,000 shares of Platinum Capital (PMC.AX).
- I bought 750 shares of Fidelity's bitcoin ETF (FBTC). This was funded by the sales of stock funds listed above.
- I also did some successful day-trading of Bitcoin and gold futures. I feel like I am finally getting this trading thing :)
- I sold 7,794 shares of Regal Funds (RF1.AX).