Showing posts with label Performance. Show all posts

Saturday, September 09, 2023

Why I Haven't Posted a Monthly Report Recently

I haven't posted monthly reports for July or August. The reason is that the July accounts have an error of more than AUD 12k and I don't have the time or inclination to try to reconcile them at the moment. Probably this will have to wait till later in the year when my teaching is over. I focus all my teaching in the second semester so I am really busy. And I am also working on my new hobby of genealogy research, since December last year. Probably I will eventually make a post for the second half of the year as a whole with monthly investment performance figures. There is also an error of more than AUD 8k that cropped up now in the December 2022 accounts, which wasn't there before. Possibly they are related...

Anyway,  in AUD terms July is currently at 2.18% (compared to our target portfolio of 1.77%. ASX200 = 2.89%) or 3.18% in USD terms (HFRI = 1.75%, MSCI = 3.45%). So not bad.

August is at 0.05% (ASX = -0.44%, target = 0.90%). In USD terms though it was a fall of 3.62%. Stock markets were down but not that bad...

P.S.

After writing this post I realised what might be wrong with December 2022 and fixed that and June 2023. But July 2023 still has a 12,000 dollar error...

Saturday, August 12, 2023

June 2023 Report

We finally have all the investment statements and reports for the 2022-23 financial year, which means I can put together a report on our investment performance in June. In June, The MSCI World Index (USD gross) rose 5.85%, the S&P 500 rose 6.61%, and the HFRI hedge fund index gained 2.20% in USD terms. The ASX 200 rose 1.74% and the target portfolio 1.09% in AUD terms. All these are total returns including dividends. The Australian Dollar rose from USD 0.6479 to USD 0.6657. We lost 0.27% in Australian Dollar terms or gained 2.40% in US Dollar terms. So, we under-performed all benchmarks apart from the HFRI. Our hedge fund and private equity investments underperformed their benchmarks, dragging down performance relative to the target benchmark, which has a 38% weighting on these two asset classes.

Here is a report on the performance of investments by asset class:

The asset class returns are in currency neutral returns as the rate of return on gross assets. I then add in the contributions of leverage and other costs and the Australian Dollar to the AUD net worth return. Gold was the biggest detractor, while futures contributed the most.

Things that worked well this month:

  • Pershing Square Holdings and Australian Dollar Futures did well.

What really didn't work: 

  • Gold and Tribeca Global Resources did badly.

The investment performance statistics for the last five years are not looking good and I don't feel like reporting them. 😕

We are now very close to our target allocation. Our actual allocation currently looks like this:

About 70% of our portfolio is in what are often considered to be alternative assets: real estate, art, hedge funds, private equity, gold, and futures. A lot of these are listed investments or investments with daily, monthly, or quarterly liquidity, so our portfolio is not as illiquid as you might think.

We receive employer contributions to superannuation every two weeks. We are now contributing USD 10k each quarter to Unpopular Ventures Rolling Fund and less frequently there will be capital calls from Aura Venture Fund II. It was another quiet month. The only additional investment moves I made were:

  • I bought 500 PMGOLD.AX and 1778 CDO.AX (Cadence Opportunities Fund) shares.


Sunday, August 06, 2023

Superannuation Returns in the Long-Run

Following up from my post on how our SMSF is performing compared to our managed superannuation funds, here is how our superannuation in general has done over time:

Note that the y-axis is a log scale! Our superannuation has outperformed the MSCI index in AUD terms in the long-run. The big win was in the couple of years after 2002 when I rolled over my Unisuper fund to Colonial First State and invested in geared funds. Then I got too conservative leading up to the GFC - the flat top you can see on the red line. Superannuation returns crashed in the GFC because I got aggressive again too early. After that, we have followed the market more closely until after 2018 when we have gone into a bit more of a capital preservation mode again. This reduced the volatility in 2022 but returns in 2023 are a bit disappointing so far.

On the other hand, our non-superannuation assets had catastrophic performance up to 2009. After that, I got my act together, which eventually gave me the confidence to set up an SMSF. But you can see the value of handing control to an external manager early on.

Superannuation returns are pre-tax but after fees. My method of imputing tax paid for public superannuation funds probably exaggerates their performance a bit. These time based returns are quite different from dollar based returns. All the early volatility wasn't that important because total assets were small. Performing well now is much more important.

Enough Wealth followed up on my original post by comparing his SMSF over a longer period to a basket of industry funds.

Saturday, August 05, 2023

Superannuation Performance Update July 2023

Inspired by this article in the AFR, here is an update on how well our SMSF is doing compared to Unisuper and PSS(AP). after underperforming for a few months, it outperformed in June and July:


Looking at the longer term, it is still ahead of the two super funds:


It rode out the 2022 downturn with less "volatility". PSS(AP) actually has a slightly lower standard deviation of monthly returns but also a lower mean. As a result, the SMSF has an information ratio (Sharpe ratio with a zero return hurdle) of 1.1, while Unisuper is at 0.61 and PSS(AP) at 0.73. Relative to Unisuper, the SMSF has an annual alpha of 5.36% and a beta of 0.44 (Relative to PSS(AP): 4.61% and 0.61).

I compute all these returns pre-tax. This probably overestimates the taxes paid by Unisuper and PSS(AP), giving them a bit of an advantage. OTOH, I don't charge for my time in managing the investments.

Sunday, June 11, 2023

May 2023 Report

In May, markets were mixed. The MSCI World Index (USD gross) fell 1.00% while the S&P 500 rose 0.43% in USD terms. The ASX 200 fell 2.30% in AUD terms. All these are total returns including dividends. The Australian Dollar fell from USD 0.6605 to USD 0.6479. We lost 1.07% in Australian Dollar terms or lost 3.09% in US Dollar terms. The target portfolio lost 0.06% in Australian Dollar terms and the HFRI hedge fund index is expected to lose 0.12% in US Dollar terms. So, we under-performed all benchmarks apart from the ASX 200.

Here is a report on the performance of investments by asset class:

The asset class returns are in currency neutral returns as the rate of return on gross assets. I then add in the contributions of leverage and other costs and the Australian Dollar to the AUD net worth return. We underperformed the target portfolio benchmark mainly because of negative returns on hedge funds in particular. Private equity had the most positive returns and contributed most to the return for the month, while gold and futures also performed positively. Australian small caps were the worst performers.

Things that worked well this month:

  • 3i (III.L) gained the most (AUD 18k) followed by Cordish Dixon PE Fund 3 (CD3, 8k), and Winton Global Alpha (7k).

What really didn't work: 

  • Cadence Capital (CDM.AX), Regal Funds (RF1.AX), and Cadence Opportunities (CDO.AX) lost the most: AUD 18k, 13k, and 11k respectively.

The investment performance statistics for the last five years are: 

The first three rows are our unadjusted performance numbers in US and Australian dollar terms. The MSCI is reported in USD terms. The following four lines compare performance against each of the three indices over the last 60 months. The final three rows report the performance of the three indices themselves. We show the desired asymmetric capture, positive alpha, and higher Sharpe Ratio against the ASX200 but not the USD benchmarks. We are performing about 4.4% per annum worse than the average hedge fund levered 1.77 times. Hedge funds have been doing well in recently.

We are now very close to our target allocation. Our actual allocation currently looks like this:

About 70% of our portfolio is in what are often considered to be alternative assets: real estate, art, hedge funds, private equity, gold, and futures. A lot of these are listed investments or investments with daily, monthly, or quarterly liquidity, so our portfolio is not as illiquid as you might think.

We receive employer contributions to superannuation every two weeks. We are now contributing USD 10k each quarter to Unpopular Ventures Rolling Fund and less frequently there will be capital calls from Aura Venture Fund II. It was a very quiet month. The only additional investment move I made was:

  • I bought a net 250 shares of PMGOLD.AX.


Saturday, May 06, 2023

April 2023 Report

In April, stock markets continued to rise. The MSCI World Index (USD gross) rose 1.48% and the S&P 500 1.56% in USD terms, while the ASX 200 gained 2.03% in AUD terms. All these are total returns including dividends. The Australian Dollar fell from USD 0.6695 to USD 0.6605. We gained 1.09% in Australian Dollar terms but lost 0.45% in US Dollar terms. The target portfolio gained 1.98% in Australian Dollar terms and the HFRI hedge fund index is expected to gain 1.19% in US Dollar terms. So, we under-performed all benchmarks :(

Here is a report on the performance of investments by asset class:

The asset class returns are in currency neutral returns as the rate of return on gross assets. I then add in the contributions of leverage and other costs and the Australian Dollar to the AUD net worth return. We underperformed the target portfolio benchmark because of negative returns on international stocks and hedge funds, in particular. Our US stocks actually outperformed the S&P 500 this month.

Several asset classes made moderate positive contributions with private equity leading, while ROW stocks and hedge funds had negative returns

Things that worked well this month:

  • Gold was the greatest gainer at AUD 9k, but several other investments gained between AUD 6-9k including Unisuper, 3i (III.L), Hearts and Minds (HM1.AX), Regal Funds (RF1.AX), Winton Global Alpha, WAM Alternatives (WMA.AX), and PSS(AP).

What really didn't work: 

  • Tribeca Global Resources (TGF.AX) was again the biggest loser with a loss of AUD 14k. Followers up were: The China Fund (CHN, -8k) and Pershing Square Holdings (PSH.L, -6k).

The investment performance statistics for the last five years are: 

The first three rows are our unadjusted performance numbers in US and Australian dollar terms. The MSCI is reported in USD terms. The following four lines compare performance against each of the three indices over the last 60 months. The final three rows report the performance of the three indices themselves. We show the desired asymmetric capture, positive alpha, and higher Sharpe Ratio against the ASX200 but not the USD benchmarks. We are performing about 3.9% per annum worse than the average hedge fund levered 1.76 times. Hedge funds have been doing well in recently.

We are now very close to our target allocation. Our actual allocation currently looks like this:

About 70% of our portfolio is in what are often considered to be alternative assets: real estate, art, hedge funds, private equity, gold, and futures. A lot of these are listed investments or investments with daily, monthly, or quarterly liquidity, so our portfolio is not as illiquid as you might think.

We receive employer contributions to superannuation every two weeks. We are now contributing USD 10k each quarter to Unpopular Ventures Rolling Fund and less frequently there will be capital calls from Aura Venture Fund II. In addition, we made the following investment moves this month:

  • I invested USD 2,500 in a Latin-American start-up company through the Unpopular Venture Syndicate.
  • I bought 5,000 more Cordish-Dixon 3 (CD3.AX) shares.


Sunday, April 09, 2023

March 2023 Report

In March, stock markets rebounded. The MSCI World Index (USD gross) rose 3.15% and the S&P 500 3.67% in USD terms, while the ASX 200 only gained 0.25% in AUD terms. All these are total returns including dividends. The Australian Dollar fell from USD 0.6740 to USD 0.6695. We gained 0.55% in Australian Dollar terms but lost 0.15% in US Dollar terms. The target portfolio gained 1.84% in Australian Dollar terms and the HFRI hedge fund index is expected to gain 1.47% in US Dollar terms. So, we only out-performed the ASX200.

Here is a report on the performance of investments by asset class:

The asset class returns are in currency neutral returns as the rate of return on gross assets. I then add in the contributions of leverage and other costs and the Australian Dollar to the AUD net worth return. We underperformed the target portfolio benchmark because of negative returns on international stocks and hedge funds as well as negative returns on Australian small caps. We lost on US stocks because of a very negative return from Hearts and Minds (HM1.AX) offsetting positive returns on other US holdings.

Gold was the main positive contributor to returns and the highest returning asset class while futures were the largest detractor and worst performing asset class. The trend-following managed futures funds got caught in the sudden movement in US bonds during the month associated with the banking crisis.

Things that worked well this month:

  • Gold gained AUD 54k - the biggest monthly gain in a single investment since I started investing.

What really didn't work: 

  • Tribeca Global Resources (TGF.AX) lost AUD 11k. Followers up were: Pershing Square Holdings (PSH.L, -10k), Aspect Diversified Futures (-9k), Hearts and Minds (HM1.AX, -9k), and Winton Global Alpha (-8k).

The investment performance statistics for the last five years are: 

The first three rows are our unadjusted performance numbers in US and Australian dollar terms. The MSCI is reported in USD terms. The following four lines compare performance against each of the three indices over the last 60 months. The final three rows report the performance of the three indices themselves. We show the desired asymmetric capture, positive alpha, and higher Sharpe Ratio against the ASX200 but not the USD benchmarks. We are performing about 3.6% per annum worse than the average hedge fund levered 1.76 times. Hedge funds have been doing well in recently.

We are now very close to our target allocation but we mived away from it quite sharply during the month. In particular, real assets increased as we added to URF.AX and it rose, while private equity fell as we took profits in PE1.AX. Our actual allocation currently looks like this:

About 70% of our portfolio is in what are often considered to be alternative assets: real estate, art, hedge funds, private equity, gold, and futures. A lot of these are listed investments or investments with daily, monthly, or quarterly liquidity, so our portfolio is not as illiquid as you might think.

We receive employer contributions to superannuation every two weeks. We are now contributing USD 10k each quarter to Unpopular Ventures Rolling Fund and less frequently there will be capital calls from Aura Venture Fund II. In addition, we made the following investment moves this month:

  • I sold 100 China Fund (CHN) shares.
  • I sold 3,500 WAM Leaders (WLE.AX) shares.
  • I sold 10k MCP Income Opportunities (MOT.AX) when the price spiked back up to AUD 2.10.
  • I bought 12k shares net of Cordish-Dixon Private Equity Fund 3 (CD3.AX).
  • I did a losing trade in bond futures.

Sunday, March 05, 2023

February 2022 Report

In February, stock markets fell again. The MSCI World Index (USD gross) fell 2.83% and the S&P 500 2.44% in USD terms, while the ASX 200 lost 2.25% in AUD terms. All these are total returns including dividends. The Australian Dollar fell from USD 0.7113 to USD 0.6740. We also lost money: 0.47% in Australian Dollar terms or 5.69% in US Dollar terms. The target portfolio gained 0.72% in Australian Dollar terms and the HFRI hedge fund index is expected to lose about 0.83% in US Dollar terms. So, we out-performed the ASX200 but under-performed all the other benchmarks.

Here is a report on the performance of investments by asset class:

The asset class returns are in currency neutral returns as the rate of return on gross assets. I then add in the contributions of leverage and other costs and the Australian Dollar to the AUD net worth return. One reason that we underperformed the target portfolio benchmark is the very negative returns we got for rest of world stocks and to a lesser degree hedge funds. The Australian Dollar cash price of gold was breakeven for the month, so I also don't understand why PMGOLD.AX lost value, especially as I bought some extra shares during the month at a price that was lower than the end of month price...

Real assets were the main positive contributor to returns and the highest returning asset class while hedge funds were the largest detractor.

Things that worked well this month:

  • URF.AX (US residential real estate) was the biggest gainer adding AUD 11k, followed by two managed futures funds: Winton Global Alpha (9k) and Aspect Diversified Futures (6k).

What really didn't work: 

  • Tribeca Global Resources (TGF.AX) lost AUD 30k. The next worse were the China Fund (CHN, -19k) and Australian Dollar Futures (-15k).

The investment performance statistics for the last five years are: 

The first three rows are our unadjusted performance numbers in US and Australian dollar terms. The MSCI is reported in USD terms. The following four lines compare performance against each of the three indices over the last 60 months. The final three rows report the performance of the three indices themselves. We show the desired asymmetric capture, positive alpha, and higher Sharpe Ratio against the ASX200 but not the USD benchmarks. We are performing about 3.3% per annum worse than the average hedge fund levered 1.77 times. Hedge funds have been doing well in recently.

We are now very close to our target allocation but we mived away from it quite sharply during the month. In particular, real assets increased as we added to URF.AX and it rose, while private equity fell as we took profits in PE1.AX. Our actual allocation currently looks like this:


About 70% of our portfolio is in what are often considered to be alternative assets: real estate, art, hedge funds, private equity, gold, and futures. A lot of these are listed investments or investments with daily, monthly, or quarterly liquidity, so our portfolio is not as illiquid as you might think.

We receive employer contributions to superannuation every two weeks. We are now contributing USD 10k each quarter to Unpopular Ventures Rolling Fund and less frequently there will be capital calls from Aura Venture Fund II. In addition, we made the following investment moves this month:

  • I bought 1,000 shares of the gold ETF, PMGOLD.AX.
  • I sold 4,000 shares of WAM Leaders (WLE.AX).
  • I sold 59,976 shares of Pengana Private Equity (PE1.AX).
  • I bought 29,638 shares of the Cordish-Dixon private equity fund CD3.AX.
  • I bought 25,000 shares of MCP Income Opportunities private credit fund (MOT.AX).
  • I bought 65,000 shares of URF.AX (US residential real estate).

Wednesday, March 01, 2023

January 2022 Report

In January, stock markets rebounded. The MSCI World Index (USD gross) gained 7.19% and the S&P 500 6.28% in USD terms, and the ASX 200 gained 6.23% in AUD terms. All these are total returns including dividends. The Australian Dollar rose from USD 0.6816 to USD 0.7113. We gained 2.21% in Australian Dollar terms or 6.66% in US Dollar terms. The target portfolio rose 1.45% in Australian Dollar terms and the HFRI hedge fund index around 2.8% in US Dollar terms. So, we out-performed the S&P 500, the HFRI, and our target portfolio and under-performed the others.

Here is a report on the performance of investments by asset class:

The asset class returns are in currency neutral returns as the rate of return on gross assets. I have added in the contributions of leverage and other costs and the Australian Dollar to the AUD net worth return.

All asset classes had positive returns. Private equity was the largest contributor to returns Followed by hedge funds, while RoW stocks had the highest return.

Things that worked well this month:

  • 3i (III.L) rose strongly, gaining AUD 22k. Tribeca (TGF.AX 18k), Unisuper (15k), PSSAP (14k), China Fund (CHN, 13k), and Hearts and Minds (HM1, 10k) all contributed more than AUD 10k.

What really didn't work: 

  • Three managed futures funds all lost money, with Winton Global Alpha losing the most (AUD 4k).

The investment performance statistics for the last five years are: 

The first three rows are our unadjusted performance numbers in US and Australian dollar terms. The MSCI is reported in USD terms. The following four lines compare performance against each of the three indices over the last 60 months. The final three rows report the performance of the three indices themselves. We show the desired asymmetric capture and positive alpha against the ASX200 and the MSCI but not against the hedge fund index. We have a higher Sharpe Index than the ASX200 but lower than the MSCI in USD terms. We are performing about 2.6% per annum worse than the average hedge fund levered 1.75 times. Hedge funds have been doing well in recently.

We are now very close to our target allocation. Our actual allocation currently looks like this:

About 70% of our portfolio is in what are often considered to be alternative assets: real estate, art, hedge funds, private equity, gold, and futures. A lot of these are listed investments or investments with daily, monthly, or quarterly liquidity, so our portfolio is not as illiquid as you might think.

We receive employer contributions to superannuation every two weeks. We are now contributing USD 10k each quarter to Unpopular Ventures Rolling Fund and less frequently there will be capital calls from Aura Venture Fund II. In addition, we made the following investment moves this month:

  • I bought 1,000 shares of the China Fund, CHN.
  • I bought 3,000 shares of Ruffer Investment Company, RICA.L.

Friday, February 03, 2023

Rates of Return Over 20 Years


The graph shows the average annual rate of return over the previous 20 years up to that date. Our target diversified portfolio has had a very consistent 20 year return, as has the ASX 200. The MSCI World stock market index and the S&P 500 have been less consistent. My own performance was not good up to 2020 when seen from a 20 year perspective. By January this year, though, it's almost matching the target portfolio and is near the MSCI World Index (which doesn't deduct management fees). One reason for this, is I did really badly in 2000-2003 in the dot.com crash or tech wreck and so performance is now measured from the low point of March 2023. The chart is measured in Australian Dollars.

Saturday, January 14, 2023

Annual Report 2022

Overview 
This was the first year that our net worth fell since 2008. Investment returns were negative but the value of our house increased a bit and we did save some money.* We were far short of the best case projection I made at the beginning of the year of a net worth of AUD 6.7 million. In my academic career, I spent a lot of time this year working on preparing and then teaching a new course, though I did get at least one newish research project completed. I was supposedly on long service leave for the first three months of the year but didn't really get to take any time off. This year, I plan on taking it a bit easier in the first half of the year before focusing on teaching in the second half of the year. Teaching was more in person this year and so a bit more enjoyable. I didn't leave the Canberra region all year since getting back from the coast right after New Year's Day.
 
All $ signs in this report indicate Australian Dollars. I'll do a separate report on individual investments. I do a report breaking down of spending after the end of the financial year.
 
Investment Returns 
In Australian Dollar terms we lost 3.7% for the year but in USD terms we lost 9.6% because of the fall in the Australian Dollar over the year. The MSCI lost 18.0% in USD terms but the ASX 200 gained 0.9% in AUD terms. The HFRI hedge fund index lost 1.5% in USD terms. Our target portfolio lost 4.2% in AUD terms. So, we beat the MSCI and the target portfolio benchmarks this year but not the ASX 200 or HFRI Index. 
 
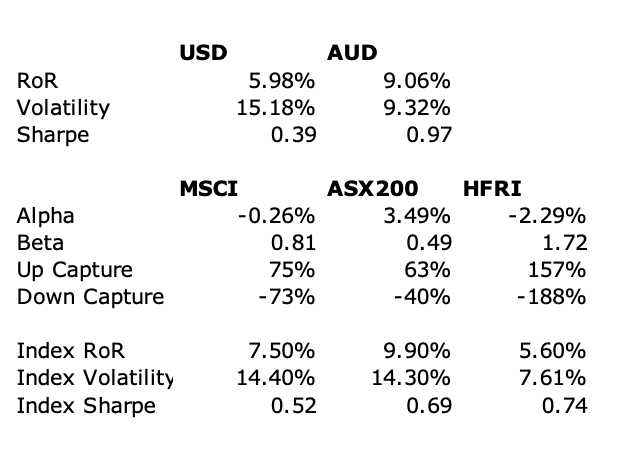
This chart compares our portfolio to the benchmarks in Australian Dollar terms over the year:
 

We tracked the target portfolio quite closely. It acted as a less volatile weighted average of Australian and international equity markets. Here are the same indices in US Dollar terms with the target portfolio replaced by the HFRI hedge fund index:
 
The HFRI had very low volatility and the strongest relative performance. In USD terms, our portfolio was much more volatile than in Ausrtalian Dollar terms as intended.
 
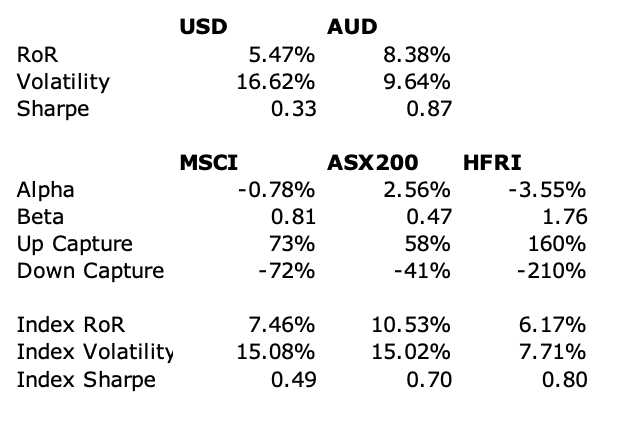
Here are annualized returns over various standard periods:

Benchmark returns have now mostly decreased over time. We have similar performance to the ASX 200 over ten years but much worse over twenty. We beat the HFRI over all the longer time horizons. We had particularly good relative performance over the three year horizon. Whether you think our performance is good or bad depends on what you think the default alternative investment is. If it is an ASX 200 index fund, then we are doing in the last ten years. If it is a global stock index fund then not so good over horizons longer than three years. If you think it is our target portfolio then we are doing well.

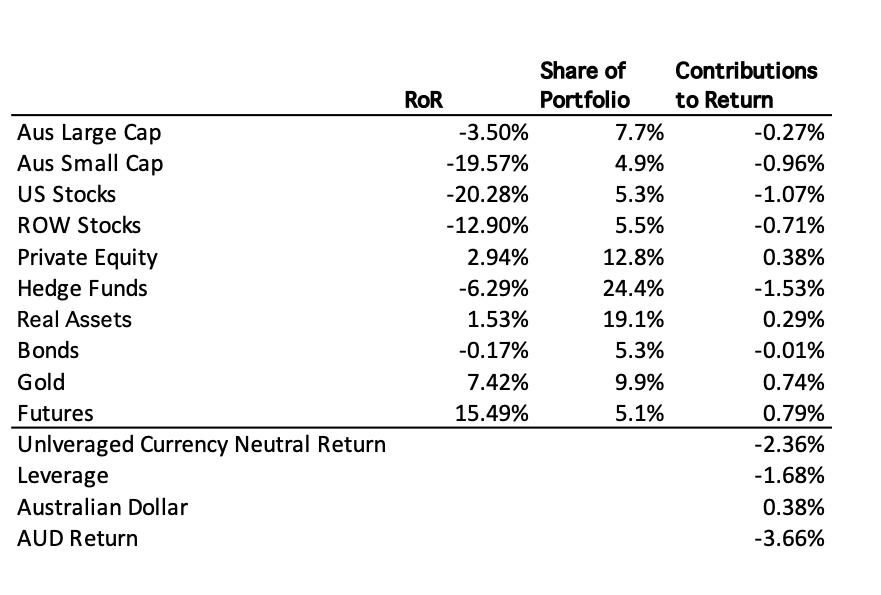
Here are the investment returns and contributions of each asset class in 2022:
The contributions to return from each asset class sum to the total portfolio return in gross asset and currency neutral terms. I then add on the contributions of leverage and the Australian Dollar to get the AUD net worth return. The portfolio shares are at the beginning of the year. Futures and gold did best and contributed most to the return. Private equity and real assets had small positive returns. Australian small cap stocks and foreign equities all did very badly.

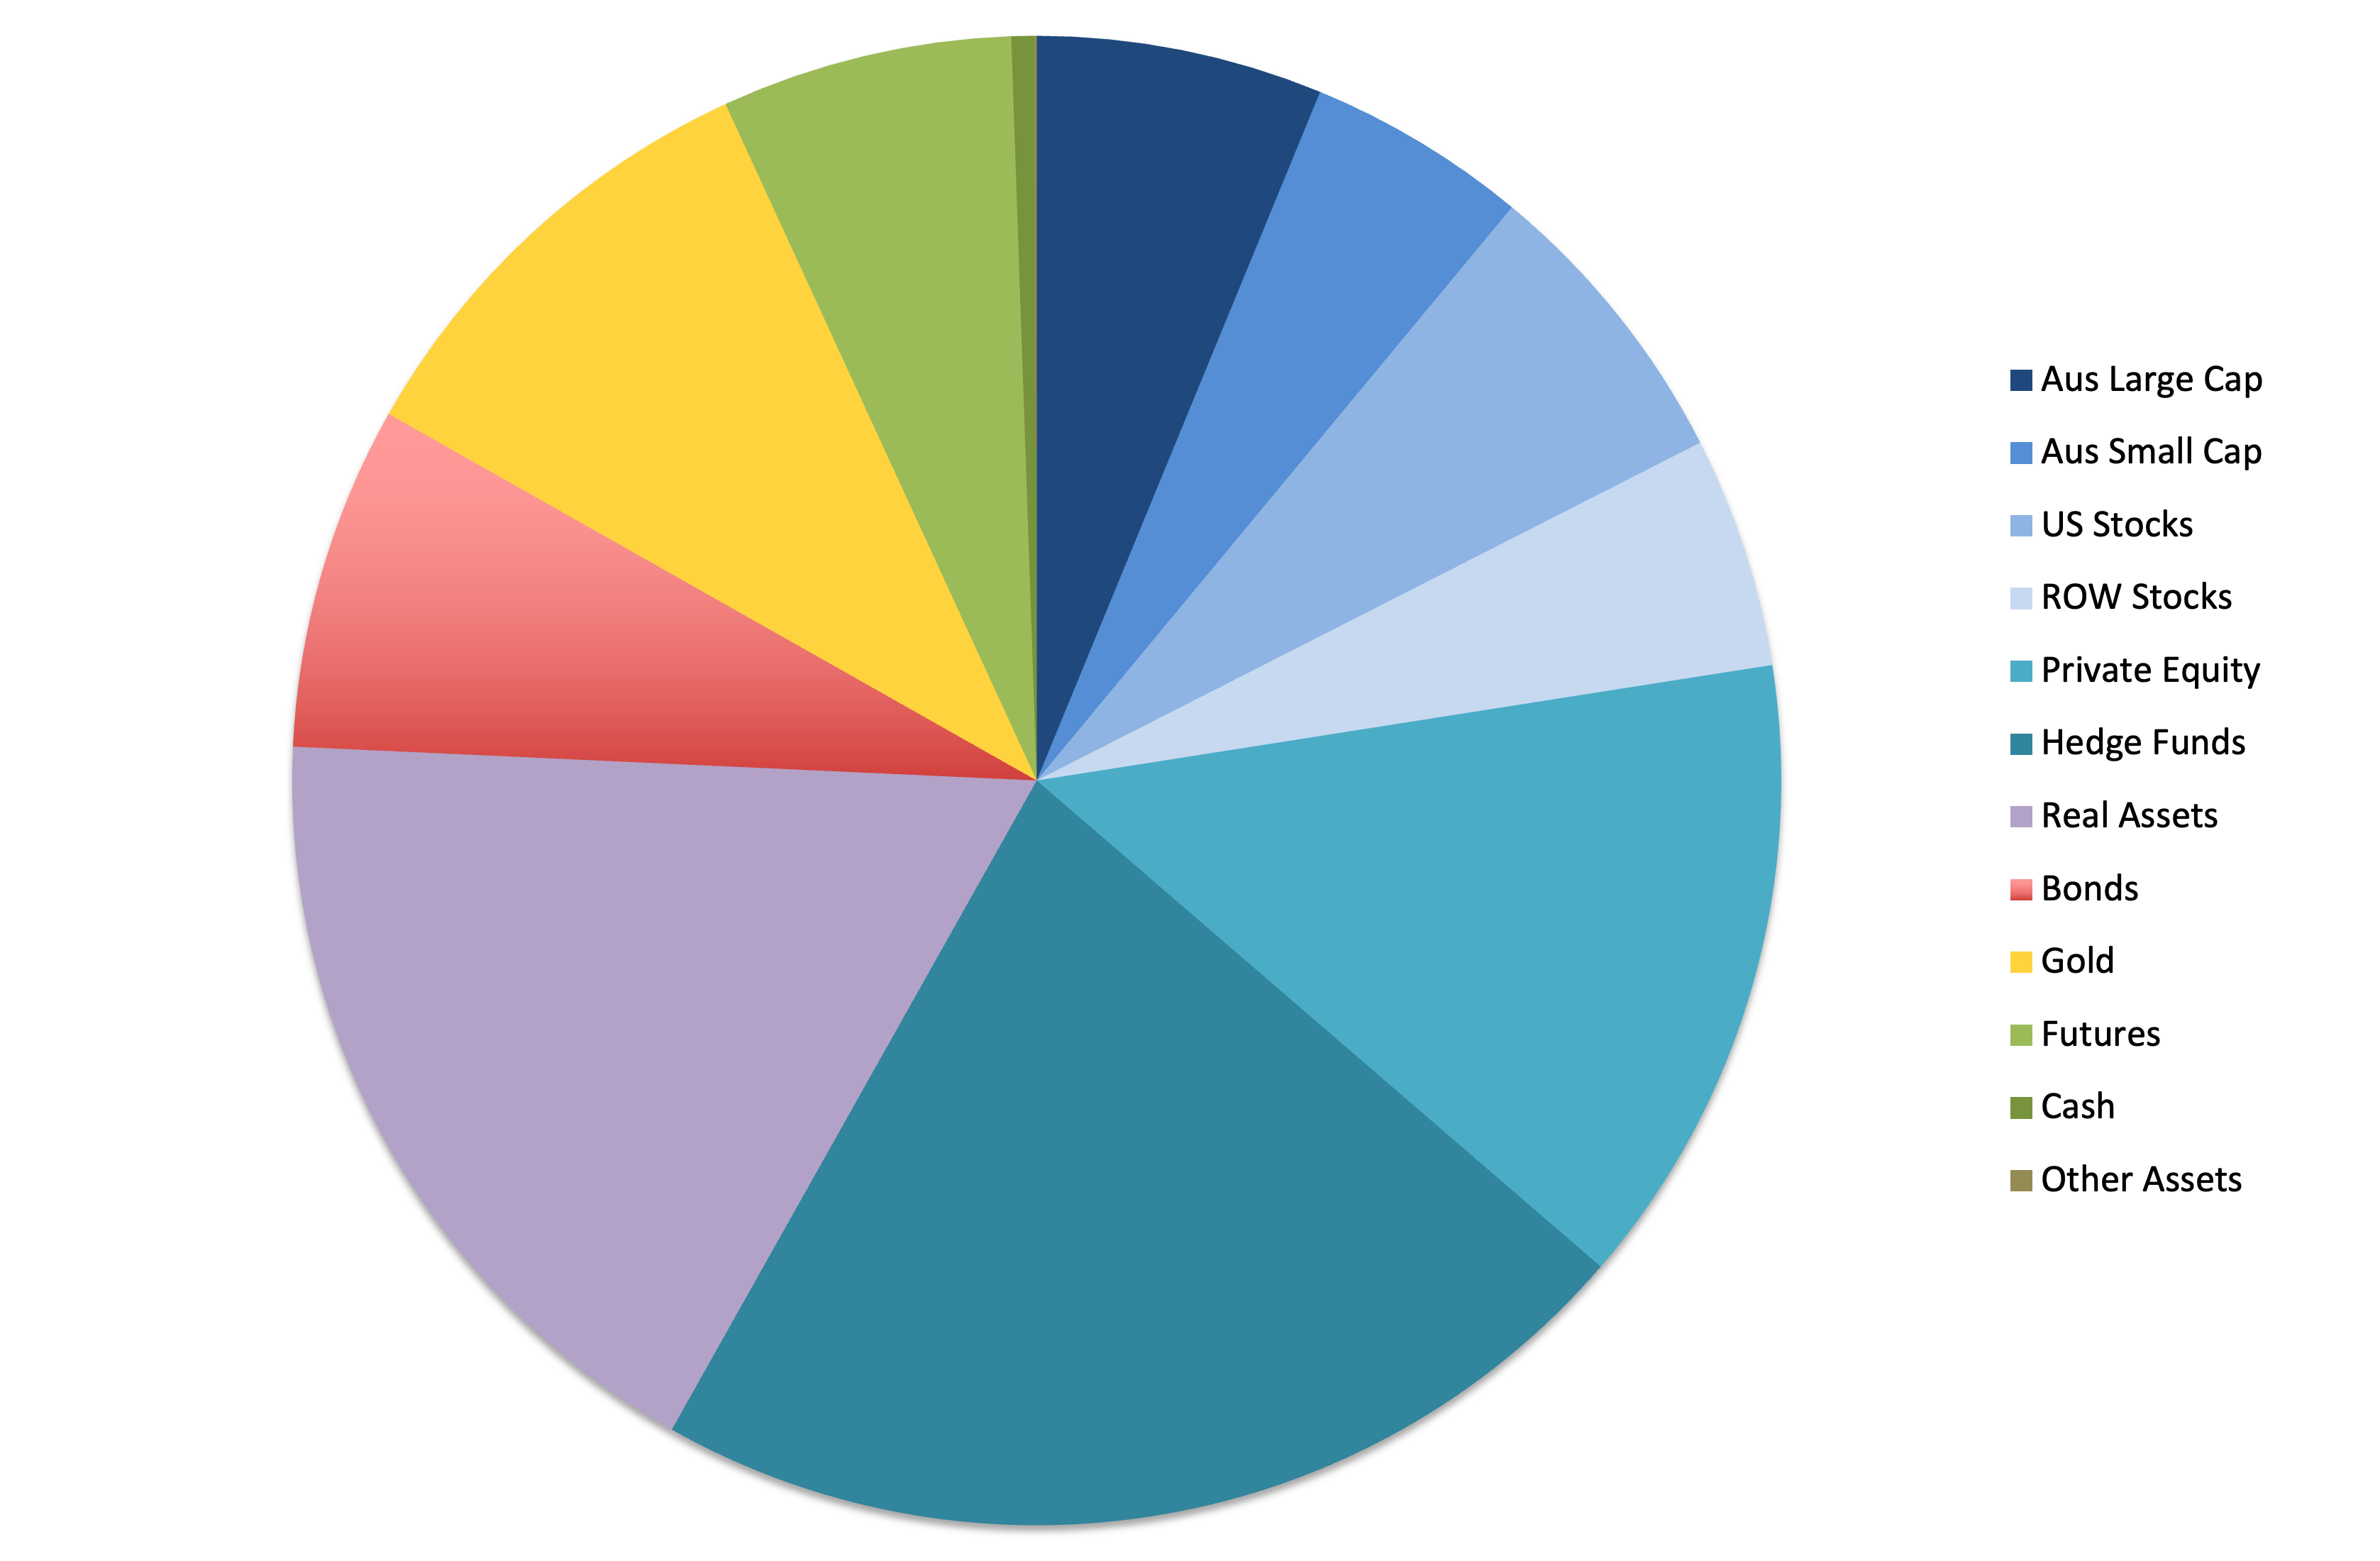
Investment Allocation 
There weren't large changes in asset allocation over the year:
 

Mainly, real assets fluctuated with our exposure to URF.AX, which is a very levered (effectively) US residential real estate fund.

Accounts
Here are our annual accounts in Australian Dollars: 
 

Percentage changes are for the total numbers. There are lots of quirks in the way I compute the accounts, which have gradually evolved over time. There is an explanation at the end of this post. 

We earned $153k after tax in salary etc. Total non-investment earnings including retirement contributions were $183k, down 9% on 2021. This was due to increased tax payments, fewer non-salary earnings, and fewer employee contributions to Moominmama's employer superannuation fund. We lost (pre-tax including unrealized capital gains) $166k on non-retirement account investments. A small amount of the gains were due to the fall in the Australian Dollar (forex). We lost $15k on retirement accounts with $30k in employer retirement contributions. The value of our house is estimated to have risen by $133k. As a result, the investment loss totaled -$45k and total income $139k.
 
Total spending (doesn't include mortgage payments) of $152k was again up 12% for the year. Spending was almost exactly equal to after-tax non-investment income. We saved just $488 from salaries etc.

$25k of the current pre-tax investment income was tax credits – we don't actually get that money so we need to deduct it to get to the change in net worth. We transferred $120k into retirement accounts the SMSF from existing savings. This included $20k as a concessional contribution for Moominmama. Therefore, looking at just saving from non-investment income, we dissaved $120k. The change in current net worth, was therefore -$306k.

Taxes on superannuation returns are just estimated because apart from tax paid by the SMSF all we get to see are the after tax returns. I estimate this tax to make retirement and non-retirement returns comparable.
The total implicit tax on supernnuation was a negative $1k because we lost money. Net worth of retirement accounts increased by $136k after the transfer from current savings.
 
Finally, total net worth fell by $37k.

Projections
Last year my baseline projection for 2022 was for a 16% rate of return, no increase in the value of our home, flat other income, and 6% growth in spending. This resulted in projected net worth increasing by $800k to around $6.7 million. Obviously, we came nowhere near this projection.
 
This year the baseline projection (best case scenario) is for an 11.2% investment rate of return in AUD terms (assuming the Australian Dollar rises to 75 US cents), inflation of 7.6% and an 11% nominal increase in spending, and about a 3% increase in other income, leading to an $550k increase in net worth to around $6.5 million or a 9% increase. This would be very little gain in real terms after inflation. But, again, anything could happen.
 
Notes to the Accounts
Current account includes everything that is not related to retirement accounts and housing account income and spending. Then the other two are fairly self-explanatory. However, property taxes etc. are included in the current account. Since we notionally converted the mortgage to an investment loan, mortgage interest is counted in current investment costs. So, the only item in the housing account now is increases or decreases in the value of our house. This simplified the accounts a lot but I still keep a lot of cells in the spreadsheet that might again be used in the future.
 
Current other income is reported after tax, while investment income is reported pre-tax. Net tax on investment income then gets subtracted from current income as our annual tax refund or extra payment gets included there. Retirement investment income gets reported pre-tax too while retirement contributions are after tax. For retirement accounts, "tax credits" is the imputed tax on investment earnings which is used to compute pre-tax earnings from the actual received amounts. For non-retirement accounts, "tax credits" are actual franking credits received on Australian dividends and the tax withheld on foreign investment income. Both of these are included in the pre-tax earning but are not actually received month to month as cash.... 
 
For current accounts "core expenditure" takes out business expenses that will be refunded by our employers and some one-off expenditures. This year, there are none of those one-off expenditures. "Saving" is the difference between "other income" net of transfers to other columns and spending in that column, while "change in net worth" also includes the investment income.
 
* Venture capital returns haven't been reported yet for the December 2022 valuation, but I don't expect them to make a big difference.

Sunday, January 08, 2023

December 2022 Report

Venture capital returns won't be reported for another month, but I expect them to be flat, so that the final numbers are not far from what they are now. In December, stock markets fell. The MSCI World Index (USD gross) lost 3.90%, the S&P 500 5.76% in USD terms, and the ASX 200 3.13% in AUD terms. All these are total returns including dividends. The Australian Dollar rose from USD 0.6788 to USD 0.6816. We lost 1.24% in Australian Dollar terms or 0.83% in US Dollar terms. The target portfolio is expected to lose 2.43% in Australian Dollar terms and the HFRI hedge fund index around 1.3% in US Dollar terms. So, we out-performed all benchmarks.

Here is a report on the performance of investments by asset class:

The asset class returns are in currency neutral returns as the rate of return on gross assets. I have added in the contributions of leverage and other costs and the Australian Dollar to the AUD net worth return.

Only gold and private equity had positive returns. Gold was the biggest contributor to returns and hedge funds the greatest detractor.

Things that worked well this month:

  • Gold gained AUD 14k and Pengana Private Equity (PE1.AX), 9k.

What really didn't work: 

  • Regal Funds (RF1.AX) lost AUD 12k followed by Hearts and Minds (HM1.AX) and Tribeca Global Resources (TGF.AX), which each lost 10k.

The investment performance statistics for the last five years are: 

The first three rows are our unadjusted performance numbers in US and Australian dollar terms. The MSCI is reported in USD terms. The following four lines compare performance against each of the three indices over the last 60 months. The final three rows report the performance of the three indices themselves. We show the desired asymmetric capture and positive alpha against the ASX200 and the MSCI but not against the hedge fund index. We have a higher Sharpe Index than the ASX200 but lower than the MSCI in USD terms. We are performing about 2.5% per annum worse than the average hedge fund levered 1.7 times. Hedge funds have been doing well in recently.

We are now very close to our target allocation. Our actual allocation currently looks like this:

About 70% of our portfolio is in what are often considered to be alternative assets: real estate, art, hedge funds, private equity, gold, and futures. A lot of these are listed investments or investments with daily, monthly, or quarterly liquidity, so our portfolio is not as illiquid as you might think.

We receive employer contributions to superannuation every two weeks. We are now contributing USD 10k each quarter to Unpopular Ventures Rolling Fund and less frequently there will be capital calls from Aura Venture Fund II. In addition, we made the following investment moves this month:

  • I bought 1,000 shares of PMGOLD.AX.
  • I tried to do a trade with around 12k shares of Regal Funds (RF1.AX). It wasn't successful.
  • I closed a tiny position of WLS.AX shares pending the merger of WLS into WCMQ.AX.
  • The remainder of our WLS shares will convert to WCMQ and our URFPA shares will convert to URF at the turn of the year.

Saturday, December 03, 2022

November 2022 Report

In November, stock markets continued their rebound and the Australian Dollar rose strongly increasing US Dollar returns relative to Australian Dollar returns. The MSCI World Index (USD gross) rose 7.80%, the S&P 500 5.59% in USD terms, and the ASX 200 6.78% in AUD terms. All these are total returns including dividends. The Australian Dollar rose from USD 0.6387 to USD 0.6744. We gained 3.05% in Australian Dollar terms or 8.81% in US Dollar terms. The target portfolio is expected to gain 1.23% in Australian Dollar terms and the HFRI hedge fund index around 1.0% in US Dollar terms. So, we out-performed all benchmarks apart from the ASX. 

Our SMSF hit a new high in terms of cumulative returns, exceeding the previous high in September 2021. It is now up more than 15% since inception and well ahead of our employer superannuation funds:


These are all in pre-tax terms - franking credits are included but no tax deducted. This will be a bit over-generous to the employer superannuation funds on the way up and the opposite on the way down. The increase in my US retirement account (TIAA) is to a large extent because of the fall in the Australian Dollar. It fell this month as the Australian Dollar rose. But the TIAA Real Estate Fund also performed extremely well over this period until recently.

Here is a report on the performance of investments by asset class: 

The asset class returns are in currency neutral returns as the rate of return on gross assets. I have added in the contributions of leverage and other costs and the Australian Dollar to the AUD net worth return.

Only futures had a negative return. RoW stocks were the best performer partly because of the rebound in the China Fund and hedge funds were the largest contributors to the month's return.

Things that worked well this month:

  • Tribeca Global Resources was again the top performer in terms of dollars gained (TGF.AX, AUD 25k). Coming in second and third were the China Fund (CHN, 18k) and Australian Dollar Futures (17k). Also gaining more than AUD 10k were 3i (III.L, 17k), Unisuper (16k), PSS(AP) (12k) Pershing Square Holdings (PSH.L, 12k), and gold (10k). With the exception of the China Fund and AUD futures, this is very similar to last month.

What really didn't work:

  • Winton Global Alpha Fund (-12k), Aspect Diversified Futures (-6k), and WAM Alternatives (WMA.AX, -4k) were the greatest detractors.

The investment performance statistics for the last five years are:

The first three rows are our unadjusted performance numbers in US and Australian dollar terms. The MSCI is reported in USD terms. The following four lines compare performance against each of the three indices over the last 60 months. The final three rows report the performance of the three indices themselves. We show the desired asymmetric capture and positive alpha against the ASX200 and the MSCI but not against the hedge fund index. We have a higher Sharpe Index than the ASX200 but lower than the MSCI in USD terms. We are performing more than 3% per annum worse than the average hedge fund levered 1.79 times. Hedge funds have been doing well in recent years.

We are now very close to our target allocation as Regal Funds diversifies its holdings. Our actual allocation currently looks like this:

About 70% of our portfolio is in what are often considered to be alternative assets: real estate, art, hedge funds, private equity, gold, and futures. A lot of these are listed investments or investments with daily, monthly, or quarterly liquidity, so our portfolio is not as illiquid as you might think.

We receive employer contributions to superannuation every two weeks. We are now contributing USD 10k each quarter to Unpopular Ventures Rolling Fund and less frequently there will be capital calls from Aura Venture Fund II. In addition, we made the following investment moves this month:

  • I sold 5000 shares of WAM Leaders (WLE.AX) and bought 1000 shares of the China Fund (CHN).
  • I sold USD 17.5k of the TIAA Real Estate Fund and bought the Social Choice Fund instead.
  • I bought 4000 shares of Regal Partners (RPL.AX).
  • I sold the 2000 shares I held in Fortescue Metals (FMG.AX). We made about AUD 4k on this trade.
  • I sold 10k shares of Regal Funds (RF1.AX) and bought 500 shares of URFPA.AX - the US Masters Residential Fund converting preference notes.
  • I sold 1,000 shares of Ruffer (RICA.L) to get money for our next subscription payment for Unpopular Ventures.

Saturday, November 05, 2022

October 2022 Report

In October, stock markets rebounded and the Australian Dollar ended close to flat. The MSCI World Index (USD gross) rose 6.06%, the S&P 500 8.10% in USD terms, and the ASX 200 6.06% in AUD terms. All these are total returns including dividends. The Australian Dollar fell from USD 0.6399 to USD 0.6387. We gained 2.85% in Australian Dollar terms or 2.66% in US Dollar terms. The target portfolio gained 3.07% in Australian Dollar terms and the HFRI hedge fund index is expected to be almost flat at 0.08% in US Dollar terms. So, we under-performed all benchmarks apart from HFRI, though we were not far from the target portfolio.

Here is a report on the performance of investments by asset class: 

The asset class returns are in currency neutral returns as the rate of return on gross assets. I have added in the contributions of leverage and other costs and the Australian Dollar to the AUD net worth return.

Only rest of the world stocks had a negative return, which was because of the poor performance of China. US stocks were the best performer and hedge funds the largest contributors to the month's return.

Things that worked well this month:

  • Tribeca Global Resources (TGF.AX, AUD 18k), Unisuper (15k), Pershing Square Holdings (PSH.L, 12k), and PSS(AP) (10k) were the largest contributors.

What really didn't work:

  • The China Fund (CHN, -9k) and Fortescue (FMG.AX, -4k) were the greatest detractors.

The investment performance statistics for the last five years are: 

The first three rows are our unadjusted performance numbers in US and Australian dollar terms. The following four lines compare performance against each of the three indices over the last 60 months. The final three rows report the performance of the three indices themselves. We show the desired asymmetric capture and positive alpha against the ASX200 but not against the hedge fund index nor the MSCI. We have a higher Sharpe Index than the ASX200. We are performing more than 3% per annum worse than the average hedge fund levered 1.76 times. Hedge funds have been doing well in recent years.

We moved towards our target allocation mainly by reducing exposure to hedge funds and gold. Our actual allocation currently looks like this:

About 70% of our portfolio is in what are often considered to be alternative assets: real estate, art, hedge funds, private equity, gold, and futures. A lot of these are listed investments or investments with daily, monthly, or quarterly liquidity, so our portfolio is not as illiquid as you might think.

We receive employer contributions to superannuation every two weeks. We are now contributing USD 10k each quarter to Unpopular Ventures Rolling Fund and less frequently there will be capital calls from Aura Venture Fund II. In addition, we made the following investment moves this month:

  • We received the payout from the sale of Gargantua.
  • I sold 5k shares of Cadence Capital (CDM.AX) to get some cash.
  • I sold 11k shares of Regal Funds (RF1.AX) that I bought in September.
  • I sold 1000 shares of PMGOLD (PMGOLD.AX) as the Australian Dollar gold price peaked a little. I'm now feeling that we are at a much more comfortable debt level in our margin accounts given the rise in interest rates and volatility.

Friday, October 14, 2022

Performance of Average Investors

 Latest version of the famous J.P. Morgan graph:

They estimate the returns for "average investors" from mutual fund flows. My return for this period was 6.12% (USD return). It's good that I am way ahead of the average investor but not good that I am behind a 60/40 portfolio (with no fees).

For a while now, I have been tracking these 20 year returns. Here is a graph with rolling 20 year USD returns for my portfolio and some key indices:

Each datapoint is the return for the 20 years up to that month. I started investing in 1996 and so the first observation is for September 2016. While I used to be worse than the median hedge fund, in the last couple of years my 20 year track record is a little bit better than the hedge fund index. I like to think it is more important to perform well the more money you have to invest :) In other words, dollar-weighted returns are more important than time-weighted returns.


Monday, October 10, 2022

Gargantua by George Condo Sold

Masterworks sold the third painting that I invested in, Gargantua by George Condo. The original offer price to investors was $1.65 million and they sold it for $2.55 million. After performance fees, sales costs etc. the proceeds are probably within 5% of the most recent estimate they provided.

Saturday, October 08, 2022

September 2022 Report

In September the stock markets again fell sharply and the US Dollar rose. The MSCI World Index (USD gross) lost 9.53%, the S&P 500 9.21% in USD terms, and the ASX 200 6.14% in AUD terms. All these are total returns including dividends. The Australian Dollar fell from USD 0.6855 to USD 0.6399 and even fell against the Pound. We lost 1.74% in Australian Dollar terms or 8.28% in US Dollar terms. The target portfolio lost 1.28% in Australian Dollar terms and the HFRI hedge fund index lost 2.27% in US Dollar terms. So, we out-performed the stock market indices but not these alternative benchmarks.

Here is a report on the performance of investments by asset class: 

The asset class returns are in currency neutral returns as the rate of return on gross assets. I have added in the contributions of leverage and other costs and the Australian Dollar to the AUD net worth return.

Only gold had a positive return and that was only because of the fall in the Australian Dollar - we hold our gold mostly in the ASX listed PMGOLD ETF. The Australian Dollar was the biggest  positive contributor to performance measured in Australian Dollars and hedge funds were the biggest detractor, though Rest of World Stocks had the worst rate of return.

Things that worked well this month:

  • After gold (AUD 13k), Regal Funds (RF1.AX) gained 10k, Winton Global Alpha 9k, and Aura VF2 8k.

What really didn't work:

  • Tribeca Global Resources lost AUD 28k, followed by Australian Dollar Futures lost 21k, and Unisuper at-17k.

The investment performance statistics for the last five years are: 

The first three rows are our unadjusted performance numbers in US and Australian dollar terms. The following four lines compare performance against each of the three indices over the last 60 months. The final three rows report the performance of the three indices themselves. We show the desired asymmetric capture and positive alpha against the ASX200 but not against the hedge fund index nor the MSCI. Compared to the ASX200, our rate of return has been almost the same, but our volatility has been almost 5% lower. We are performing almost 4% per annum worse than the average hedge fund levered 1.76 times. Hedge funds have been doing well in recent years.

We moved towards our target allocation. Our actual allocation currently looks like this:


About 70% of our portfolio is in what are often considered to be alternative assets: real estate, art, hedge funds, private equity, gold, and futures. A lot of these are listed investments or investments with daily, monthly, or quarterly liquidity, so our portfolio is not as illiquid as you might think.

We receive employer contributions to superannuation every two weeks. We are now contributing USD 10k each quarter to Unpopular Ventures Rolling Fund and less frequently there will be capital calls from Aura Venture Fund II. In addition we made the following investment moves this month:

  • I sold my holding of 10k Pendal shares (PDL.AX). Perpetual, which is taking over Pendal seems to continue to sink in price since the merger was announced.
  • I participated in the Regal Investment Partners (RPL.AX) rights issue.
  • I did some trading of Regal Funds (RF1.AX). It is tending to fluctuate around the NAV.
  • I shifted another AUD 25k from Aspect Diversified Futures Wholesale to First Sentier Developing Companies on the Colonial First State platform and then sold and withdrew the rest of our holding to reduce debt.
  • I sold 20k Cadence (CDM.AX) shares to increase cash in our SMSF brokerage account.
  • I did a quick Australian Dollar Futures trade, which didn't work out well.

Monday, October 03, 2022

Heading for a Fall in Net Worth

 This is why I have been concerned about saving money recently:

I'm currently forecasting that this year comprehensive after-tax income (including superannuation and unrealized capital gains/losses) will be less than spending. This would be the first decline in end of year net worth (not counting our house) since the financial crisis.


Sunday, September 04, 2022

August 2022 Report

August was a mixed month. The MSCI World Index (USD gross) lost by 3.64% and the S&P 500 lost 4.08% in USD terms, but the ASX 200 gained 1.43% in AUD terms. All these are total returns including dividends. The Australian Dollar fell from USD 0.6968 to USD 0.6855 but it rose against the Pound from one Pound buying AUD 1.7430 to AUD 1.6958. We gained 0.25% in Australian Dollar terms but lost 1.38% in US Dollar terms. The target portfolio lost 0.71% in Australian Dollar terms and the HFRI hedge fund index rose 0.50% in US Dollar terms. So, we out-performed three benchmarks and under-performed two.

Here is a report on the performance of investments by asset class: 

The asset class returns are in currency neutral returns as the rate of return on gross assets. I have added in the contributions of leverage and other costs and the Australian Dollar to the AUD net worth return.

Hedge funds were the biggest contributor to performance followed by futures, which had the strongest return. US stocks were the worst performer followed by gold and rest of the world stocks.

Things that worked well this month:

  • Pershing Square Holdings was the best performer (AUD 11k) followed by Aspect Diversified Futures (10k) and Winton Global Alpha (8k).

What really didn't work:

  • Australian Dollar Futures lost AUD 7k.

The investment performance statistics for the last five years are: 

The first three rows are our unadjusted performance numbers in US and Australian dollar terms. The following four lines compare performance against each of the three indices over the last 60 months. The final three rows report the performance of the three indices themselves. We show the desired asymmetric capture and positive alpha against the ASX200 but not against the hedge fund index nor the MSCI. Compared to the ASX200, our rate of return has only been 0.6% lower, but our volatility has been 5% lower. We are performing 2% per annum worse than the average hedge fund levered 1.7 times.

We moved a bit away from our target allocation. Our actual allocation currently looks like this:

About 70% of our portfolio is in what are often considered to be alternative assets: real estate, art, hedge funds, private equity, gold, and futures. A lot of these are listed investments or investments with daily, monthly, or quarterly liquidity, so our portfolio is not as illiquid as you might think.

We receive employer contributions to superannuation every two weeks. We are now contributing USD 10k each quarter to Unpopular Ventures Rolling Fund and less frequently there will be capital calls from Aura Venture Fund II. In addition we made the following investment moves this month:

  • I bought AUD 75k of units in the Aspect Diversified Futures Fund (Class A). This cash came from the redemption of Pershing Square Tontine Holdings. 
  • I sold AUD 25k of the First Choice Wholesale version of this fund and bought units of First Sentier Developing Companies instead.
  • I switched about USD 17k from the TIAA Real Estate Fund to the TIAA Social Choice Fund (a balanced fund).
  • I traded 10k shares of Regal Funds (RF1.AX) a couple of times.
  • I invested USD 2.5k in a start-up offered by the Unpopular Ventures syndicate. 
  • I sold 12.5k shares of WAM Leaders (WLE.AX) to fund venture capital investments.
  • I sold 3k shares of Ruffer Investment Company (RICA.L) for the same purpose. 
  • We received the payout from the sale of Lured.