Tuesday, October 31, 2006
First Impressions of IB and Futures Trading
I spent some time last night getting used to the IB system and making paper trades in NASDAQ 100, 10 year bond, and Australian Dollar futures. Someone posted recently in response to one of my blogposts that trading all three would be like having three full time jobs, if trading QQQQ was like a full time job. I don't think so but it is hard to execute a paper trading strategy and a real trading strategy at the same time if they are not identical and you also have another real full time job... This morning I was feeling rather nervous, not because I would lose "money" on the paper trading but that it was taking my attention away from the real trading and some time today I need to get a lot of other work done. Being a professor gives me a lot of flexibility about when I do a large portion of my work, but it still has to get done... So I closed out the paper trades and either later today or tomorrow I will take a look at the daily statement generated to get familiar with that. IB also update your account value on the fly and I found some quirks in that, some of which may just be bugs in the paper trading simulation. One is that the standalone Trader Workstation (TWS) gives you the current profit and loss and realized and unrealized portions on each position. But when I opened a chart (which is initially disabled on new accounts) all that disappeared! The browser based version of TWS didn't seem to give me that at all. I will have to check my real account. Also I didn't really understand how they compute various of the figures regarding margin - there doesn't seem to be much rationale. I asked an experienced futures trader and he said he didn't understand it either. I would have expected that the initial required margin would be moved into my "commodities account" and then that value would fluctuate with the profit and loss. But the amount is somewhere between the initial and maintenance margin. I should probably do some deliberately "money" losing trades and see what happens when the maintenance margin is hit. The charts are pretty flexible though as slightly less user friendly (not surprising) than those in Ameritrade. They don't look as dynamic as Ameritrade's charts - but if you look closely they show exactly the same information.
Monday, October 30, 2006
My First Paper Trade
Bought 13 Australian Dollar contracts @ 0.7675. IB gives you $1M in imaginary play money and the underlying value of an Australian Dollar futures contract is $A100,000. So hedging $US1M into AUD requires 13 contracts. Now I am looking through all the reports generated to try to understand what happened. A bonus of IB is all the contextual help menus are very useful.
Paying Money Overseas
Paying money overseas gets easier and easier as credit card payments get more widespread internationally. But sometimes you need to pay in foreign currency. It isn't hard to do this if you know how. You go to your bank and either buy an international money order and mail it or wire the money to an account directly. But you need to know. I was just talking to my mother today. We are still trying to get money from the German government in compensation for property that was seized by the Nazi regime. As an aside, this is one reason I'm not a big fan of real estate as an investment. It is a long story - the property is in Eastern Germany and until 1989 there was no way to get anything from the Communist government of the Deutsche Demokratische Republik. Some time after 1989 (1995) we were contacted by a lawyer that we could make a claim and since then we have been in process. We have received some money. My mother decided to split our share of the value between my brother and I. So far I've received about $7000. This was my share of one of our properties. Now we are trying to get the money for the second property and several months ago the German government required us to pay a small number of Euros as a fee to get to the next stage. Finally, today I understood that the reason this is still held up is instead of paying in Euros my mother sent a personal check in Sterling drawn on her bank in London. Obviously the check hasn't been cashed. It would probably cost the government agency there about as much to cash a personal check in foreign currency as the fee is worth... Her reason why she didn't send payment in Euros is that the bank where she lives gave her a hard time about paying in Euro. I can't really get a straight answer why. I think they just told her it would cost a lot and discouraged her so she took the "easy" way out and sent a personal check in the wrong currency. I told her to phone the lawyer and tell him what she did and what can she or he do next.... Hopefully soon this story will finally be over
Saturday, October 28, 2006
And Today Wasn't
a good trading day. I closed out the MSFT trade for a profit which was the only good thing that happened. HCBK was downgraded by Merrill Lynch. The model predicted a turning point at last night's close, but if the stochastic rose above 80 that turning point would be negated. So the stochastic was above 80 until around midday when the market suddenly fell. I was still convinced the uptrend was continuing though so I tried to go long part way into the fall after getting stopped out. Bad move.... Oh well, I didn't lose as much as I made yesterday. It now does seem that we are back in a downtrend.
Friday, October 27, 2006
Market Update
In my existing accounts I bought some Microsoft shares this morning in anticipation of this evening's earnings release. I remain long QQQQ. The model is long but tomorrow could be a turning point unless the stochastic rises above 80. If today's close is strong that is possible. At the moment the market is down a bit due to the fall in new home prices announced at 10am of 9.7% since September 2005. This was the biggest fall year on year since that index started keeping records. Sales of new homes though increased and the housing sector ETF, XHB is up.
4:49pm Update
Turned out to be a very good trading day. Berkshire Hathaway B (BRK/B) shares rose $98! Unfortunately I only own one share :( I did some day-trading of Redhat (RHAT) which fell more than 25% and then rebounded a little. I also bought Microsoft (MSFT) shares in anticipation of this evening's earnings. Though Microsoft beat analysts' expectations by more than 10%, some traders initially thought they were guiding to a much lower earnings number for next quarter. Turns out they expect to earn roughly in line with analysts' estimates but are deferring a third of the income to the following quarter due to Vista related issues. Also bought shares in Hudson City Bank Corp (HCBK) - a New Jersey based thrift. Not sure if this is a position trade or an investment. Will have to see what happens. There is a chance that it will be added to the S&P 500 soon. Also it has a large amount of excess cash for a bank and is buying back shares. However, the P/E is very high for a bank and so these expectations may already be built into the price. On the other hand with all that cash it should do fine if the housing market really implodes and maybe be in a position to acquire other banks down the road?
Thursday, October 26, 2006
Interactive Brokers Account Operational
After faxing a copy of my driver's license to IB yesterday my IB account is finally operational. All I've done so far is log in, look at some quotes, and put in a request for a paper trading account. Expect more reports as I figure out how to use the different tools and make some paper trades.
Nationwide Retirement Score
I just did the online retirement preparedness quiz. Like most such questionaires it didn't ask the big question about inheritance. Do people think that that is inappropriate, or too uncertain, or make people feel put off by feelings of envy for those with large inheritances, or the providers just want to minimize people's assets so that they save more with the provider in question?
I don't think it asked about assets such as businesses either. Very much designed for the middle-class employee...
I scored 125. What is your score?
I don't think it asked about assets such as businesses either. Very much designed for the middle-class employee...
I scored 125. What is your score?
Wednesday, October 25, 2006
New NetWorthIQ Release
NetWorthIQ have a new release. The new version splits out non-owner occupied real estate. I think that is a great improvement. They also have some notes attached to each net worth category on the net worth updating page explaining what should go in each entry. Good start on both. Splitting out the value of businesses is another thing I would like to see. Mentioning where more exotic investments and loans like margin loans and short positions should go would also be useful. I lump the latter into "other debt". I could just put the net worth of my brokerage account under "stocks" but that would be a bit misleading. Once I break out the cash and include that in cash the short positions would result in a negative stock value. At the moment I include options under "other assets". Therefore those have to go in other debt. Don't know yet how I will treat futures positions. Actually, as they now list REITs and other real estate funds under "other real estate" I am going to have to go back and recompute all my entries!
Reality Check
At this point there doesn't look like any way I am going to meet my original goal of getting to $370,000 by the end of this year. So I am lowering the goal to $350,000. That would still be a 30% gain in net worth and more than my minimal goal of a $50,000 gain. The same growth rate implies goals of $450k for 2007, $575k for 2008, $775k for 2009, and $1M for the end of 2010. These are still very steep goals. But they are something to aim for that is not totally unrealistic.
Monday, October 23, 2006
Risk and Return in a World Where Only Relative Wealth Matters
Eric Falkenstein, a hedge fund manager in Minneapolis with a PhD in economics, has written a fascinating paper (warning: grad-level economics stuff :)) about risk and return on investments in a world where investors only care about their wealth relative to others and their returns on investment relative to others returns on investment. The rationale for investigating this idea is that:
1. The traditional CAPM (Capital Asset Pricing Model) doesn't have much empirical support - the average rate of return on high beta stocks isn't higher than on low beta stocks.
2. Much research on happiness in economics has shown that beyond a basic subsistence level relative wealth matters more than absolute levels of wealth.
3. The prevalence of index investing and relative return investing. This may have been accompanied by a trend to lower risk premia for stocks, corporate bonds, and other traditionally risky assets over time.
He argues that if all you care about is relative wealth then holding the average market portfolio has zero risk. Deviating from the market portfolio is risky. If this is true then the rate of return on all assets in the market portfolio is equal. There is no extra reward for investing in assets with higher variances of returns compared to the market portfolio whether those risks are correlated with the market portfolio (high beta) or not (idiosyncratic risk). I have yet to work through the implications (except that there is no extra reward for buying and holding stocks in such a world over buying 90 day T-Bills) but if the guy is right he could be on the path to a Nobel Prize in Economics... I understand the paper, but I as I am not a specialist in financial economics I don't know if there are any flaws in his argument which aren't immediately obvious.
Friday, October 20, 2006
Rentometer
A Zillow for renters: Rentometer. Very cool. Oh and both my apartment and my girlfriend's are very good deals, not surprisingly :)
Sunday, October 15, 2006
Marriage, non-Marriage, and Economics
An interesting article in the NY Times today discusses the implications that now a minority of US households consist of married couples with or without children. A quote: “we have an anachronistic view as to what extent you can use marriage to organize the distribution and redistribution of benefits” expresses how I feel about the way taxation, benefit, and other systems are set up in the US. In my opinion the state should only play a role in helping (or not) raising children who are not able to fend for themselves and are society's future members. I don't see why the state should be at all involved per se in partnerships with or without children involved. The reason they are involved is because historically women had very limited economic opportunities so it was natural to provide benefits to women who were married and not working through their husbands (for example by inheriting social security payments). Rather than extend such an anachronistic system to further people through gay marriage (though the numbers are small as this article points out and so practically don't make a big difference) I would favor making the system more gender neutral and individual based and allow people to develop partnerships as they see fit without worrying about the financial implications. Many countries have systems that are much closer to my ideal. Australia, one of the two countries I am a citizen of (and the other one is not the United States) is closer to this ideal in many ways. Changing a small country, populationwise, is probably easier than changing institutions in a country as large as the US.
Friday, October 13, 2006
Stopped Out Again
Again the model was stopped out today. I lost a lot of money. The majority of my profits from this experimental trading period have been lost. In fact I am back to the return the market has given over this period. From that perspective I guess it hasn't been too much of a disaster? :) If one stuck exactly to the model a day like today wouldn't be disastrous. But if you don't trade the system properly days like today are very bad news. Over this period I have improved the model and decision rules a lot. It is a much better system than at the beginning of the period. So it hasn't been a waste. I am not giving up. I still have some profits left and a tool that in theory can produce tremendous profits. I'm not sure what the problem has been. Too much leverage does make me nervous and do dumb things. I plan to use less leverage going forward and try to stick more closely to the model signals. Doing what are really two full time jobs at the same time is hard. I end up doing neither very well. On the other hand trading more than one thing simultaneously in smaller amounts in each instrument would be psychologically easier. Soon I will be able to start paper trading at IB (I initiated the transfer of $5000 today). I am thinking to experiment with trading two or three instruments simultaneously. As it won't be real money I won't be worried about losing money. Probably trading NDX, bonds, and Australian Dollars would be a good combination as the three assets have little correlation with each other. I won't have time to model bonds and dollars so I will trade these purely on the basis of charts. Right now I'd be long the AUD and short bonds probably.
Wednesday, October 11, 2006
The Old Model Won
The old model won today as NDX ended up a couple of points and even the new "averaged stochastic" rose. But really the market didn't go anywhere much. Tomorrow these various stochastics almost absolutely have to fall due to the way they are computed. Will it be a down day finally? One potential trigger is the beginning of earnings season. Alcoa reported after the close and did not meet expectations.
I won't be updating the old model unless the new doesn't prove to be better in actual trading. In simulated trading since January 1st and June 30th this year it strongly outperforms the old model, even if today, the first day of using it was not one of those outperforming days.
I remember Teresa Lo from years back when she posted on Silicon Investor. Now she also has a blog and my impression is she has a similar attitude to me somewhere between academic finance and technical analysis and trying to work out objectively what works and what doesn't. She also emphasizes the very important role of psychology in trading success.
Tuesday, October 10, 2006
Major Model Improvement?
I noticed today that the standard slow(5,3) stochastic began to decline today while my preferred full(5,5,3) stochastic increased steeply. The existing model forecast predicts a decline in the market starting on Wednesday. But with the slow stoch already declining I would feel uncomfortable about being long. I did some trading simulations on a spreadsheet and found that the slow(5,3) stoch is often too early in determining changes in trend while the full(5,5,3) stoch is too late. Is this why I find it hard to stick to trading the model? Averaging the two stochastics outperforms either of the two stochastics. So now I have applied the forecasting models to this averaged stochastic. All three indicators estimated using the new model say the averaged stoch will fall on Tuesday. To do that the NDX must fall at least 10 points. Therefore, the model's decision is to get short at today's close.
Monday, October 09, 2006
Getting Started with Technical Analysis
Million Dollar Countdown asked for some advice on introductory books on technical analysis. There are only two technical analysis books I have ever read. One is the classic guide to interpreting charts by Edwards and Magee. This book provides the fundamental rationale for technical analysis. Once you read this, hopefully, you will be convinced that movement in the financial markets is not totally random. They explain the basics of price and volume action in the markets. This kind of understanding is even more important in intraday trading than in interpreting large scale chart patterns. This edition has been much updated from the 1960s edition I borrowed from our university library in Australia. The other book is Frost and Prechter's "The Elliott Wave Principle". Elliott wave theory systematizes a lot of the formations and ideas found in traditional technical analysis as presented by Edward and Magee. Everything else I know I picked up on the web or developed myself. Stockcharts.com has an excellent "chart school" for example.
I am very skeptical about a lot of the other technical analysis out there. Some of it makes no sense to me coming from a background in time series analysis and much of the rest is not very predictive. Those latter methods may be good for working out which waves the market has gone through and maybe E-Wave could then help in predicting what might come next but the indicator itself doesn't predict anything. One such indicator IMO is the much used MACD. However, I have found that stochastic oscillators are much more useful and can be used to predict the market to some degree. Then there are methods, which are hard to comprehend but seem to produce excellent results.
As a beginner a reasonable goal is to understand technical analysis well enough to avoid making stupid and expensive mistakes.
Interactive Brokers Application
I finally got around to submitting an application for an account with Interactive Brokers. Security checks are now running before I can actually fund the account. My plan is to initially deposit $5000 from my HSBC Online Savings account which I have been saving up. That's the minimum amount required to open an account. At this stage I signed up for all US stock, options, and futures markets. You can also trade a number of foreign markets, but I don't have any need for that at the moment and one can always add additional permissions as required. IB has a paper trading facility and I plan to use it initially to get used to futures trades which is what I plan to use the account for initially. Once I get used to trading I will initially trade one E-Mini NASDAQ contract which is equivalent to 800 QQQQ shares. I also will look at trading Australian Dollar contracts to hedge my Australian Dollar and US Dollar exposures. The reason I want to trade stock futures is because under the 60/40 rule they are taxed at lower rates than short-term stock trades. Being able to modify my currency exposure without wiring money between the US and Australia is also attractive. The Australian Dollar ETF (FXA) is not a viable alternative. To sell short $A100,000 requires margin of about $US37,500. Using futures the required margin is only about $US1,500 for the same transaction (and the taxes on gains are lower). My new short-term goal is to reach a total of $65,000 in my three U.S. trading accounts.
Sunday, October 08, 2006
Zillow?
Has anyone else noticed that Zillow hasn't updated any house prices for the last three weeks (since 9/15/06)? What's up over there? Frustrating for financial markets junkies like me! Zillow is a great easy to use service though it has its quirks like not updating past estimates when new information becomes available which can lead the trends in prices to be very unreliable. Hope this lack of updating doesn't signal some trouble with this enterprise.
Thursday, October 05, 2006
Labels!
I upgraded to the new Beta Blogger, so that I could get faster publishing and add labels to my posts. I have long wanted to be able to categorize posts so that I could find those posts about long-term planning, personal finance, or economics, amongst all the posts about trading. Hopefully, my readers will find it useful too! I've added a categories menu to the sidebar. In goals posts I set out my goals, in planning posts develop my plans to achieve them, and then report on achievement of goals in performance posts. Monthly reports are highlighted separately from other performance posts. The largest number of posts are updates on market direction and my trading with a few of these posts mentioning the trading model highlighted as well. Posts on retirement cover both my own plans and more general thoughts. Thoughts on other aspects of personal finance are listed separately. There is a similar approach to tax issues - my own tax issues and more general thoughts about tax. There are also links to commentary by other commentators and my own comments on both macro- and micro- economics. Posts on the housing market have their own category. Finally, there are just some links to useful websites that don't fit in any other category.
Elliott-Wave Count for NDX

If this count is correct then there could be some more upside left. But the Full(5,5,3) stoch can only rise at most to 64 tomorrow. If the index ends much below the high of the day then the stoch will fall. A continued strong rally therefore seems unlikely on that basis.
Final Report for September
Investment Performance
Investment return in US Dollars was -0.77% vs. a 1.19% gain in the MSCI World Index, which I use as my overall benchmark and a 4.71% gain in the NDX which I use as a trading benchmark. The trading accounts lost 4.2%. Investing like a hedge fund should result in more stable returns than if I was a pure investor or pure trader. Total returns in terms of Australian Dollars were a gain of 1.14%. The best performer of the month was Mayne Pharma, which was subject to a takeover offer resulting in a gain of $A2330. The second best performer was the CFS Conservative Fund, my biggest single investment, with a gain of $A2186. The worst performer was QQQQ trading with a loss of $US1833.
Asset Allocation
At the end of the month the portfolio had a beta of -0.51 (a 1% rise in the market would result in a 0.51% decline in the portfolio). Assets were allocated as follows:
Asset Class:
Stocks Long 39.37%
Stocks Short -35.72% (QQQQ)
Put Options 1.39% (QQQQ)
Bonds 45.79%
Real Estate 4.94%
Hedge Funds 3.15%
Cash 50.04%
Loans -9.15%
Asset Loans 0.18%
Much of the cash is used as margin for the short position. Bonds are held via the CREF Bond Market Fund and the CFS Conservative Fund. 64% of net assets are deemed to be AUD related and 25% USD related with the remainder in global funds.
Net Worth Performance
Net worth declined by $US207 to $US330131 but in Australian Dollars gained $A9529 to $A442,421.
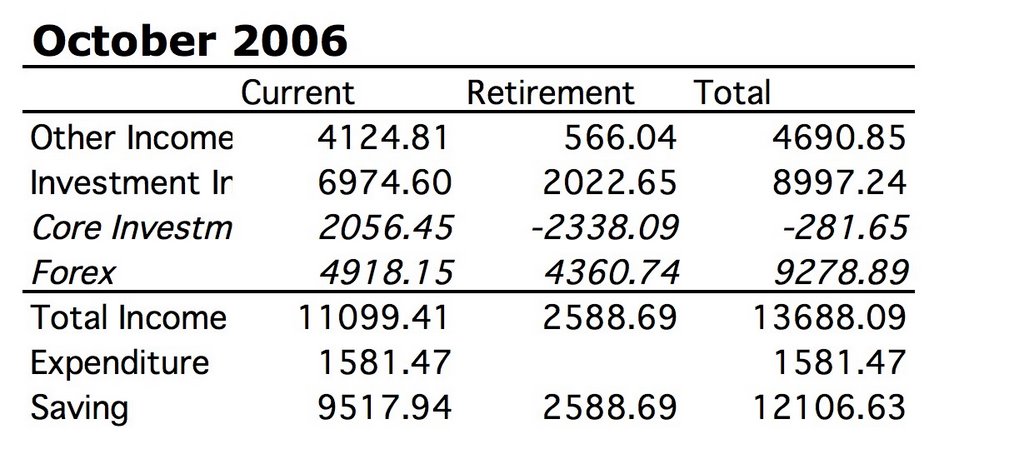
Income and Expenditure
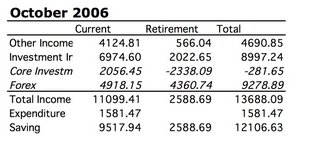
As you can see total investment income was $US3197 before taking into account foreign currency fluctuations which resulted in a net investment loss of -$US2553. Expenditure was $US2054 - as usual living well within my means.
Investment return in US Dollars was -0.77% vs. a 1.19% gain in the MSCI World Index, which I use as my overall benchmark and a 4.71% gain in the NDX which I use as a trading benchmark. The trading accounts lost 4.2%. Investing like a hedge fund should result in more stable returns than if I was a pure investor or pure trader. Total returns in terms of Australian Dollars were a gain of 1.14%. The best performer of the month was Mayne Pharma, which was subject to a takeover offer resulting in a gain of $A2330. The second best performer was the CFS Conservative Fund, my biggest single investment, with a gain of $A2186. The worst performer was QQQQ trading with a loss of $US1833.
Asset Allocation
At the end of the month the portfolio had a beta of -0.51 (a 1% rise in the market would result in a 0.51% decline in the portfolio). Assets were allocated as follows:
Asset Class:
Stocks Long 39.37%
Stocks Short -35.72% (QQQQ)
Put Options 1.39% (QQQQ)
Bonds 45.79%
Real Estate 4.94%
Hedge Funds 3.15%
Cash 50.04%
Loans -9.15%
Asset Loans 0.18%
Much of the cash is used as margin for the short position. Bonds are held via the CREF Bond Market Fund and the CFS Conservative Fund. 64% of net assets are deemed to be AUD related and 25% USD related with the remainder in global funds.
Net Worth Performance
Net worth declined by $US207 to $US330131 but in Australian Dollars gained $A9529 to $A442,421.
Income and Expenditure
As you can see total investment income was $US3197 before taking into account foreign currency fluctuations which resulted in a net investment loss of -$US2553. Expenditure was $US2054 - as usual living well within my means.
Stopped Out
The model stopped out. If this level holds then the model will reverse to the long stance again. The fluctuations in the last couple of weeks or so have been too rapid to trade and have whipsawed the model around to lose money or go sideways... From an E-Wave perspective the NASDAQ 100 index could be forming an ending diagonal formation. That would be the bearish case as that is the end of a move... But a new post July high would be coming in the next days... Bottom line is things are now as unclear as they have ever been.
Wednesday, October 04, 2006
New ATH on the Dow
Yes there was a new intraday all time high (ATH) and a new closing ATH on the Dow. NDX was up a bit on the day but totally within model expectations. So the model, which officially went short at Monday's open, remains short.
Update on model performance to date. Based on 63 real time trading days so far the model has a beta of 0.09 and alpha of 153%, Sharpe Ratio of 6.26. These values haven't changed much each day as new data comes in.... My account for only the 4 monthly data points has a beta of -0.77 and alpha of 128% (Sharpe ratio of 2.50). So that means if the market makes 10% p.a. trading like this makes 130% p.a. Still very few datapoints for that analysis. If one could trade the model perfectly with no leverage one would get 159% p.a. on that basis. For comparison, typical hedge funds have Sharpe Ratios (return/standard deviation) of 2 or so. Market indices are always lower than that. Some hedge funds have recorded 100% plus years but never for more than a year or so. The very best hedge funds would record runs of 30-40% returns. Though those are after fees so they were doing better before that.
Monthly data so far:
July
NDX: -4.18%
Model: 10.44%
Account: 13.06%
August
NDX: 4.66%
Model: 8.36%
Account: 13.19%
September
NDX: 4.71%
Model: 6.23%
Account: -4.20%
October (first two days)
NDX: -0.84%
Model: 0.84%
Account: 3.83%
So far to date:
NDX: 4.13%
Model: 28.20%
Account: 27.28%
Sunday, October 01, 2006
Provisional Report for September
Not a good month, but not a terrible one either. The model gained 6.23% compared to an NDX gain of 4.71% but my trading accounts lost 3.94%. Overall my portfolio looks like it lost 1.5% while the MSCI is up 1% and net worth is down about $1000. But this is partly due to the fall in the Australian Dollar. Preliminary net worth seems to be up around $A8000. More detailed results will come in a few days time.
For Monday, even if prices are level with Friday's close the stochastic will fall below its three day moving average and below the critical 80 level. So unless some very good news can give the market a boost, expect prices to fall. In simulations I have run with my older "autoregressive model" there is pretty much limitless downside with no support if a major downmove gets underway. This doesn't mean it will but technical indications from E-Wave to the McClellan Oscillator are weak and mean that the probability of a downmove is much higher than that of a continued rally.
For Monday, even if prices are level with Friday's close the stochastic will fall below its three day moving average and below the critical 80 level. So unless some very good news can give the market a boost, expect prices to fall. In simulations I have run with my older "autoregressive model" there is pretty much limitless downside with no support if a major downmove gets underway. This doesn't mean it will but technical indications from E-Wave to the McClellan Oscillator are weak and mean that the probability of a downmove is much higher than that of a continued rally.
Wednesday, September 27, 2006
Wednesday is the Critical Day for the Stockmarket
On Tuesday the S&P 500 made a strong advance and went beyond the upper trend line of a bearish wedge that bears have been following and hoping for since mid-July. This move is still legitimate in Elliott Wave Theory and is called a throwover. Any further rise though would call the pattern into question or negate it entirely.
As usual recently I have been rather confused about market direction as the NDX has chopped up and down in recent days. My models though also put Wednesday as a critical day - either up or down from here.
Here is a very interesting discussion of whether we have already seen the lows for the four year cycle.
Monday, September 25, 2006
Second Thoughts on Retirement Accounts?
As I begin to realize that maybe I can realize my dream of financial independence much faster than I ever thought possible, I am beginning to rethink the role of retirement accounts in my financial plans. Up till recently I have always contributed the minimum to retirement plans with my employers. The other side of the coin is that my main employers have had extreme levels of retirement contributions. In my first academic job in the UK contributing to the retirement plan was voluntary. It was defined benefit and I was only planning on staying a year or two. I thought reducing my debt was more important. The cost-benefit analysis I did at the time showed that the right choice was to opt out. In my next job (in the US) I didn't stay long enough to become eligible for the retirement plan. Then when I moved to Australia, participation was mandatory. Between employer and compulsory employee contributions, 24% of my nominal salary was going into my retirement account. I thought this was enough especially as it is almost impossible to get the money out in the Australian system before age 60. Then after a gap where I claimed to be "self-employed" :) I was back in the US and here we have to contribute a minimum of 1% and the employer 8%. My goal was to rebuild my savings from the 2002 drawdown and then head for the goal of financial independence. Then this year I opened a Roth IRA account when I learned that you can always withdraw the contributions without penalty and use up to $10,000 in earnings towards the first time purchase of a house. My plan was to save towards a potential downpayment using a Roth IRA. This summer, as I began to understand the tremendous profit potential of my trading model I began to rethink my Roth plan. I think I will hardly miss the $4000 annual contributions and the earnings on them. Therefore, I now plan to continue contributing as long as I can and not withdraw my contributions as soon as I hit $10,000 in profit (I am halfway there at the moment).
Now a new idea has struck me. If I maximized my 403(b) contributions to the $15,000 annual limit I could rollover my account into my Roth when I eventually leave my current employer (subject to paying the appropriate taxes). This would be a way of getting much more money into the tax-free Roth environment. I think I may do this as soon as my trading program has reached its full size and if I continue to be profitable money will then be flowing out of the trading program into long term investments (in order to minimize the potential of a catastrophic loss there is a maximum sensible leverage that should be used in a trading program relative to total net worth - in the long term probably 70% of net worth will be directed to long-term investment and 30% to margin for trading). At that stage I will no longer need my salary to expand the size of the trading program and can direct it to a more tax advantaged environment.
The bottom line is that if you are following a Kiyosakian path at first you want to maximize the assets you have to achieve immediate financial independence. But once that goal is achieved, it makes sense to take full advantage of tax sheltered retirement accounts.
Thursday, September 21, 2006
Mayne Pharma to be Acquired
Mayne Pharma is to be acquired by Hospira. It has been in a trading halt for a couple of days pending a transaction. Yesterday most commentators were still thinking that Mayne would announce an acquisition. But in the last day all the speculation has been about a takeover of Mayne. The takeover price is $A4.10 which results in a $A1972 capital gain for me from a roughly breakeven position at the time of the trading halt. I am still carrying a loss of $A1055 on Symbion the other half of the Mayne Nickless company that demerged last year. It's been a long story since I first invested in Mayne Nickless :) The only question now is whether I should sell or hang on for a possibly higher price. I tend to get impatient during these merger arbitrage situations. This is nice news as the news on the U.S. trading front was not good today for me. The model is still however short but the picture is now a bit unclear.
PS 9:19pm After reading all the info about the proposed takeover I decided that a higher bid was unlikely. The stock opened an hour late at $4.21. I sold at $4.25.
PS 9:19pm After reading all the info about the proposed takeover I decided that a higher bid was unlikely. The stock opened an hour late at $4.21. I sold at $4.25.
Wednesday, September 20, 2006
Update from Croesus Administrators
Croesus Mining's administrators have provided an update on the state of negotiations to either sell Croesus' assets or recapitalize the company. In the latter case, the suspension of trading in Croesus' shares may be lifted. I guess that there is a 50/50 chance that my shares could be worth say 2 Aussie cents each (vs. 27.5 when the trading halt was called) or zero if the assets are sold. The latter would probably mean that there was only sufficient capital to partly pay the creditors (Mitsui Bank and Macquarie Bank are the main ones). Macquarie Bank has been really great through this whole process. Mitsui are the villains. I couldn't link the announcement but it gives a schedule for their meetings with interested parties and for due diligence to be carried out.
PS: 22 September - received a letter today from a fellow shareholder and her lawyers... the lawsuits over the Croesus debacle are beginning to fly. They want $A550 to represent each shareholder without even explaining what their strategy is apart from stating that we should have the same rights as creditors.
PS: 22 September - received a letter today from a fellow shareholder and her lawyers... the lawsuits over the Croesus debacle are beginning to fly. They want $A550 to represent each shareholder without even explaining what their strategy is apart from stating that we should have the same rights as creditors.
Trading Record for the Year So Far
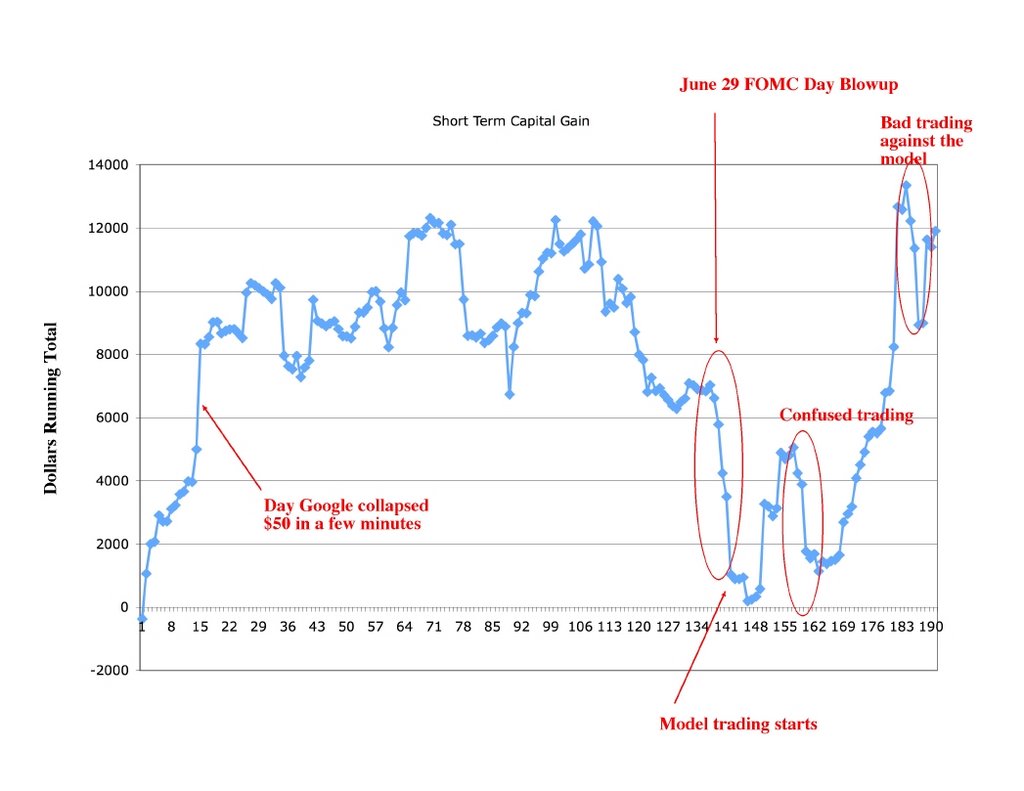
It ain't pretty:

The chart shows the running total of profits from short term trades so far this year. As you can see I got a nice profit early in the year and then blew it all up. Particularly on 29 June. Then I started trading with "the model". I have slightly exceeded the previous maximum level of profits but went through two periods of bad and confused trading against the model. All of this is documented in this blog as it happened. I will need to see a decisive break to a new highwater mark for the year before I will really get convinced that trading this model is practically profitable in the real world. Both pre- and post-model there are some long streaks of mostly winning trades. These tend to engender overconfidence and consequent blowups. Psychology is the hardest part of trading for me.
This might look like irresponsible and reckless risktaking. But losing $4000 in a period of bad trading is a loss of only 1.25% of net worth. This is nothing compared to the reckless risktaking at Amaranth Advisors :). More on Amaranth Advisors.
Tuesday, September 19, 2006
What's Next for the Market?
This scenario has now played out. The model is switching to short at the close today. The S&P 500 index has now had 3 weeks of sell signals on my old model. Now maybe it is finally time for this much delayed longer term scenario to play out. Near today's highs I bought 20 put contracts in my Roth IRA account. So now I am effectively short 5000 QQQQ shares worth just over $200k. The short-term trend is going to be down from here. The stochastic will have to fall tomorrow unless there is a significant rise in prices. The McClellan Oscillator looks set up for a fall too. This isn't all the evidence to show that the "stars are aligned". So maybe now I will be surprised? :)
Sunday, September 17, 2006
Business and Tax Planning
I am reading the two books on taxes for traders that I ordered. Green's book is not as well written, but his strategies are simpler and less aggressive. Tesser takes things to the next level. There may be some contradictions between their advice but I have only read part of each book so far. I am learning a lot. I am understanding more about what Kiyosaki was hinting about regarding business tax deductions. Deductions taken on a Schedule C for example have no effect on triggering the AMT. Traders have many special tax advantages. So if you think you could qualify as being in the business of trading rather than investing it is well worth reading these books. You don't have to set up a company to get business deductions but it allows you to take some other deductions - particularly deducting health insurance from income and making contributions to retirement plans (and social security). If you have another job or your partner has a job with health insurance this will be less important for traders and investors.
Tesser discusses a program I had never heard of: VEBA - a voluntary employee benefit association. Tesser claims that this program can be used as a retirement program. All the information I can find online though says that it is only for medical expenditures. I think his advice is relying on shutting down the program at some point and distributing the proceeds to the employees. The money in the program is tax deductible and tax deferred. The advantage is that none of the limitations that apply to regular retirement programs regarding contribution limits and age restrictions apply to VEBA. Seems that this is a rather aggressive strategy though he claims that none of the strategies in the book get anywhere near the legal limits.
The IRS has never stated what exactly allows one to qualify as a trader rather than investor but instead lays out some vague criteria in Publication 550. If trading isn't your major income source it seems unlikely you will qualify and instead you will trigger an IRS audit. Trading futures seems to make it easier to claim trader status than trading stocks as futures are prima facie trading instruments. Otherwise you will need to show that you do extensive, frequent, and continuous trading. That can be hard to prove if you have a full time job.
The good news is that I can take things step by step:
1. Planning stage - current: proving profitability of trading strategy - learning about tax law etc.
2. Switching to trading futures - which are taxed at lower rates than stocks.
3. Claiming trader tax status - only possible when income is sufficiently high or I quit my current job.
4. Setting up a management company
5. More advanced strategies for estate planning etc - Tesser recommends partnerships.
Saturday, September 16, 2006
That Was a Bad Call
Why do I keep trying to trade against the model? It doesn't make sense. I don't understand why I am doing it. But for some reason it is very hard to stick with what the model says to do. Currently, it is long through Monday's close at least.
Friday, September 15, 2006
Back to the Short Side
Yup. The model is still long but probably Friday will turn out to be the last day of the uptrend in the stochastic. The stochastic can still rise as long as the index remains above 1582 (assuming a high higher than Thursday's 1629 or a low below 1558 do not occur). Friday is also options expiration day. After a strong rally one might expect a sell off on options expiration day as the "max-pain effect" comes into play. Many buyers of call options will have in the money positions. If they sell them to take the profits rather than exercising them the option sellers will then sell the stock they used to hedge their short options positions (delta hedging). This puts a downward pressure on stock prices. Well, just a theory. Futures also expire this time so a lot of stuff is happening - what is called a "quadruple witching". The Elliott Wave formation that began at Monday's low looks complete too. Also my weekly model's forecast for next week would make more sense if prices back off a bit on Friday. So that's my reasoning.
Wednesday, September 13, 2006
Can an Economist be a Trader?
Fin_Indie asked for me discuss how I reconcile being an economics professor and an active trader. I assume he is thinking about the efficient markets hypothesis (EMH) that states that all known information is incorporated in stock prices and prices only move when new information is revealed. This is also often taken to imply that stock prices move according to a pure random walk and changes in prices are unpredictable. Some take this idea further arguing that investors should simply invest in a diversified buy and hold portfolio as there is no way to profit from trading or even deviating from a market weighting of securities.
There are two parts to my response. One is to explain what I think EMH really implies and second to question whether the strong version of EMH holds. As a good economist I don't believe in too many free lunches. Financial markets are highly competitive markets and there should not be easy ways to make above average risk-adjusted returns (taking on more risk is a simple way to get above average returns). Otherwise, participants should simply get a standard return for their provision of investment capital to the market. That is, if that is all they provide. I argue that other inputs provided by investors should also receive returns in this market. These include returns on skill, returns on effort (time spent investing), and returns on special information. Of course if you don't have any of these then don't try to beat the market... It defies imagination that say Warren Buffett's track record is the result of pure chance. Rather, his excess returns reflect returns to these additional inputs. If you think you have these additional inputs you might have an edge, which you can test statistically and then it will allow you to beat the market.
Of course it helps that I am not a professor in the field of finance. I don't even have a PhD in economics (but another field instead). I do have a BA in economics (and the other field) and some graduate classes. I have been published in economics journals, I am a professor in an economics department, and I obviously teach economics. But my background is interdisciplinary and I think makes me much more open to alternative ideas than I might be if I had been indoctrinated in mainstream finance theory in grad school. Most of my research has been empirical and uses time series analysis.
The second part is to argue that while EMH is a good benchmark the strong form of the hypothesis does not hold. Countless anomalies have been documented. The most obvious is that stock prices fluctuate far more than do earnings or interest rates, which are their supposed determinants. A major issue that prevents the market from being perfectly competitive is as I have blogged before most participants in the market do not short-sell and many have mandates to remain fully invested in equities whatever happens. Active traders and hedge funds remain a minority of the participants, despite being very active. Even in among the active traders few are directional traders. Most are arbitrageurs, market-makers etc. Therefore, some forms of technical analysis do work. This is not a "belief" of mine but something I have now tested in the statistically validated trading model I am using. A lot of technical analysis out there makes no sense and a lot of the publicly available TA won't produce excess returns. This is not surprising. But a little digging will produce some useful approaches. Still, most participants have been persuaded that TA is nonsense. That is their problem not mine.
Fin_Indie also asked about my philosophy and inspiration. My basic approach is to trade my account like a global macro hedge fund, with a fairly conservative approach to adjusting the market exposure of my investment portfolio and an aggressive TA approach to trading the trading account. My biggest inspiration on how to trade and invest has been George Soros. But I have drawn elements of what I now do from all over and testing what works and what doesn't. Robert Kiyosaki's books were a big inspiration too.
Aligned with the Trend
The model has now been long for a day and I am again aligned with the model and up on the month a little. This feels better. The uptrend should run through Friday or Monday based on the current forecast. Spent the weekend in Vermont. Sunday went apple picking and other activities. Beautiful weather. Very relaxing.
Friday, September 08, 2006
Planning
A beautiful day here today - trying to appreciate it a little in between the things I have to do. The market has been making me nervous too as I've been confused lately about its direction. It's looking better this afternoon and I don't think I have to bail out (I'm long, though the model is short - go figure). So I can relax a little. The beginning of the Fall Semester is when we start planning for the Spring Semester. I requested to teach classes in the middle of the day most days of the week so I'm free from teaching at market closes and opens. As you can see I am getting addicted to trading :) Most profs try to concentrate all their classes into two days a week. But I have found that pretty tiring. Teaching is like acting or performing in some way. This way I spread my various activities across the week rather than concentrated. Not sure whether I've blogged about my longer term career plans? The downside of academia is immobility and I want to get out of that trap. I also am much less interested in the research part of the job than I was. In fact I enjoy more the management/adminstration aspects now! As long as something useful is getting done by doing them. I am trying to develop trading as a mobile do anywhere source of income that will give me much more flexibility. It won't neccessarily be my main activity. But I would be free to go where I like and do what I want. I am not planning on working in one job or career until I am 65 and then retiring. Why do the same thing your entire life? You only get one life to try out different things. But if I want to stay in the US I first need to get my green card and I am waiting and still waiting. The main driver is on the personal side. My girlfriend is also a potential immigrant and will be limited to visa-compatible jobs employment-wise. Total lottery where those potential jobs may be. The probability that they are close to where my current job is is infinitesimally small. Actually she was just talking about jobs in Sweden again... I won't rule it out, though am not really looking forward to another international move. Probably anyway it would be a 1-2 year position. OTOH I can travel to and live in Sweden with no problems as I have European citizenship.
On another planning front we are finally moving my mother's account from Citibank to two other financial management firms. I had high hopes from Citibank when we opened the account 4 years back and initially we got a decent guy assigned as our "relationship manager". But since then service has gone downhill. Don't think that if you have $1-2 million you will get any better service than a small investor. Many discount brokerage firms would put Citibank to shame. I was reading recently about why wealthy clients dumped managers. The number one reason was poor customer service, not poor investment performance. We just wanted no-hassle peace of mind and as long as we are making a little money we aren't concerned neccessarily about pursuing the highest returns. The last thing I wanted is for my mother to worry about what was happening with her money. One of the new providers is UBS. We will see if they live up to their image of better customer service. The other is a small local firm where she lives. Over time, we will probably place more money with the smaller firm if they are nice to us :) But we can't transfer some of our funds to their custody and don't want to sell them and therefore also need the big bank.
On another planning front we are finally moving my mother's account from Citibank to two other financial management firms. I had high hopes from Citibank when we opened the account 4 years back and initially we got a decent guy assigned as our "relationship manager". But since then service has gone downhill. Don't think that if you have $1-2 million you will get any better service than a small investor. Many discount brokerage firms would put Citibank to shame. I was reading recently about why wealthy clients dumped managers. The number one reason was poor customer service, not poor investment performance. We just wanted no-hassle peace of mind and as long as we are making a little money we aren't concerned neccessarily about pursuing the highest returns. The last thing I wanted is for my mother to worry about what was happening with her money. One of the new providers is UBS. We will see if they live up to their image of better customer service. The other is a small local firm where she lives. Over time, we will probably place more money with the smaller firm if they are nice to us :) But we can't transfer some of our funds to their custody and don't want to sell them and therefore also need the big bank.
Thursday, September 07, 2006
Confused
Yes, I am feeling very confused by the market today, even though so far I guess it is playing out the chart I posted in my last post. Just it went up one more day and then went down and so I ended up losing... Longer term NDX still looks like it is going up, though I still have that sell signal on the weekly SPX I posted about. Probably I should have just gotten out of the market if I was unclear about what was going to happen. Still learning!
Monday, September 04, 2006
New Weekly Model Says: "Get Long"
For the first time today I estimated a model with weekly data. Again, I was stunned by the results - the high correlation between the forecasts and the actual change in the stochastic oscillator in the following week. The R-Squared (a measure of the goodness of fit of the model) between the one step ahead forecasts and the actual data is above 0.9 (very high). This is the sort of number that got my girlfriend to say "whoa!" when I told her about it :) Anyway, to cut to the chase the model predicts the stochastic will increase next week. Therefore, one should be long. I intend to use this model when the daily model is ambiguous as seemed to be at the moment. Well actually my model has clearly been long the last two days but I was stubborn and thinking that the potential turning point on Tuesday after Labor Day would actually lead to a turn to the downside. A day or two down is possible before the market continues to the upside.
Of course all this goes against the fundamentals as I see them. But so be it. The bond market is forecasting recession, but the stockmarket is beginning to change its mind.
Here is a chart that points out the analogous point last November and a guess of the likely price action going forward:

Of course all this goes against the fundamentals as I see them. But so be it. The bond market is forecasting recession, but the stockmarket is beginning to change its mind.
Here is a chart that points out the analogous point last November and a guess of the likely price action going forward:

Sunday, September 03, 2006
Books on Tax for Traders
Just ordered a couple of books about tax for traders. The Tax Guide for Traders by Robert Green and The New Traders Tax Solution by Ted Tesser. This is definitely a topic I need to understand much better before taking my trading business to the next level. I know about several of the issues but am unclear how the following interact: 60/40 treatment of futures, mark-to-market accounting, trader tax status, self-employment tax. Well I know that mark-to-market accounting results in you not being allowed to use 60/40 treatment of futures. But I was reading that you still can claim trader tax status, and somewhere I read you can still avoid the self-employment tax. Need to get this all straight and also understand whether I should set up a business entity such as an LLC or S-Corporation.
August Report
August was another good month. Net worth increased by $14,000 to $330k, investment return was 3.61%, and total investment income $11380. Expenditure was $2062. I have now increased net worth by $60k year to date. So there is still $40k to go or $10000 per month to reach my goal of increasing net worth by $100k for the year. If I keep up the pace of the last two months I will be able to achieve it. The best investment performers in terms of dollars earned were: QQQQ $4712, Colonial First State Conservative Fund $A2731, and Challenger Infrastructure Fund $A1587. As something like one third of my net worth is in the QQQQ position and more than half in the CFS Conservative Fund those rankings aren't too surprising :).
My return on equity on my trading account was a little more than 15% - slightly more than in July. The goal is therefore to earn trading income of $5400 in September (15% more). My eventual goal is to earn at least as much from trading as from my salary ($6250 per month). So I am not too far from that as things are going now.
My return on equity on my trading account was a little more than 15% - slightly more than in July. The goal is therefore to earn trading income of $5400 in September (15% more). My eventual goal is to earn at least as much from trading as from my salary ($6250 per month). So I am not too far from that as things are going now.
Friday, September 01, 2006
Trading Model Performance for August
Another month has gone by trading "the model". I have further improved my trading rules and produced a decent performance for both the model and my account in August. The results in percent terms look like this:
NASDAQ 100 Index: 4.66%
Model(Improved Version): 8.36%
Trading Account: 15.26%
This means I captured 182% of the model's performance using about 3 times leverage. Before the improvements were added the model would have only been up about 5% and my performance captured 300% of that lower rate of return. As a result I earned $4700 for the month from trading vs. $3900 in July when the account gained 14.57% on the back of a model performance of 9.57% and a decline in NDX of 4.80%. This chart compares the model performance and the market action to date:

Clearly if you were short in early July and long in mid-August you would capture most of the model's gains.
It is going to take about 3 months from now, therefore, to achieve my goal of regaining all past trading losses on this account. In the meantime I am also saving up cash in my HSBC Online Savings account to open a futures trading account which will be the next adventure. But first I want to prove I consistently trade QQQQ profitably using the model over several months.
NASDAQ 100 Index: 4.66%
Model(Improved Version): 8.36%
Trading Account: 15.26%
This means I captured 182% of the model's performance using about 3 times leverage. Before the improvements were added the model would have only been up about 5% and my performance captured 300% of that lower rate of return. As a result I earned $4700 for the month from trading vs. $3900 in July when the account gained 14.57% on the back of a model performance of 9.57% and a decline in NDX of 4.80%. This chart compares the model performance and the market action to date:
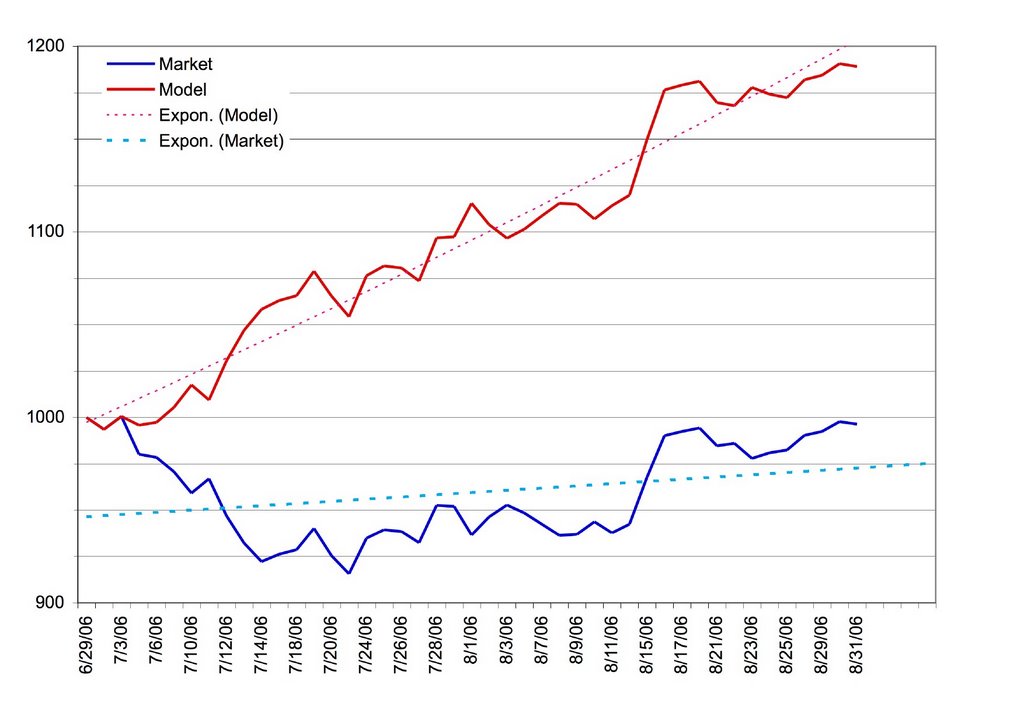
Clearly if you were short in early July and long in mid-August you would capture most of the model's gains.
It is going to take about 3 months from now, therefore, to achieve my goal of regaining all past trading losses on this account. In the meantime I am also saving up cash in my HSBC Online Savings account to open a futures trading account which will be the next adventure. But first I want to prove I consistently trade QQQQ profitably using the model over several months.
At Midday the Rally is Looking Dead
This rally is looking pretty dead here.
Based on the prices earlier this morning my model would have switched to long, and I got close to pulling the plug/switch or whatever metaphor, but now in fact the spike up has extended the recent range and makes the model more likely to remain short at today's close.
Also I mentioned that my indicators were very similar to last November. Another difference is back then the full(5,5,3) stoch went above 80 on a 20 point up day. And the follow through day was another 20 points up and a runaway rally ensued. Here the breakthrough was a 3 point day and the follow through day was something like 9 points.
Of course things might look entirely different by 4pm. Tomorrow morning there is a bunch of very important economic news. This morning's economic news pretty much met expectations and so hasn't moved the market much either way.
Thursday, August 31, 2006
Market Teetering Between a Crash and a Rally
My indicators derived from the stochastic were in exactly the same pattern as they are now twice in 2005. Once in mid to late February and once in early November.
In the first case there was an upturn in the stochs from a high level and a small spike in the stochastics and a small but essentially failed rally. That is what I am betting on here. But in early November the upturn turned into a massive overbought rally.
So distinguishing between the two situations is of utmost importance :)
I'm still short but the market has been rising. In reaction I have dug up a tool I developed to help forecast the most bullish of my indicators. I had been skeptical that this tool was useful. But maybe it is useful in just such a situation. It says to be long at the moment. An alternative is if, for example, your standard position is 3000 shares, to allocate 1000 shares to each of the three indicators. So on a day like today where two indicators are short and one is long you would be theoretically short 2000 shares and long 1000 shares and, therefore, in practice short 1000 shares. I have read people discussing allocating their trading capital across multiple models and indicators. It could make sense. It is an agnostic approach to market direction.
I also found a distinction between February and November 2005. In November the fast %K stochastic was very strong - over 90 on the day that is the best analog for today. In February it was declining and around 80. If today ends up not too much it is going to look more like February and the case for the failed rally hypothesis will be strengthened.
Tuesday, August 29, 2006
Confusing Market Action
Bulls and bears both seem confused at this point. One bear calls for a week of sideways action. This morning the Federal Reserve did a massive permanent open market operation - i.e. buying bonds and putting new money into the money supply. Someone on Silicon Investor who follows the Fed closely said it was the biggest he's seen. Changes in money supply in both Japan and the US often have a strong relation with stock market action. So in retrospect it wasn't surprising then that the market went up. I'm still puzzled about what is the causal driver in these money supply changes - is it market players or the monetary authority? Most commentators seem to assume that it is the Central Bank that drive these actions. However, standard macro theory says it would be investors and traders driving the Central Bank to respond.
In other news my "other model" - what I call the "autoregressive model" (as opposed to the "stochastic model" - both nicely obscure names :)) - the best I had before the latest one - has given a sell signal on the S&P 500 on the weekly chart. The previous signal was a buy for the week of 19 June. Previous to that was a sell in the week of 1 May. So the model is behaving pretty nicely in recent months and I wouldn't ignore it. Previous to that there was a sell for the week of 20 March... but before that a buy for three weeks in April 2005. On the other hand one of the indicators from the "stochastic model" is indicating a buy, but others aren't. So maybe we do just keep going sideways all week.
In other news my "other model" - what I call the "autoregressive model" (as opposed to the "stochastic model" - both nicely obscure names :)) - the best I had before the latest one - has given a sell signal on the S&P 500 on the weekly chart. The previous signal was a buy for the week of 19 June. Previous to that was a sell in the week of 1 May. So the model is behaving pretty nicely in recent months and I wouldn't ignore it. Previous to that there was a sell for the week of 20 March... but before that a buy for three weeks in April 2005. On the other hand one of the indicators from the "stochastic model" is indicating a buy, but others aren't. So maybe we do just keep going sideways all week.
Sunday, August 27, 2006
Bursting Real Estate Bubble and Coming Recession
Seems this weekend there is stuff everywhere on the bursting housing bubble. Too much to post! One of the best is this powerpoint slide show from the National Association of Realtors chief economist. They are still trying to put a bullish spin on things of course. But it is hard to do that anymore. Also more evidence of coming recession. This week the yield curve inverted more. And apart from the state of the housing market there is evidence such as this chart of retail employment.
Saturday, August 26, 2006
Adjusting Investments
It might seem like all I've been doing lately is trading. But I also have been adjusting my long-term investment positions. I am cutting back on a couple and increasing some others in an attempt to make the sizes of the different positions more consistent with the goal of having about 1.5% of net worth in each individual stock, not counting closed end funds which have shown their ability to withstand market corrections. I sold entirely out of IYS. This was originally a "corporate event arbitrage" trade -the fund was going to be wound up and was trading much below the final payout level. But recently we got a letter from Deutsche Bank saying that in order for the bank to pay us we had to agree to a settlement with the Australian Taxation Office. This introduced a risk of complications for foreign investors like me - I am an Australian Citizen but I am resident in the US. So I decided to get out now with a decent profit. I am planning in the coming week to reduce my positions in Telecom NZ and Challenger Infrastructure Fund. I've been waiting for Telecom's dividend book closing which happened on Friday. I just have too much of that stock. The latter looks like it is performing well but reading the annual report, there is a lot I don't understand about its accounting. So following Warren Buffett's maxim I am reducing my position. I have also put a bid in to buy more of Everest Capital after the destapling of this hedge fund management firm from its fund of funds which I am also invested in. Oh, and I also reduced my position in Ansell. There is probably something else I have left out. So actually I have been pretty busy.
PS: Wikipedia has a nice graphic of real UK house prices. The growth rate over the period is 2.4%. I suspect that rate will be lower when a few more years of data accumulate. And leverage doesn't make this look much better if you are paying 1-2% real interest on your loan.
PS: Wikipedia has a nice graphic of real UK house prices. The growth rate over the period is 2.4%. I suspect that rate will be lower when a few more years of data accumulate. And leverage doesn't make this look much better if you are paying 1-2% real interest on your loan.
Thursday, August 24, 2006
Model Update - Progress Towards Goals
At this point it is looking like there will be a buy to cover signal generated at next Tuesday's close. This is about as accurate as weather forecasting so as that date approaches the forecast might be brought forward or pushed out further in time. I continue to be shocked and stunned by the performance of the model and the ease of trading with it. I am getting used to trading the model. In July I got about 1.5 times the model return on my main trading account using roughly 3 times leverage. So far this month I am getting more than 3 times the model return. And, therefore, that performance goal has been realized. The model is on track to match last month's results. It is now up about 18% since 29 June. My taxable trading account is up 40%... The Roth IRA account is up 70% since I opened it earlier this year. I am now more than half way towards my initial goal of making $10,000 in profits in the Roth IRA. I thought that goal might take a few years to achieve. At this rate it could be achieved by the end of this year. I am pretty much also back on track towards this year's goal of increasing total net worth by $100,000. I think multiple near term goals are good - performance targets, profit targets, net worth targets etc. You can always be approaching some goal. Better than a single goal of some huge number you have to reach by "retirement".
P.S. Maybe I should just have bought real estate instead as common wisdom suggests :P The data in the article suggest that the real rate of capital gain on the typical house is 1% per annum. This article assumes 2% and still thinks housing is an inferior investment strategy.
P.S. Maybe I should just have bought real estate instead as common wisdom suggests :P The data in the article suggest that the real rate of capital gain on the typical house is 1% per annum. This article assumes 2% and still thinks housing is an inferior investment strategy.
Wednesday, August 23, 2006
Traits that Lead to Success
How many of these traits and habits do you have? I think I have several, though I'm not a very good networker. That's my weakest point.
DIY Recession Probability Calculator
Cool tool for estimating the probability of a recession. The tool is based on an academic paper by a Federal Reserve economist.
Tuesday, August 22, 2006
Expert Systems vs. Expert Opinion
John Mauldin's latest mid-week newsletter is an interesting exploration of the performance of formal quantitative systems that systematize expert knowledge vs. informal expert judgement. Generally, the formal systems perform better. People also tend to be overconfident of their abilities to make better decisions than the formal systems do. Of course this will depend on how good the quantitative model is. Anyone can make a bad model.
Subscribe to:
Posts (Atom)