Friday, February 24, 2023

New Investment or Trade

I sold some Pengana Private Equity (PE1.AX) shares as they are trading above NTA and bought some Cordish Dixon Private Equity Fund III (CD3.AX) shares, which are trading more than 30% below NTA. Of the three traded Cordish-Dixon funds, I selected this one as it is youngest and so I figured has the most potential. Maybe the oldest fund maybe has only more problematic companies left in it, which are harder to sell? It is also the biggest of the three funds because it has made fewer distributions to date.

This was spurred by news that PE1 has made offers to acquire the CD funds, though these have been rejected to date.

In other updates, I have been tied up in other projects and haven't had time to reconcile the accounts for the last couple of months. When I do, I will post reports.

Friday, February 03, 2023

Rates of Return Over 20 Years


The graph shows the average annual rate of return over the previous 20 years up to that date. Our target diversified portfolio has had a very consistent 20 year return, as has the ASX 200. The MSCI World stock market index and the S&P 500 have been less consistent. My own performance was not good up to 2020 when seen from a 20 year perspective. By January this year, though, it's almost matching the target portfolio and is near the MSCI World Index (which doesn't deduct management fees). One reason for this, is I did really badly in 2000-2003 in the dot.com crash or tech wreck and so performance is now measured from the low point of March 2023. The chart is measured in Australian Dollars.

Saturday, January 14, 2023

Annual Report 2022

Overview 
This was the first year that our net worth fell since 2008. Investment returns were negative but the value of our house increased a bit and we did save some money.* We were far short of the best case projection I made at the beginning of the year of a net worth of AUD 6.7 million. In my academic career, I spent a lot of time this year working on preparing and then teaching a new course, though I did get at least one newish research project completed. I was supposedly on long service leave for the first three months of the year but didn't really get to take any time off. This year, I plan on taking it a bit easier in the first half of the year before focusing on teaching in the second half of the year. Teaching was more in person this year and so a bit more enjoyable. I didn't leave the Canberra region all year since getting back from the coast right after New Year's Day.
 
All $ signs in this report indicate Australian Dollars. I'll do a separate report on individual investments. I do a report breaking down of spending after the end of the financial year.
 
Investment Returns 
In Australian Dollar terms we lost 3.7% for the year but in USD terms we lost 9.6% because of the fall in the Australian Dollar over the year. The MSCI lost 18.0% in USD terms but the ASX 200 gained 0.9% in AUD terms. The HFRI hedge fund index lost 1.5% in USD terms. Our target portfolio lost 4.2% in AUD terms. So, we beat the MSCI and the target portfolio benchmarks this year but not the ASX 200 or HFRI Index. 
 
This chart compares our portfolio to the benchmarks in Australian Dollar terms over the year:
 

We tracked the target portfolio quite closely. It acted as a less volatile weighted average of Australian and international equity markets. Here are the same indices in US Dollar terms with the target portfolio replaced by the HFRI hedge fund index:
 
The HFRI had very low volatility and the strongest relative performance. In USD terms, our portfolio was much more volatile than in Ausrtalian Dollar terms as intended.
 
Here are annualized returns over various standard periods:

Benchmark returns have now mostly decreased over time. We have similar performance to the ASX 200 over ten years but much worse over twenty. We beat the HFRI over all the longer time horizons. We had particularly good relative performance over the three year horizon. Whether you think our performance is good or bad depends on what you think the default alternative investment is. If it is an ASX 200 index fund, then we are doing in the last ten years. If it is a global stock index fund then not so good over horizons longer than three years. If you think it is our target portfolio then we are doing well.

Here are the investment returns and contributions of each asset class in 2022:
The contributions to return from each asset class sum to the total portfolio return in gross asset and currency neutral terms. I then add on the contributions of leverage and the Australian Dollar to get the AUD net worth return. The portfolio shares are at the beginning of the year. Futures and gold did best and contributed most to the return. Private equity and real assets had small positive returns. Australian small cap stocks and foreign equities all did very badly.

Investment Allocation 
There weren't large changes in asset allocation over the year:
 

Mainly, real assets fluctuated with our exposure to URF.AX, which is a very levered (effectively) US residential real estate fund.

Accounts
Here are our annual accounts in Australian Dollars: 
 

Percentage changes are for the total numbers. There are lots of quirks in the way I compute the accounts, which have gradually evolved over time. There is an explanation at the end of this post. 

We earned $153k after tax in salary etc. Total non-investment earnings including retirement contributions were $183k, down 9% on 2021. This was due to increased tax payments, fewer non-salary earnings, and fewer employee contributions to Moominmama's employer superannuation fund. We lost (pre-tax including unrealized capital gains) $166k on non-retirement account investments. A small amount of the gains were due to the fall in the Australian Dollar (forex). We lost $15k on retirement accounts with $30k in employer retirement contributions. The value of our house is estimated to have risen by $133k. As a result, the investment loss totaled -$45k and total income $139k.
 
Total spending (doesn't include mortgage payments) of $152k was again up 12% for the year. Spending was almost exactly equal to after-tax non-investment income. We saved just $488 from salaries etc.

$25k of the current pre-tax investment income was tax credits – we don't actually get that money so we need to deduct it to get to the change in net worth. We transferred $120k into retirement accounts the SMSF from existing savings. This included $20k as a concessional contribution for Moominmama. Therefore, looking at just saving from non-investment income, we dissaved $120k. The change in current net worth, was therefore -$306k.

Taxes on superannuation returns are just estimated because apart from tax paid by the SMSF all we get to see are the after tax returns. I estimate this tax to make retirement and non-retirement returns comparable.
The total implicit tax on supernnuation was a negative $1k because we lost money. Net worth of retirement accounts increased by $136k after the transfer from current savings.
 
Finally, total net worth fell by $37k.

Projections
Last year my baseline projection for 2022 was for a 16% rate of return, no increase in the value of our home, flat other income, and 6% growth in spending. This resulted in projected net worth increasing by $800k to around $6.7 million. Obviously, we came nowhere near this projection.
 
This year the baseline projection (best case scenario) is for an 11.2% investment rate of return in AUD terms (assuming the Australian Dollar rises to 75 US cents), inflation of 7.6% and an 11% nominal increase in spending, and about a 3% increase in other income, leading to an $550k increase in net worth to around $6.5 million or a 9% increase. This would be very little gain in real terms after inflation. But, again, anything could happen.
 
Notes to the Accounts
Current account includes everything that is not related to retirement accounts and housing account income and spending. Then the other two are fairly self-explanatory. However, property taxes etc. are included in the current account. Since we notionally converted the mortgage to an investment loan, mortgage interest is counted in current investment costs. So, the only item in the housing account now is increases or decreases in the value of our house. This simplified the accounts a lot but I still keep a lot of cells in the spreadsheet that might again be used in the future.
 
Current other income is reported after tax, while investment income is reported pre-tax. Net tax on investment income then gets subtracted from current income as our annual tax refund or extra payment gets included there. Retirement investment income gets reported pre-tax too while retirement contributions are after tax. For retirement accounts, "tax credits" is the imputed tax on investment earnings which is used to compute pre-tax earnings from the actual received amounts. For non-retirement accounts, "tax credits" are actual franking credits received on Australian dividends and the tax withheld on foreign investment income. Both of these are included in the pre-tax earning but are not actually received month to month as cash.... 
 
For current accounts "core expenditure" takes out business expenses that will be refunded by our employers and some one-off expenditures. This year, there are none of those one-off expenditures. "Saving" is the difference between "other income" net of transfers to other columns and spending in that column, while "change in net worth" also includes the investment income.
 
* Venture capital returns haven't been reported yet for the December 2022 valuation, but I don't expect them to make a big difference.

Sunday, January 08, 2023

December 2022 Report

Venture capital returns won't be reported for another month, but I expect them to be flat, so that the final numbers are not far from what they are now. In December, stock markets fell. The MSCI World Index (USD gross) lost 3.90%, the S&P 500 5.76% in USD terms, and the ASX 200 3.13% in AUD terms. All these are total returns including dividends. The Australian Dollar rose from USD 0.6788 to USD 0.6816. We lost 1.24% in Australian Dollar terms or 0.83% in US Dollar terms. The target portfolio is expected to lose 2.43% in Australian Dollar terms and the HFRI hedge fund index around 1.3% in US Dollar terms. So, we out-performed all benchmarks.

Here is a report on the performance of investments by asset class:

The asset class returns are in currency neutral returns as the rate of return on gross assets. I have added in the contributions of leverage and other costs and the Australian Dollar to the AUD net worth return.

Only gold and private equity had positive returns. Gold was the biggest contributor to returns and hedge funds the greatest detractor.

Things that worked well this month:

  • Gold gained AUD 14k and Pengana Private Equity (PE1.AX), 9k.

What really didn't work: 

  • Regal Funds (RF1.AX) lost AUD 12k followed by Hearts and Minds (HM1.AX) and Tribeca Global Resources (TGF.AX), which each lost 10k.

The investment performance statistics for the last five years are: 

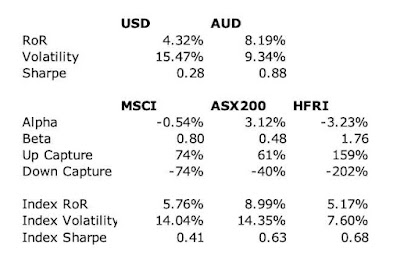
The first three rows are our unadjusted performance numbers in US and Australian dollar terms. The MSCI is reported in USD terms. The following four lines compare performance against each of the three indices over the last 60 months. The final three rows report the performance of the three indices themselves. We show the desired asymmetric capture and positive alpha against the ASX200 and the MSCI but not against the hedge fund index. We have a higher Sharpe Index than the ASX200 but lower than the MSCI in USD terms. We are performing about 2.5% per annum worse than the average hedge fund levered 1.7 times. Hedge funds have been doing well in recently.

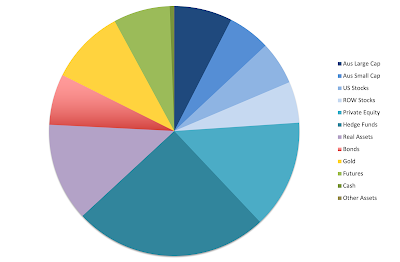
We are now very close to our target allocation. Our actual allocation currently looks like this:

About 70% of our portfolio is in what are often considered to be alternative assets: real estate, art, hedge funds, private equity, gold, and futures. A lot of these are listed investments or investments with daily, monthly, or quarterly liquidity, so our portfolio is not as illiquid as you might think.

We receive employer contributions to superannuation every two weeks. We are now contributing USD 10k each quarter to Unpopular Ventures Rolling Fund and less frequently there will be capital calls from Aura Venture Fund II. In addition, we made the following investment moves this month:

  • I bought 1,000 shares of PMGOLD.AX.
  • I tried to do a trade with around 12k shares of Regal Funds (RF1.AX). It wasn't successful.
  • I closed a tiny position of WLS.AX shares pending the merger of WLS into WCMQ.AX.
  • The remainder of our WLS shares will convert to WCMQ and our URFPA shares will convert to URF at the turn of the year.

Monday, January 02, 2023

How Can They Afford It?

One of Moominmama's friends (from undergrad days in the world's most populous country) told her they have bought a house in one of the most expensive neighborhoods here. They plan to knock it down and build their dream home including a swimming pool. It is in walking distance of their two children's school, the most expensive private school here.  Her reasoning is that it costs AUD 4 million to buy an existing house like they want, and this will be cheaper. Still, a crappy house there costs almost AUD 2 million. They haven't sold their existing town house in our neighborhood yet and they apparently also bought her parents an apartment here. She is an administrator at my workplace on probably AUD 100-110k a year and her husband was an associate professor (AUD 150-158k). He recently moved to Moominmama's employer.


My immediate reaction was: "How can they afford to do that?" I think Moominmama gets a lot of her aspirations from following this family, including sending our children to private school. 


Sunday, January 01, 2023

Subscriptions

Our utilities spending category had been rising strongly over time and so I decided to split out the "subscriptions" component:

The graph is in Australian Dollars per year. Data for 2022-23 is for calendar year 2022 and previous years are 1 July to 30 June to match the Australian tax year. Back in 2017-18, subscriptions were less than AUD 1k and so I included them together with phone and internet access bills in a "phone and internet" subcategory that got then bundled into "utilities". But they underwent a step change in 2020-21. Now I am only including "infrastructure" costs - phone bills, internet access, data storage etc. in the phone and internet subcategory. All the subscriptions and payments for electronic services are now in "subscriptions". I moved web-hosting to the "professional" category.

At least "subscriptions" aren't increasing much since the pandemic step change took place. Utilities have increased 36% since 2017-18, which is less than our overall 58% increase in spending. So, there isn't really a problem there. Childcare and education has increased most, by 483%. It was AUD 55k in the 2022 calendar year compared to only AUD 9k in the 2017-18 financial year. Calendar year 2022 spending was AUD 170k (USD 115k).


Friday, December 23, 2022

Domacom Reinstated to ASX Quotation

On the last trading day before Christmas, Domacom has been reinstated to quotation. I wonder where the price will end up?

7:27pm

It went up! Closing at 7 cents a share. It was last quoted at 6.5 cents before being suspended. There were more shares on the buy side than the sell side most of the day.

Saturday, December 03, 2022

November 2022 Report

In November, stock markets continued their rebound and the Australian Dollar rose strongly increasing US Dollar returns relative to Australian Dollar returns. The MSCI World Index (USD gross) rose 7.80%, the S&P 500 5.59% in USD terms, and the ASX 200 6.78% in AUD terms. All these are total returns including dividends. The Australian Dollar rose from USD 0.6387 to USD 0.6744. We gained 3.05% in Australian Dollar terms or 8.81% in US Dollar terms. The target portfolio is expected to gain 1.23% in Australian Dollar terms and the HFRI hedge fund index around 1.0% in US Dollar terms. So, we out-performed all benchmarks apart from the ASX. 

Our SMSF hit a new high in terms of cumulative returns, exceeding the previous high in September 2021. It is now up more than 15% since inception and well ahead of our employer superannuation funds:


These are all in pre-tax terms - franking credits are included but no tax deducted. This will be a bit over-generous to the employer superannuation funds on the way up and the opposite on the way down. The increase in my US retirement account (TIAA) is to a large extent because of the fall in the Australian Dollar. It fell this month as the Australian Dollar rose. But the TIAA Real Estate Fund also performed extremely well over this period until recently.

Here is a report on the performance of investments by asset class: 

The asset class returns are in currency neutral returns as the rate of return on gross assets. I have added in the contributions of leverage and other costs and the Australian Dollar to the AUD net worth return.

Only futures had a negative return. RoW stocks were the best performer partly because of the rebound in the China Fund and hedge funds were the largest contributors to the month's return.

Things that worked well this month:

  • Tribeca Global Resources was again the top performer in terms of dollars gained (TGF.AX, AUD 25k). Coming in second and third were the China Fund (CHN, 18k) and Australian Dollar Futures (17k). Also gaining more than AUD 10k were 3i (III.L, 17k), Unisuper (16k), PSS(AP) (12k) Pershing Square Holdings (PSH.L, 12k), and gold (10k). With the exception of the China Fund and AUD futures, this is very similar to last month.

What really didn't work:

  • Winton Global Alpha Fund (-12k), Aspect Diversified Futures (-6k), and WAM Alternatives (WMA.AX, -4k) were the greatest detractors.

The investment performance statistics for the last five years are:

The first three rows are our unadjusted performance numbers in US and Australian dollar terms. The MSCI is reported in USD terms. The following four lines compare performance against each of the three indices over the last 60 months. The final three rows report the performance of the three indices themselves. We show the desired asymmetric capture and positive alpha against the ASX200 and the MSCI but not against the hedge fund index. We have a higher Sharpe Index than the ASX200 but lower than the MSCI in USD terms. We are performing more than 3% per annum worse than the average hedge fund levered 1.79 times. Hedge funds have been doing well in recent years.

We are now very close to our target allocation as Regal Funds diversifies its holdings. Our actual allocation currently looks like this:

About 70% of our portfolio is in what are often considered to be alternative assets: real estate, art, hedge funds, private equity, gold, and futures. A lot of these are listed investments or investments with daily, monthly, or quarterly liquidity, so our portfolio is not as illiquid as you might think.

We receive employer contributions to superannuation every two weeks. We are now contributing USD 10k each quarter to Unpopular Ventures Rolling Fund and less frequently there will be capital calls from Aura Venture Fund II. In addition, we made the following investment moves this month:

  • I sold 5000 shares of WAM Leaders (WLE.AX) and bought 1000 shares of the China Fund (CHN).
  • I sold USD 17.5k of the TIAA Real Estate Fund and bought the Social Choice Fund instead.
  • I bought 4000 shares of Regal Partners (RPL.AX).
  • I sold the 2000 shares I held in Fortescue Metals (FMG.AX). We made about AUD 4k on this trade.
  • I sold 10k shares of Regal Funds (RF1.AX) and bought 500 shares of URFPA.AX - the US Masters Residential Fund converting preference notes.
  • I sold 1,000 shares of Ruffer (RICA.L) to get money for our next subscription payment for Unpopular Ventures.

Thursday, December 01, 2022

Regal Funds Adds Private Credit

After recently adding a resource royalties strategy, Regal Funds (RF1.AX) are now adding a private credit strategy. They also announced a placement and rights issue to help implement the new strategy. The fund started primarily as a listed hedge fund with some private equity. But it is increasingly becoming a diversified alternatives fund. I suppose all these new strategies are supposed to reduce the correlation of the fund to the stockmarket. The fund has had a beta of 1. However, this looks like it will come at the expense of performance. You can't do 20% a year in strategies like private credit. Well, I guess you can lever up...

In any case, performance wasn't good in November, especially relative to the stockmarket which rose strongly. I sold 10,000 shares this week to increase my holding of URFPA. The rights offering is at AUD 3.01 a share (current NAV) with a maximum of AUD 30k per holder. I decided not to bother as I can't buy more than 2,000 shares without selling something else.

Saturday, November 05, 2022

October 2022 Report

In October, stock markets rebounded and the Australian Dollar ended close to flat. The MSCI World Index (USD gross) rose 6.06%, the S&P 500 8.10% in USD terms, and the ASX 200 6.06% in AUD terms. All these are total returns including dividends. The Australian Dollar fell from USD 0.6399 to USD 0.6387. We gained 2.85% in Australian Dollar terms or 2.66% in US Dollar terms. The target portfolio gained 3.07% in Australian Dollar terms and the HFRI hedge fund index is expected to be almost flat at 0.08% in US Dollar terms. So, we under-performed all benchmarks apart from HFRI, though we were not far from the target portfolio.

Here is a report on the performance of investments by asset class: 

The asset class returns are in currency neutral returns as the rate of return on gross assets. I have added in the contributions of leverage and other costs and the Australian Dollar to the AUD net worth return.

Only rest of the world stocks had a negative return, which was because of the poor performance of China. US stocks were the best performer and hedge funds the largest contributors to the month's return.

Things that worked well this month:

  • Tribeca Global Resources (TGF.AX, AUD 18k), Unisuper (15k), Pershing Square Holdings (PSH.L, 12k), and PSS(AP) (10k) were the largest contributors.

What really didn't work:

  • The China Fund (CHN, -9k) and Fortescue (FMG.AX, -4k) were the greatest detractors.

The investment performance statistics for the last five years are: 

The first three rows are our unadjusted performance numbers in US and Australian dollar terms. The following four lines compare performance against each of the three indices over the last 60 months. The final three rows report the performance of the three indices themselves. We show the desired asymmetric capture and positive alpha against the ASX200 but not against the hedge fund index nor the MSCI. We have a higher Sharpe Index than the ASX200. We are performing more than 3% per annum worse than the average hedge fund levered 1.76 times. Hedge funds have been doing well in recent years.

We moved towards our target allocation mainly by reducing exposure to hedge funds and gold. Our actual allocation currently looks like this:

About 70% of our portfolio is in what are often considered to be alternative assets: real estate, art, hedge funds, private equity, gold, and futures. A lot of these are listed investments or investments with daily, monthly, or quarterly liquidity, so our portfolio is not as illiquid as you might think.

We receive employer contributions to superannuation every two weeks. We are now contributing USD 10k each quarter to Unpopular Ventures Rolling Fund and less frequently there will be capital calls from Aura Venture Fund II. In addition, we made the following investment moves this month:

  • We received the payout from the sale of Gargantua.
  • I sold 5k shares of Cadence Capital (CDM.AX) to get some cash.
  • I sold 11k shares of Regal Funds (RF1.AX) that I bought in September.
  • I sold 1000 shares of PMGOLD (PMGOLD.AX) as the Australian Dollar gold price peaked a little. I'm now feeling that we are at a much more comfortable debt level in our margin accounts given the rise in interest rates and volatility.

Wednesday, October 26, 2022

Real Salary


I was wondering whether we were getting worse off over time at my employer and so plotted my real and nominal pre-tax salary for the time I have been in my current position. Halfway along there was a blip where I was department head and got paid more. In real terms I am now about $2000 below where I started in 2011. The union is asking for a 15% increase in the latest bargaining round. After tax that is a about an 11% increase (because of progressive tax rates).

Saturday, October 22, 2022

More Factoids from the 2019-2020 Australian Income and Wealth Survey

3.2% of households are in both the top income and top net worth deciles. That means their net worth is above $2.258 million and their annual income is above $235k.

Friday, October 21, 2022

2019-20 Australian Income and Wealth Distribution


I didn't notice when the Australian Bureau of Statistics released the 2019-20 data on Australian household income and wealth distribution. I previously reported on the 2015-16 and 2017-18 data.

Mean gross household income was $121k per year in 2019-20 (all $ are Australian Dollars). The median was $93k. These are not adjusted for household size. ABS provides data adjusted for household size in terms of the income a single person would need to achieve the economic well-being of the average household. To adjust these to the required income of a household with 2 adults and 2 children requires multiplying by 2.1. I seriously doubt that adding a child only increases costs by 0.3 of the first adult! 

Mean gross household income in the ACT was $150k and the median $124k.

To be in the top 10% of households requires a gross income of at least $235k. To get information on the breakdown inside the top 10% you have to use their data on the number of households within each of different bands of weekly income. 4.7% of households have an annual income above $312k and another 3% between $260k and $312k. Our gross income was $264k (taxable income), so we just fall within this group and, therefore, in the top 7.7%.

Mean household net worth was $1.04 million and the median was $579k. To be in the top 10% you needed a net worth of $2.26 million. We were at $4.44 million at the end of June 2020. To be in the top 3.9% you needed a net worth of $4 million. So I estimate we were at the edge of the top 3.3%. I guess it makes sense given my age that we higher in the wealth distribution than in the income distribution.

1.2% of households had a net worth above $7 million and 0.6% above $10 million.

There is a lot more data on breakdown of assets etc. which I might report on another time.

To be in the US top 1% by net worth required USD 11 million ($17.75 million) in the same period. A top 1% US household income is around USD 600k and above.

Tuesday, October 18, 2022

Regal Investment Fund Implements Resource Royalties Strategy


Regal Investment Fund (RF1.AX) is continuing to diversify their portfolio. Recently, they added a water strategy through Kilter Rural. Now they are adding a resource royalties strategy through the Gresham Resource Royalties Fund. While the water strategy is only 2% of the fund, the resource royalties strategy will be 17% of the fund initially. I am categorizing both of these in the real assets class. From the announcement:

"A resource royalty is a right to receive payment usuallyreflecting the value of a percentage of revenue derived from the production from a mining, oil and gas or renewable project. A commodity stream is an agreement conferring a right to purchase all or a portion of the production produced from a mining, oil and gas or renewable project at a pre-set price. Royalties and commodity streams are often used interchangeably. Royalties and commodity streams are typically acquired for an upfront payment. They can provide investors with the upside potential of increased commodity prices, increased production and extended mineral reserves (and sometimes new discoveries) with no or limited exposure to variable operating costs and future capital calls to fund exploration or other capital costs."

Friday, October 14, 2022

Performance of Average Investors

 Latest version of the famous J.P. Morgan graph:

They estimate the returns for "average investors" from mutual fund flows. My return for this period was 6.12% (USD return). It's good that I am way ahead of the average investor but not good that I am behind a 60/40 portfolio (with no fees).

For a while now, I have been tracking these 20 year returns. Here is a graph with rolling 20 year USD returns for my portfolio and some key indices:

Each datapoint is the return for the 20 years up to that month. I started investing in 1996 and so the first observation is for September 2016. While I used to be worse than the median hedge fund, in the last couple of years my 20 year track record is a little bit better than the hedge fund index. I like to think it is more important to perform well the more money you have to invest :) In other words, dollar-weighted returns are more important than time-weighted returns.


Monday, October 10, 2022

Gargantua by George Condo Sold

Masterworks sold the third painting that I invested in, Gargantua by George Condo. The original offer price to investors was $1.65 million and they sold it for $2.55 million. After performance fees, sales costs etc. the proceeds are probably within 5% of the most recent estimate they provided.

Saturday, October 08, 2022

September 2022 Report

In September the stock markets again fell sharply and the US Dollar rose. The MSCI World Index (USD gross) lost 9.53%, the S&P 500 9.21% in USD terms, and the ASX 200 6.14% in AUD terms. All these are total returns including dividends. The Australian Dollar fell from USD 0.6855 to USD 0.6399 and even fell against the Pound. We lost 1.74% in Australian Dollar terms or 8.28% in US Dollar terms. The target portfolio lost 1.28% in Australian Dollar terms and the HFRI hedge fund index lost 2.27% in US Dollar terms. So, we out-performed the stock market indices but not these alternative benchmarks.

Here is a report on the performance of investments by asset class: 

The asset class returns are in currency neutral returns as the rate of return on gross assets. I have added in the contributions of leverage and other costs and the Australian Dollar to the AUD net worth return.

Only gold had a positive return and that was only because of the fall in the Australian Dollar - we hold our gold mostly in the ASX listed PMGOLD ETF. The Australian Dollar was the biggest  positive contributor to performance measured in Australian Dollars and hedge funds were the biggest detractor, though Rest of World Stocks had the worst rate of return.

Things that worked well this month:

  • After gold (AUD 13k), Regal Funds (RF1.AX) gained 10k, Winton Global Alpha 9k, and Aura VF2 8k.

What really didn't work:

  • Tribeca Global Resources lost AUD 28k, followed by Australian Dollar Futures lost 21k, and Unisuper at-17k.

The investment performance statistics for the last five years are: 

The first three rows are our unadjusted performance numbers in US and Australian dollar terms. The following four lines compare performance against each of the three indices over the last 60 months. The final three rows report the performance of the three indices themselves. We show the desired asymmetric capture and positive alpha against the ASX200 but not against the hedge fund index nor the MSCI. Compared to the ASX200, our rate of return has been almost the same, but our volatility has been almost 5% lower. We are performing almost 4% per annum worse than the average hedge fund levered 1.76 times. Hedge funds have been doing well in recent years.

We moved towards our target allocation. Our actual allocation currently looks like this:


About 70% of our portfolio is in what are often considered to be alternative assets: real estate, art, hedge funds, private equity, gold, and futures. A lot of these are listed investments or investments with daily, monthly, or quarterly liquidity, so our portfolio is not as illiquid as you might think.

We receive employer contributions to superannuation every two weeks. We are now contributing USD 10k each quarter to Unpopular Ventures Rolling Fund and less frequently there will be capital calls from Aura Venture Fund II. In addition we made the following investment moves this month:

  • I sold my holding of 10k Pendal shares (PDL.AX). Perpetual, which is taking over Pendal seems to continue to sink in price since the merger was announced.
  • I participated in the Regal Investment Partners (RPL.AX) rights issue.
  • I did some trading of Regal Funds (RF1.AX). It is tending to fluctuate around the NAV.
  • I shifted another AUD 25k from Aspect Diversified Futures Wholesale to First Sentier Developing Companies on the Colonial First State platform and then sold and withdrew the rest of our holding to reduce debt.
  • I sold 20k Cadence (CDM.AX) shares to increase cash in our SMSF brokerage account.
  • I did a quick Australian Dollar Futures trade, which didn't work out well.

Monday, October 03, 2022

Moominmama Actually Had Negative Tax for 2021-22

Not sure why the calculation I posted here showed positive tax, but both the ATO and my own calculation show that Moominmama's tax assessment was -$127 for 2021-22. That's kind of like the holy grail or something :)

Heading for a Fall in Net Worth

 This is why I have been concerned about saving money recently:

I'm currently forecasting that this year comprehensive after-tax income (including superannuation and unrealized capital gains/losses) will be less than spending. This would be the first decline in end of year net worth (not counting our house) since the financial crisis.


Friday, September 30, 2022

Classic Case of Bad Market Timing


At the beginning of the 2020-21 financial year the Macquarie Winton Global Alpha Fund (managed futures) had AUD 1.27 billion in assets. It only returned AUD 1 million that year and had been performing weakly for a while. In the 2020-21 financial year there were net redemptions of AUD 829 million. Then in 2021-22 it made AUD 80 million. There were still net redemptions of AUD 194 million this year and the fund is down to AUD 324 million in assets.

More Saving

This blog hasn't really been about saving money in terms of spending less. But facing a year with negative returns and maybe even a fall in net worth in the end, I have focused on cutting expenditure and costs. By switching our car insurance from a comprehensive policy to a third party property damage policy I saved about AUD 400 a year. A reduction from about AUD 675 to AUD 175. The insurance company only values our car at AUD 2,300 and the excess is AUD 695. So, it just didn't make sense to me to insure the car itself. On the new policy we can still get a payout if our car is damaged in an accident by an uninsured driver. 


Recently we also called a plumber to look at all the faulty taps in the house. They can't repair taps with ceramic disks and so I decided to just replace all the 7 sets of taps in the house. The plumber told me that I can save money by going buying the taps myself and then getting them to install them. Saving is about $500. So, today we went to a bathroom/plumbing store and selected and ordered taps.

I wonder what Ramit would think about all this?

Wednesday, September 21, 2022

Not Renewing Wholesale Investor Status

I got a message from Interactive Brokers that I needed to renew my wholesale investor status as two years had passed since I submitted an accountant's certificate. They currently only allow retail investors to borrow a maximum of AUD 50k in margin loans. The accountant agreed to do it again and I sent her all the relevant material to prove my net worth was more than AUD 2.5 million that took me 2-3 hours to put together. I came up with a number of AUD 3.7 million – the test is done on an individual not family basis – and so thought it would be easy. But now she has come back and said she can't include any superannuation in the number! So she estimates my net worth for the purpose of the test is AUD 2.4 million. She suggested I get a professional valuation of my house to prove the higher number I suggested for it (AUD 1.25 million).

It doesn't make any sense to me that an SMSF would be excluded but home equity included.

Anyway, I looked carefully at my Interactive Brokers account. Currently, I could borrow a maximum of AUD 96k. The saving in interest per year for the amount above 50k compared to CommSec is about AUD 5k. But I am unlikely to borrow that much, as I don't want to get a margin call if things go pear-shaped. So, I've decided not to do the property valuation, because it might come in lower and I still wouldn't qualify. I will wait till when I actually want to borrow more or make a new venture capital investment in Australia and I am closer to qualifying. 

Of course, it is much easier to qualify as an accredited investor under US rules. Moominmama qualified in order to participate in AngelList even though her net worth including super is definitely under AUD 2.5 million.

Tuesday, September 13, 2022

Childcare and Education Spending

Spending on childcare and education is by far our largest spending category now and has gone up steeply. We are now at AUD 47k for the last 12 months, which is 30% of spending. So, I was wondering where all that money was going:

Turns out that we are spending twice as much on daycare for the 3 year old as on private school for the 6 year old. We get little childcare subsidy. We also spent $4k on deposits for the two children to start at a new private school in 2024. We shouldn't have that expenditure again and the government wants to increase childcare subsidies. So, perhaps this is peak expenditure on this category in real terms until they are both in high school? School fees first fall and then increase again with age.


Tuesday, September 06, 2022

Lowered my Mortgage Rate

I read in the Australian Financial Review that having an offset facility usually means that the mortgage interest rate that you are paying is higher and that this gap is biggest at the Commonwealth Bank, where we have our mortgage and offset account. The article said that the gap could be as big as 1.91%! I don't remember this being explained to me when we got our mortgage and offset account though I did discuss with the salesperson whether we should get an offset account. 

I have wondered why our mortgage rate was so high and tried to move our mortgage to HSBC to get a lower rate. They just continually ran me around and nothing ever happened. So, I gave up on that.

So, I phoned the bank and he told me that I should phone regularly to "review my discounts", which I have never done. Basically, there is a seniority discount - the longer you are with the bank the more the discount. So the standard rate for the offset account is actually 6.3%. I was paying 5.4%. He increased the discount from 0.9% to 2.29%, lowering my mortgage rate to 4.01%. If I switched to the no frills product cited in the AFR he could only give me a 0.2% discount off the 5.53% standard rate. 

I estimate the gain in net worth at the end of the mortgage, assuming we don't pay off the mortgage any faster, is AUD 271k at 6% inflation and AUD 188k at 3% future inflation. The saved interest is in the ballpark of AUD 90k. It feels weird to earn that much for about an hour's work.

Sunday, September 04, 2022

August 2022 Report

August was a mixed month. The MSCI World Index (USD gross) lost by 3.64% and the S&P 500 lost 4.08% in USD terms, but the ASX 200 gained 1.43% in AUD terms. All these are total returns including dividends. The Australian Dollar fell from USD 0.6968 to USD 0.6855 but it rose against the Pound from one Pound buying AUD 1.7430 to AUD 1.6958. We gained 0.25% in Australian Dollar terms but lost 1.38% in US Dollar terms. The target portfolio lost 0.71% in Australian Dollar terms and the HFRI hedge fund index rose 0.50% in US Dollar terms. So, we out-performed three benchmarks and under-performed two.

Here is a report on the performance of investments by asset class: 

The asset class returns are in currency neutral returns as the rate of return on gross assets. I have added in the contributions of leverage and other costs and the Australian Dollar to the AUD net worth return.

Hedge funds were the biggest contributor to performance followed by futures, which had the strongest return. US stocks were the worst performer followed by gold and rest of the world stocks.

Things that worked well this month:

  • Pershing Square Holdings was the best performer (AUD 11k) followed by Aspect Diversified Futures (10k) and Winton Global Alpha (8k).

What really didn't work:

  • Australian Dollar Futures lost AUD 7k.

The investment performance statistics for the last five years are: 

The first three rows are our unadjusted performance numbers in US and Australian dollar terms. The following four lines compare performance against each of the three indices over the last 60 months. The final three rows report the performance of the three indices themselves. We show the desired asymmetric capture and positive alpha against the ASX200 but not against the hedge fund index nor the MSCI. Compared to the ASX200, our rate of return has only been 0.6% lower, but our volatility has been 5% lower. We are performing 2% per annum worse than the average hedge fund levered 1.7 times.

We moved a bit away from our target allocation. Our actual allocation currently looks like this:

About 70% of our portfolio is in what are often considered to be alternative assets: real estate, art, hedge funds, private equity, gold, and futures. A lot of these are listed investments or investments with daily, monthly, or quarterly liquidity, so our portfolio is not as illiquid as you might think.

We receive employer contributions to superannuation every two weeks. We are now contributing USD 10k each quarter to Unpopular Ventures Rolling Fund and less frequently there will be capital calls from Aura Venture Fund II. In addition we made the following investment moves this month:

  • I bought AUD 75k of units in the Aspect Diversified Futures Fund (Class A). This cash came from the redemption of Pershing Square Tontine Holdings. 
  • I sold AUD 25k of the First Choice Wholesale version of this fund and bought units of First Sentier Developing Companies instead.
  • I switched about USD 17k from the TIAA Real Estate Fund to the TIAA Social Choice Fund (a balanced fund).
  • I traded 10k shares of Regal Funds (RF1.AX) a couple of times.
  • I invested USD 2.5k in a start-up offered by the Unpopular Ventures syndicate. 
  • I sold 12.5k shares of WAM Leaders (WLE.AX) to fund venture capital investments.
  • I sold 3k shares of Ruffer Investment Company (RICA.L) for the same purpose. 
  • We received the payout from the sale of Lured.