In February, stock markets fell again. The MSCI World Index (USD gross) fell 2.83% and the S&P 500 2.44% in USD terms, while the ASX 200 lost 2.25% in AUD terms. All these are total returns including dividends. The Australian Dollar fell from USD 0.7113 to USD 0.6740. We also lost money: 0.47% in Australian Dollar terms or 5.69% in US Dollar terms. The target portfolio gained 0.72% in Australian Dollar terms and the HFRI hedge fund index is expected to lose about 0.83% in US Dollar terms. So, we out-performed the ASX200 but under-performed all the other benchmarks.
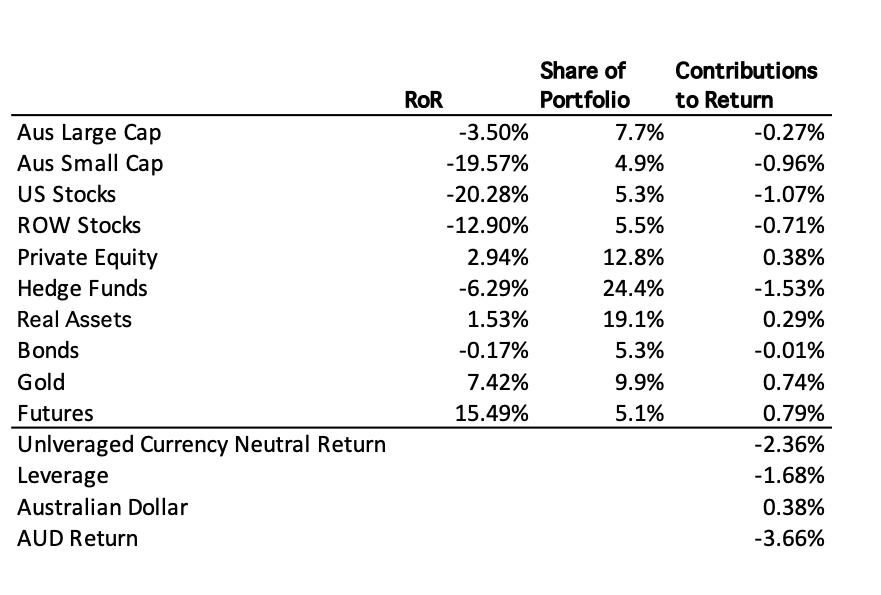
Here is a report on the performance of investments by asset class:

Real assets were the main positive contributor to returns and the highest returning asset class while hedge funds were the largest detractor.
Things that worked well this month:
- URF.AX (US residential real estate) was the biggest gainer adding AUD 11k, followed by two managed futures funds: Winton Global Alpha (9k) and Aspect Diversified Futures (6k).
What really didn't work:
- Tribeca Global Resources (TGF.AX) lost AUD 30k. The next worse were the China Fund (CHN, -19k) and Australian Dollar Futures (-15k).
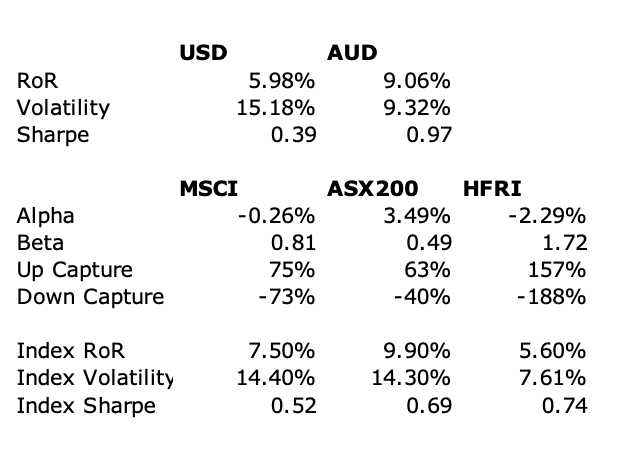
The investment performance statistics for the last five years are:

We are now very close to our target allocation but we mived away from it quite sharply during the month. In particular, real assets increased as we added to URF.AX and it rose, while private equity fell as we took profits in PE1.AX. Our actual allocation currently looks like this:

About 70% of our portfolio is in what are often considered to be alternative assets: real estate, art, hedge funds, private equity, gold, and futures. A lot of these are listed investments or investments with daily, monthly, or quarterly liquidity, so our portfolio is not as illiquid as you might think.
We receive employer contributions to superannuation every two weeks. We are now contributing USD 10k each quarter to Unpopular Ventures Rolling Fund and less frequently there will be capital calls from Aura Venture Fund II. In addition, we made the following investment moves this month:
- I bought 1,000 shares of the gold ETF, PMGOLD.AX.
- I sold 4,000 shares of WAM Leaders (WLE.AX).
- I sold 59,976 shares of Pengana Private Equity (PE1.AX).
- I bought 29,638 shares of the Cordish-Dixon private equity fund CD3.AX.
- I bought 25,000 shares of MCP Income Opportunities private credit fund (MOT.AX).
- I bought 65,000 shares of URF.AX (US residential real estate).